
State of the climate: 2024 off to a record-warm start
Zeke Hausfather
04.23.24Zeke Hausfather
23.04.2024 | 5:35pmThis year is shaping up to either match or surpass 2023 as the hottest year on record.
Global temperatures have been exceptionally high over the past three months – at around 1.6C above pre-industrial levels – following the peak of current El Niño event at the start of 2024.
The past 10 months have all set new all-time monthly temperature records, though the margin by which new records have been set has fallen from around 0.3C last year to 0.1C over the first three months of 2024.
April 2024 is on track to extend this streak to 11 record months in a row.
The first quarter of this year has seen record-high global temperatures across vast swathes of the planet, including in the tropical Atlantic and western Pacific oceans, much of South America, Central Africa, the Mediterranean and the Indian Ocean.
Based on the year so far and the current El Niño forecast, Carbon Brief estimates that global temperatures in 2024 are likely to average out at around 1.5C above pre-industrial levels.
Although precise predictions are difficult so early in the year, Carbon Brief’s projection suggests that 2024 is virtually certain to be either the warmest or second-warmest year on record.
Global temperatures continue setting records
The first three months of 2024 have each set a new record, buoyed by the peak of El Niño conditions in the tropical Pacific.
This short-term natural variability builds on top of the roughly 1.3C warming that has occurred since the mid-1800s due to human emissions of CO2 and other greenhouse gases.
The figure below shows how global temperature so far in 2024 (purple line) compares to each month in different years since 1940 (with lines coloured by the decade in which they occurred) in the Copernicus/ECMWF ERA5 surface temperature dataset.
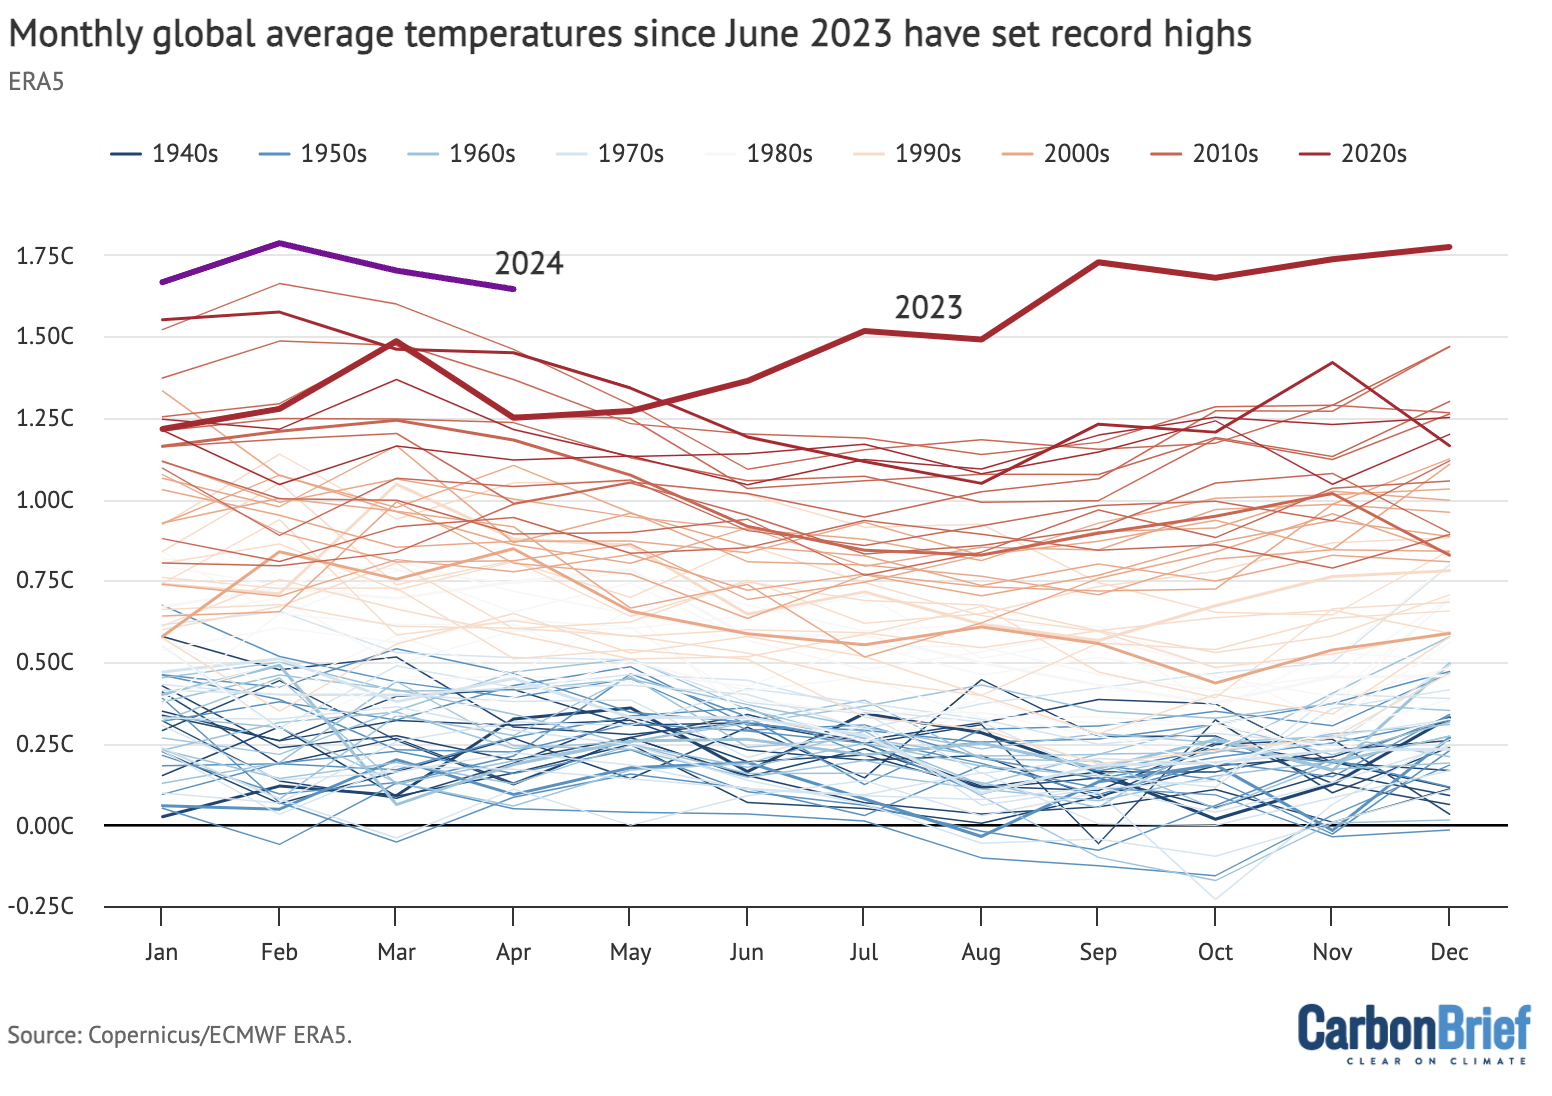
Every month from June 2023 onward – 10 months in a row – have set a clear record. The past three months have each been around 0.1C warmer than the prior record set during the 2016 super El Niño event.
In this latest quarterly state of the climate assessment, Carbon Brief analyses records from five different research groups that report global surface temperature records: NASA, NOAA, Met Office Hadley Centre/UEA, Berkeley Earth and Copernicus/ECMWF.
The figure below shows the annual temperatures from each of these groups since 1970, along with the average over the first three months of 2024. (Note: at the time of writing, March data was not yet available for the Hadley/UEA record.)
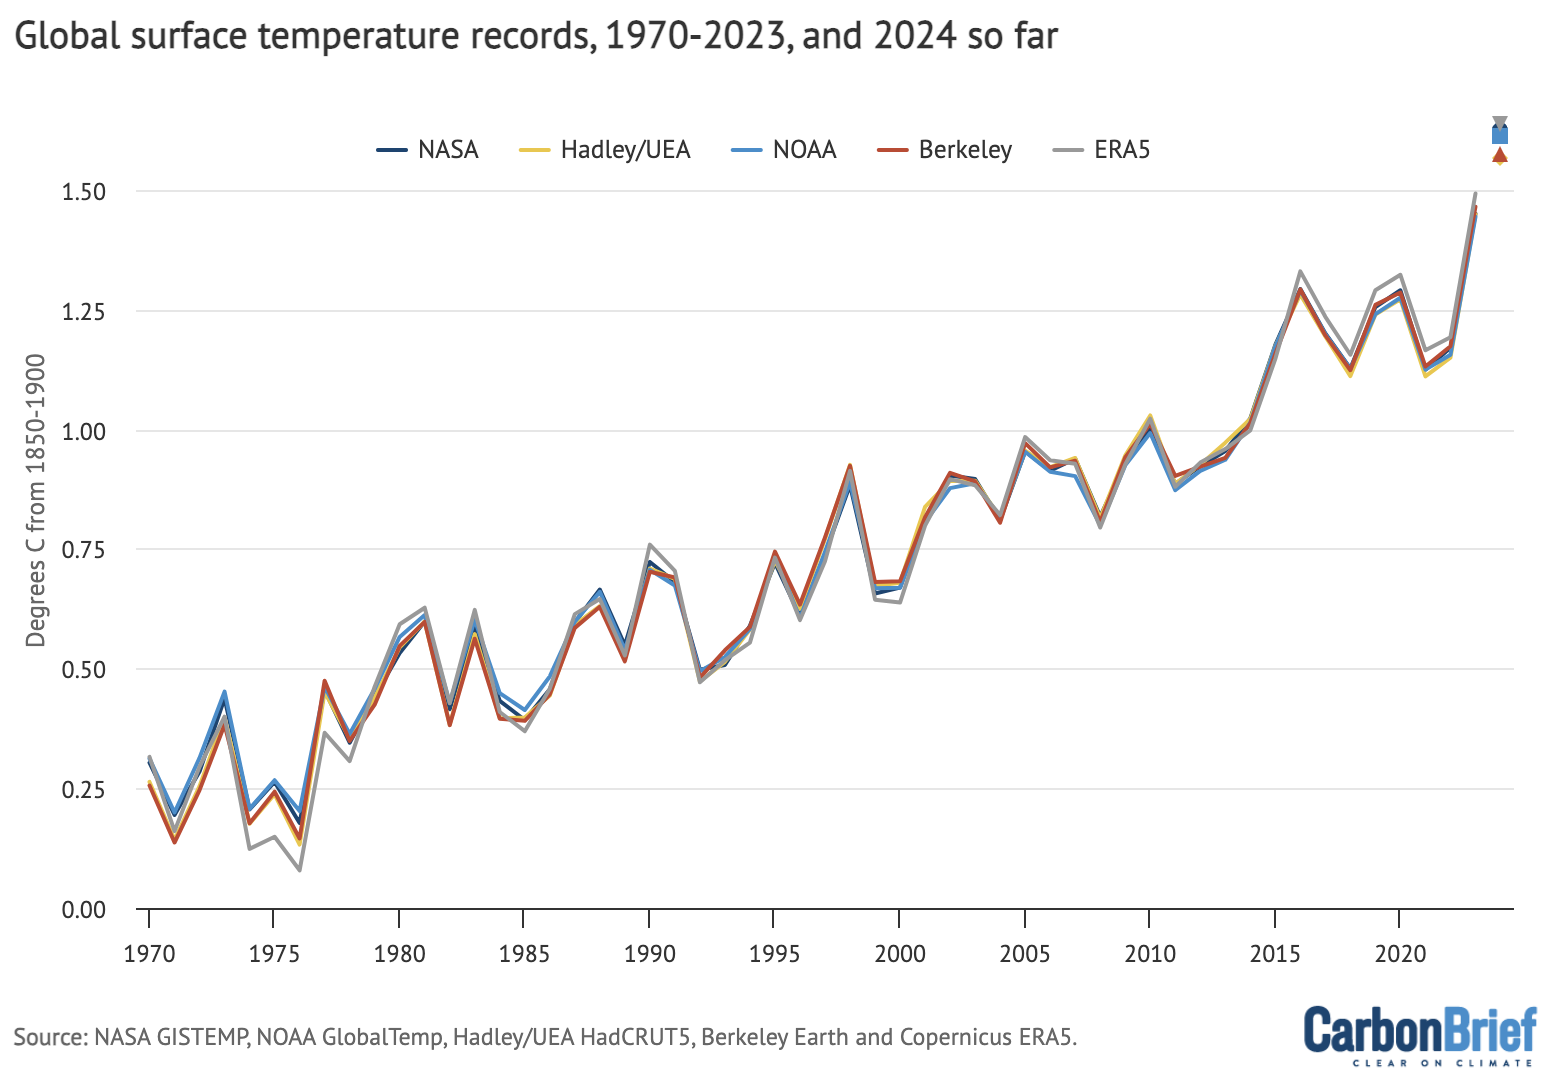
The globe, as a whole, has warmed around 1C since 1970, with strong agreement between different global temperature records. However, there are larger differences between temperature records further back in time (particularly pre-1900) due to sparser observations and a resulting greater sensitivity to how gaps between measurements are filled in.
All show that the average global temperature for 2024 so far is higher than any prior annual record. However, the first quarter of 2024 is unlikely to end up being representative of the year as a whole due to the fading of El Niño conditions and the expectation of a developing La Niña event later in the year.
Record global daily temperatures
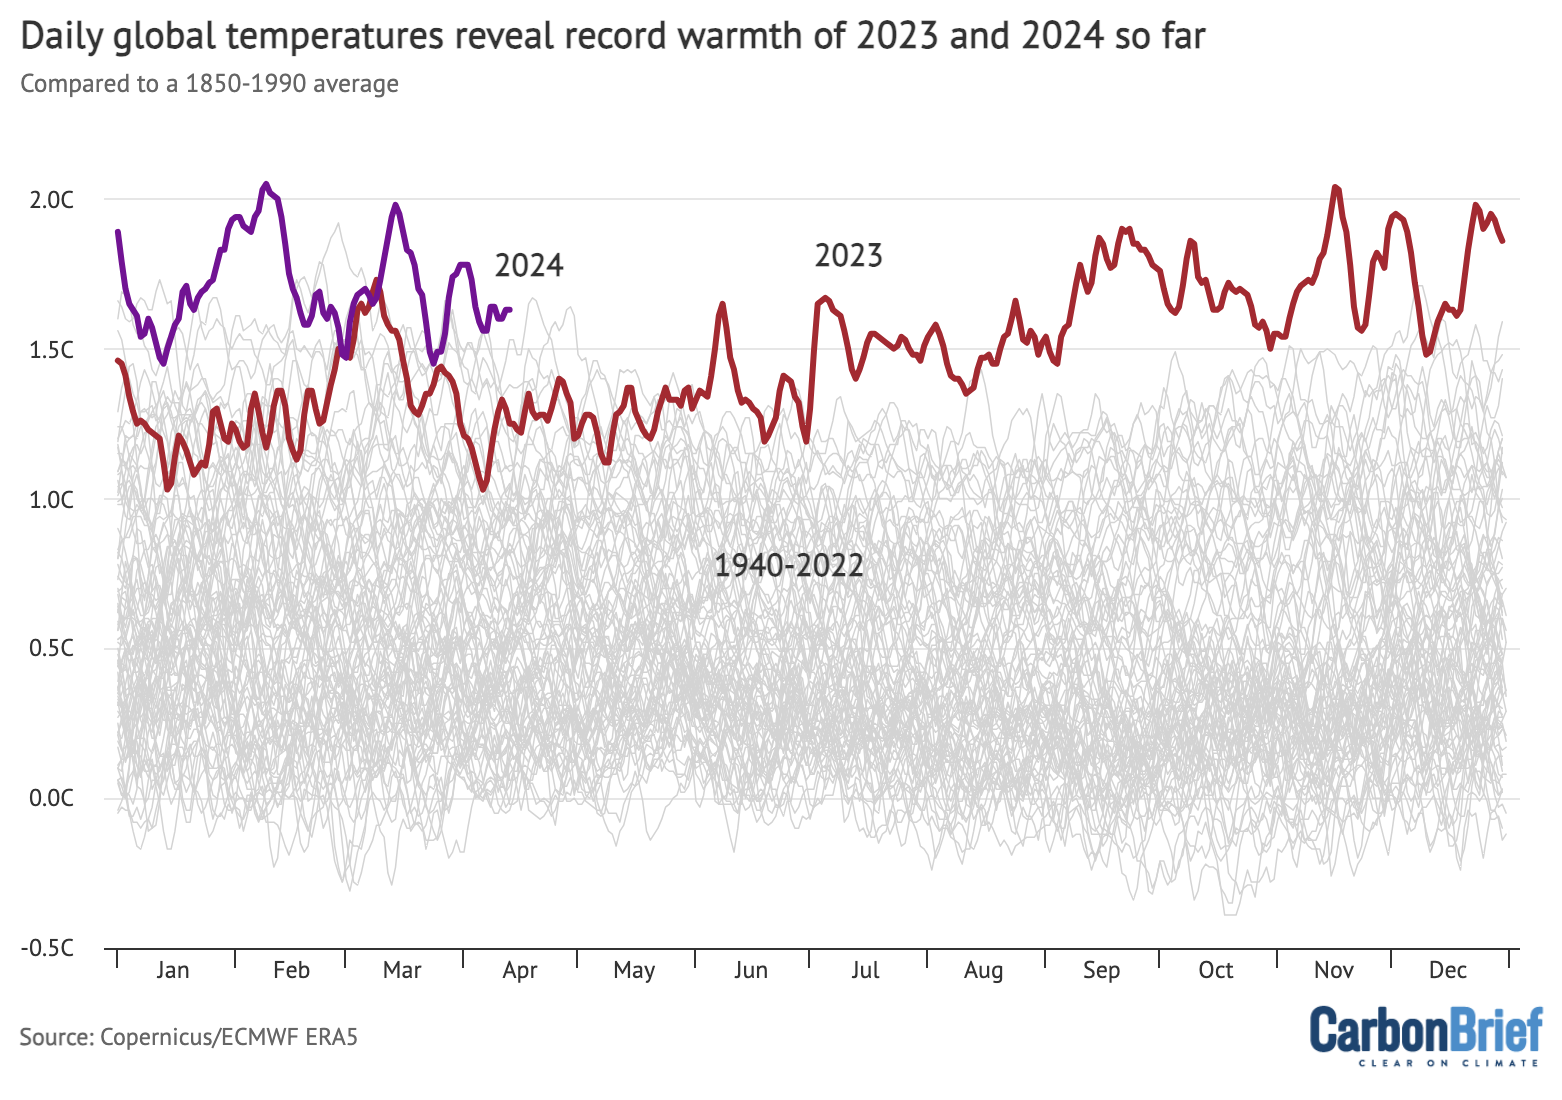
The figure below shows daily temperature data from the Copernicus/ECMWF ERA5 record for 2024 (purple line), 2023 (red line) and 1940-2022 (grey lines).
It highlights that April 2024 is on track to continue the streak of record warm months, with most of the individual days of the month so far setting a new daily record for the time of year.
The chart below shows an alternative visualisation, with daily temperatures shown by colours ranging from blue (-2C) to red (+2C), with the pre-industrial average (1850-1900) set to 0C. The figure below shows each day since 1940 in the Copernicus/ECMWF ERA5 dataset.
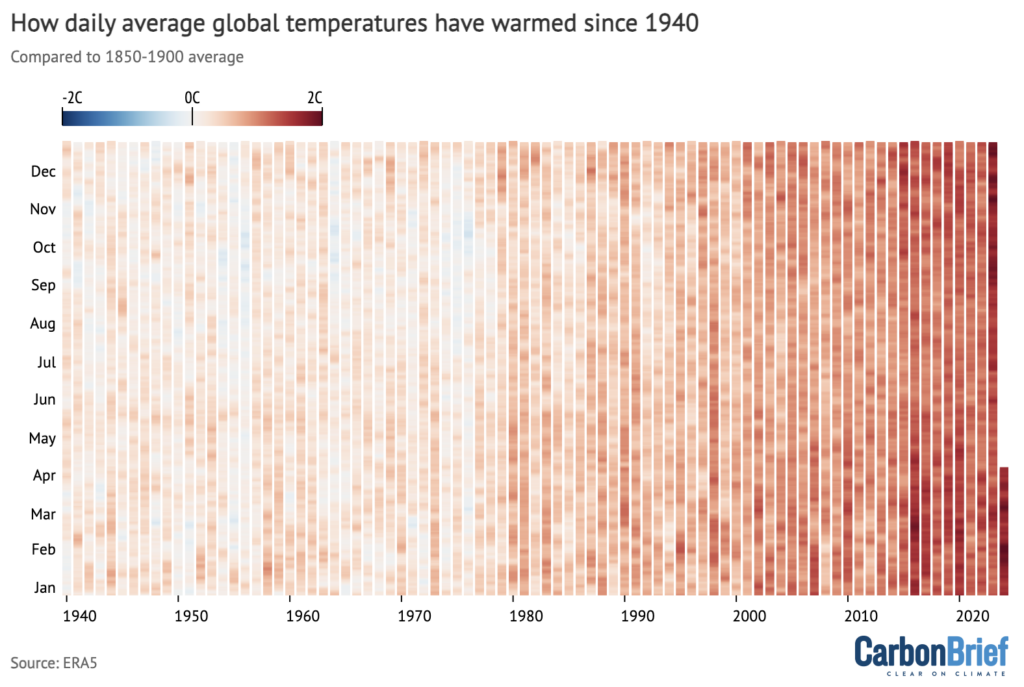
It is notable that almost every day over the past 50 years has seen temperatures higher than pre-industrial levels, with both 2023 and 2024 so far showing up as particularly warm compared to any prior years in the record.
El Niño boosting human-caused warming
Global temperatures have been buoyed in recent months by a strong El Niño event. However, this event has peaked and is expected to transition into La Niña conditions in the latter part of the year.
The figure below shows a range of different forecast models for the El Niño-Southern Oscillation (ENSO) for the rest of this year, produced by different scientific groups. The values shown are sea surface temperature variations in the tropical Pacific – the El Niño 3.4 region – for overlapping three-month periods.
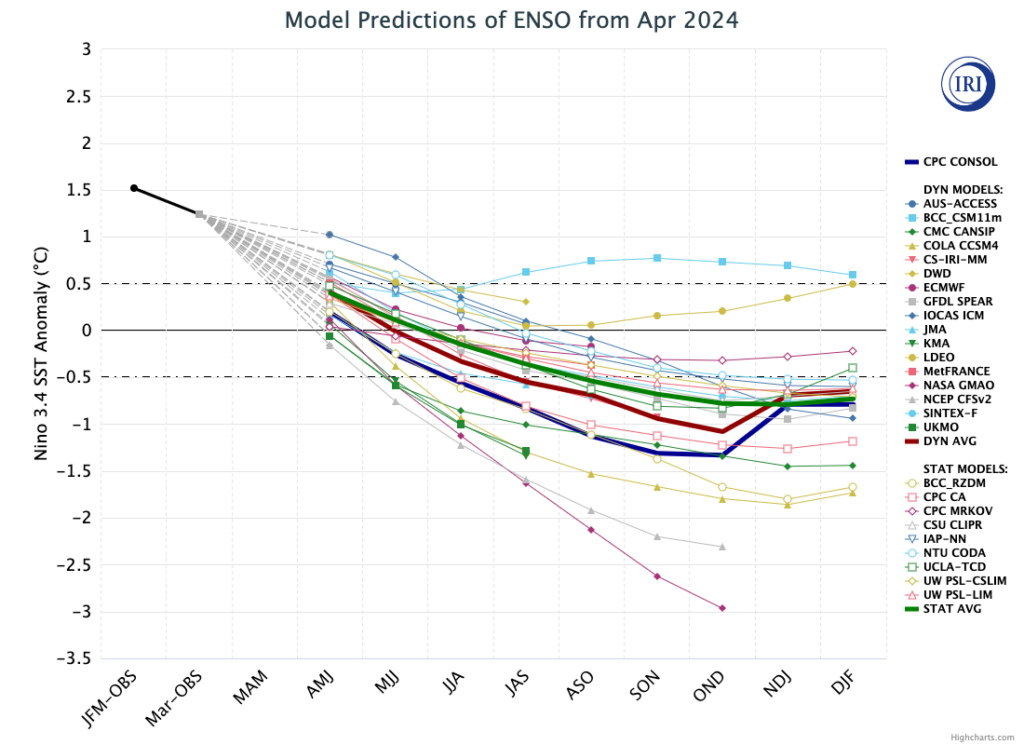
Virtually all models expect El Niño conditions to fade rapidly and be replaced by La Niña conditions by late summer. Most models project a moderate La Niña (<-0.5C Niño 3.4 sea surface temperature – SST – anomaly) to develop by the end of the year.
Early predictions for a warm 2024
Historically, the highest global surface temperatures have occurred after an El Niño has peaked at the start of the year.
This happened in both of the last two major El Niño events, in 1998 and 2016, which were notably warmer than the prior years (1997 and 2015) during which their respective El Niño events developed.
However, 2023 was highly unusual. It showed global temperatures more akin to what we would expect after El Niño peaks, rather than while it is still developing.
Annual temperatures ended up well outside of the range that all of the different scientific groups projected at the start of the year. There is still no agreed explanation for the extreme warmth, particularly in the latter half of the year.
The figure below shows the record margin (red bars) – the amount that global average temperatures surpassed the prior monthly temperature record – in each month of over the past year.
Summer and autumn 2023 saw records being set by large margins: 0.5C in September, 0.4C in October and 0.3C in July, August, November and December.
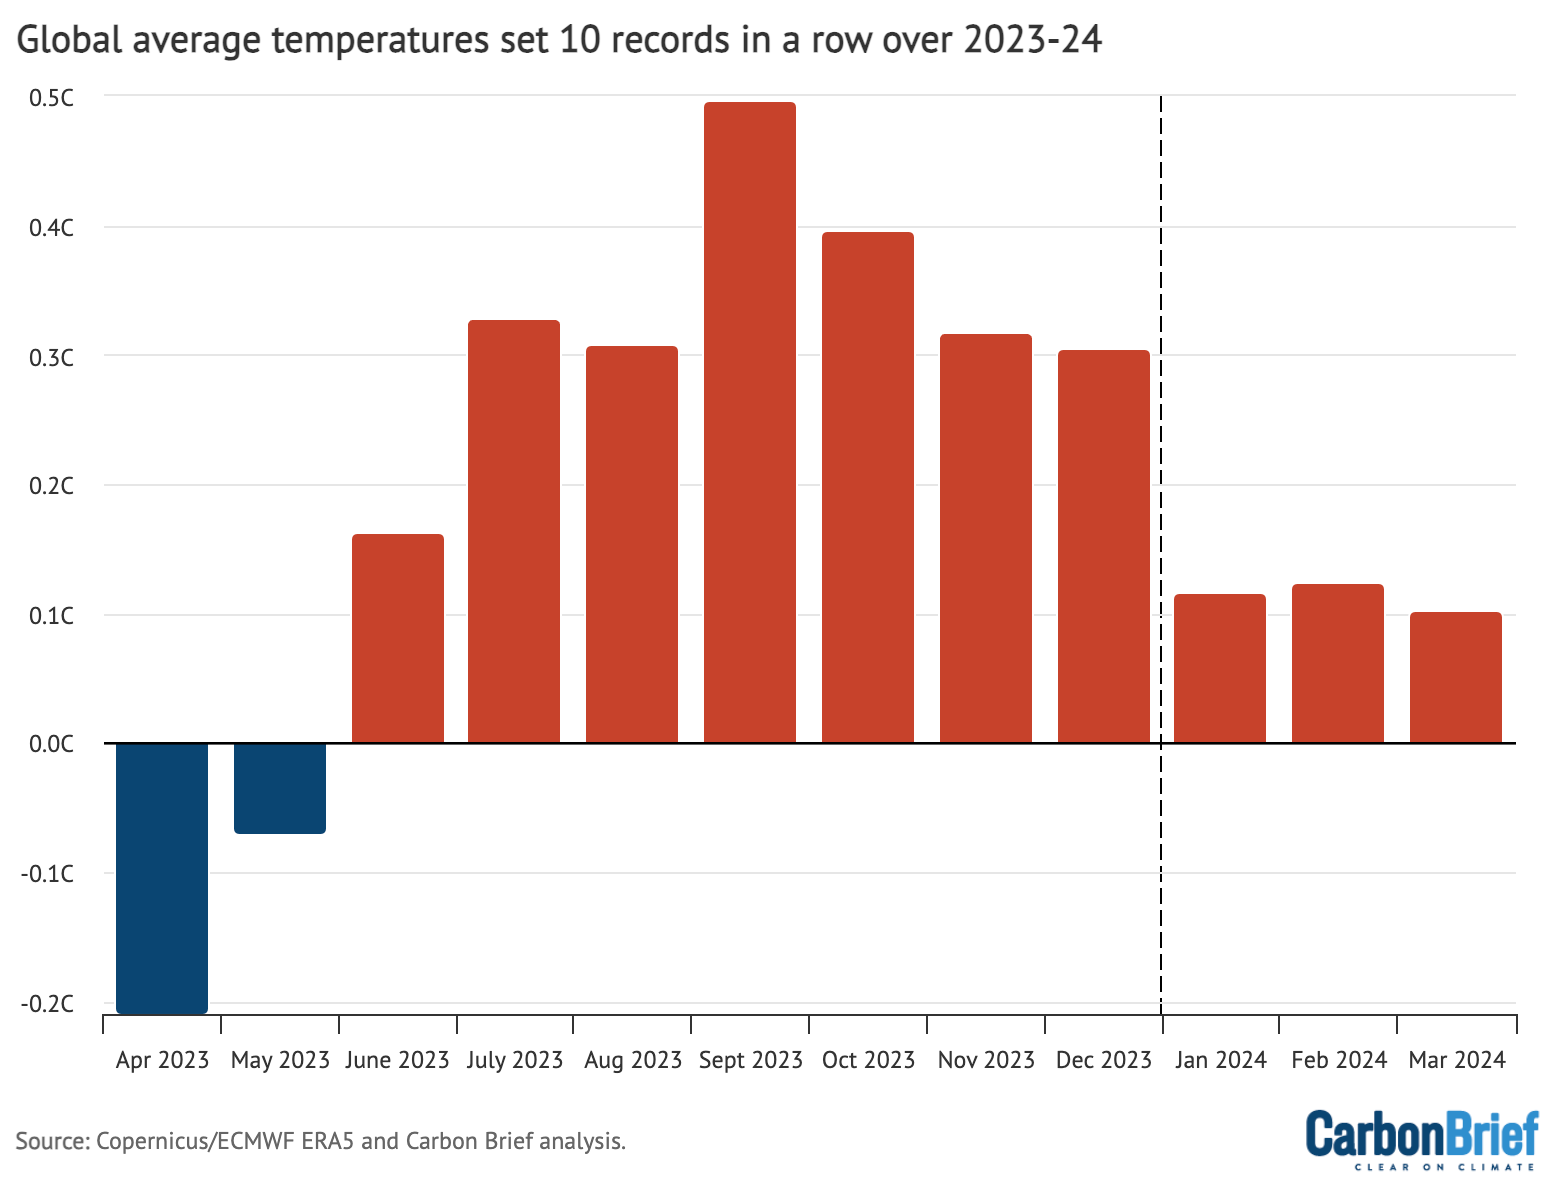
The past three months have seen new records set by only around 0.1C. The prior records for January, February, and March were set in 2016, and given the rate of warming since then we would expect new records to be set by about 0.1C in the year after El Niño peaks. If this year follows the trajectory of 2016, we would expect global temperatures to start falling over the coming months.
However, the fact that the exceptional warmth of 2023 remains largely unexplained raises questions about whether the past will be a good guide for what 2024 has in store. If the latter half of 2024 ends up similar to 2023, there is a worry that we might be entering what has been described as “uncharted territory” for the climate.
As NASA’s Dr Gavin Schmidt noted in a recent Nature commentary:
“If the anomaly does not stabilise by August – a reasonable expectation based on previous El Niño events – then the world will be in uncharted territory. It could imply that a warming planet is already fundamentally altering how the climate system operates, much sooner than scientists had anticipated. It could also mean that statistical inferences based on past events are less reliable than we thought, adding more uncertainty to seasonal predictions of droughts and rainfall patterns.”
By looking at the relationship between the first three months and the annual temperatures for every year since 1970 – as well as ENSO conditions for the first three months of the year and the projected development of El Niño conditions for the remaining nine months – Carbon Brief has created a projection of what the final global average temperature for 2024 will likely turn out to be.
The analysis includes the estimated uncertainty in 2024 outcomes, given that temperatures from only the first quarter of the year are available so far. The chart below shows the expected range of 2024 temperatures using the Copernicus/ECMWF global atmospheric reanalysis product (ERA5) – including a best-estimate (red) and year-to-date value (yellow). Temperatures are shown with respect to the pre-industrial baseline period (1850-1900).
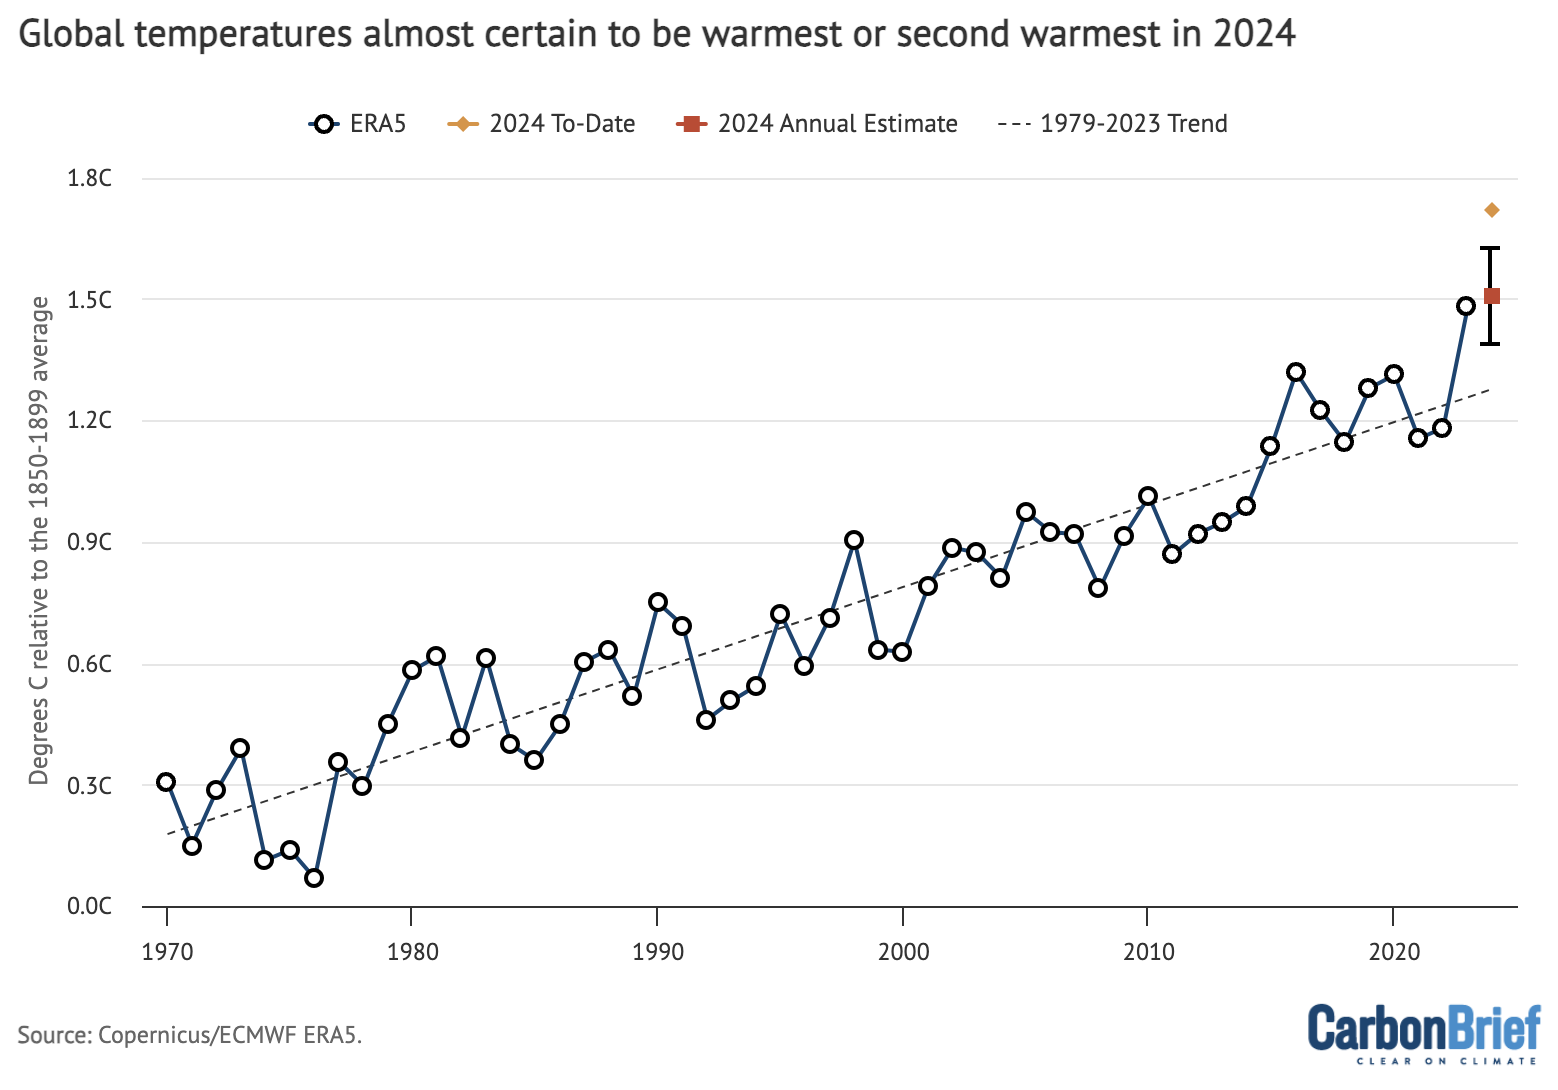
Carbon Brief’s projection suggests that 2024 is virtually certain to be either the warmest or second- warmest year on record, with a central estimate just above 1.5C, slightly higher than 2023. However, this model assumes that 2024 follows the type of climate patterns we have seen in the past – patterns that were notably broken in 2023.
It is worth repeating that an individual year hitting 1.5C above pre-industrial levels is not equivalent to the 1.5C limit within the Paris Agreement. This limit refers to long-term warming, rather than an individual year that includes the short-term influence of natural fluctuations in the climate, such as El Niño.
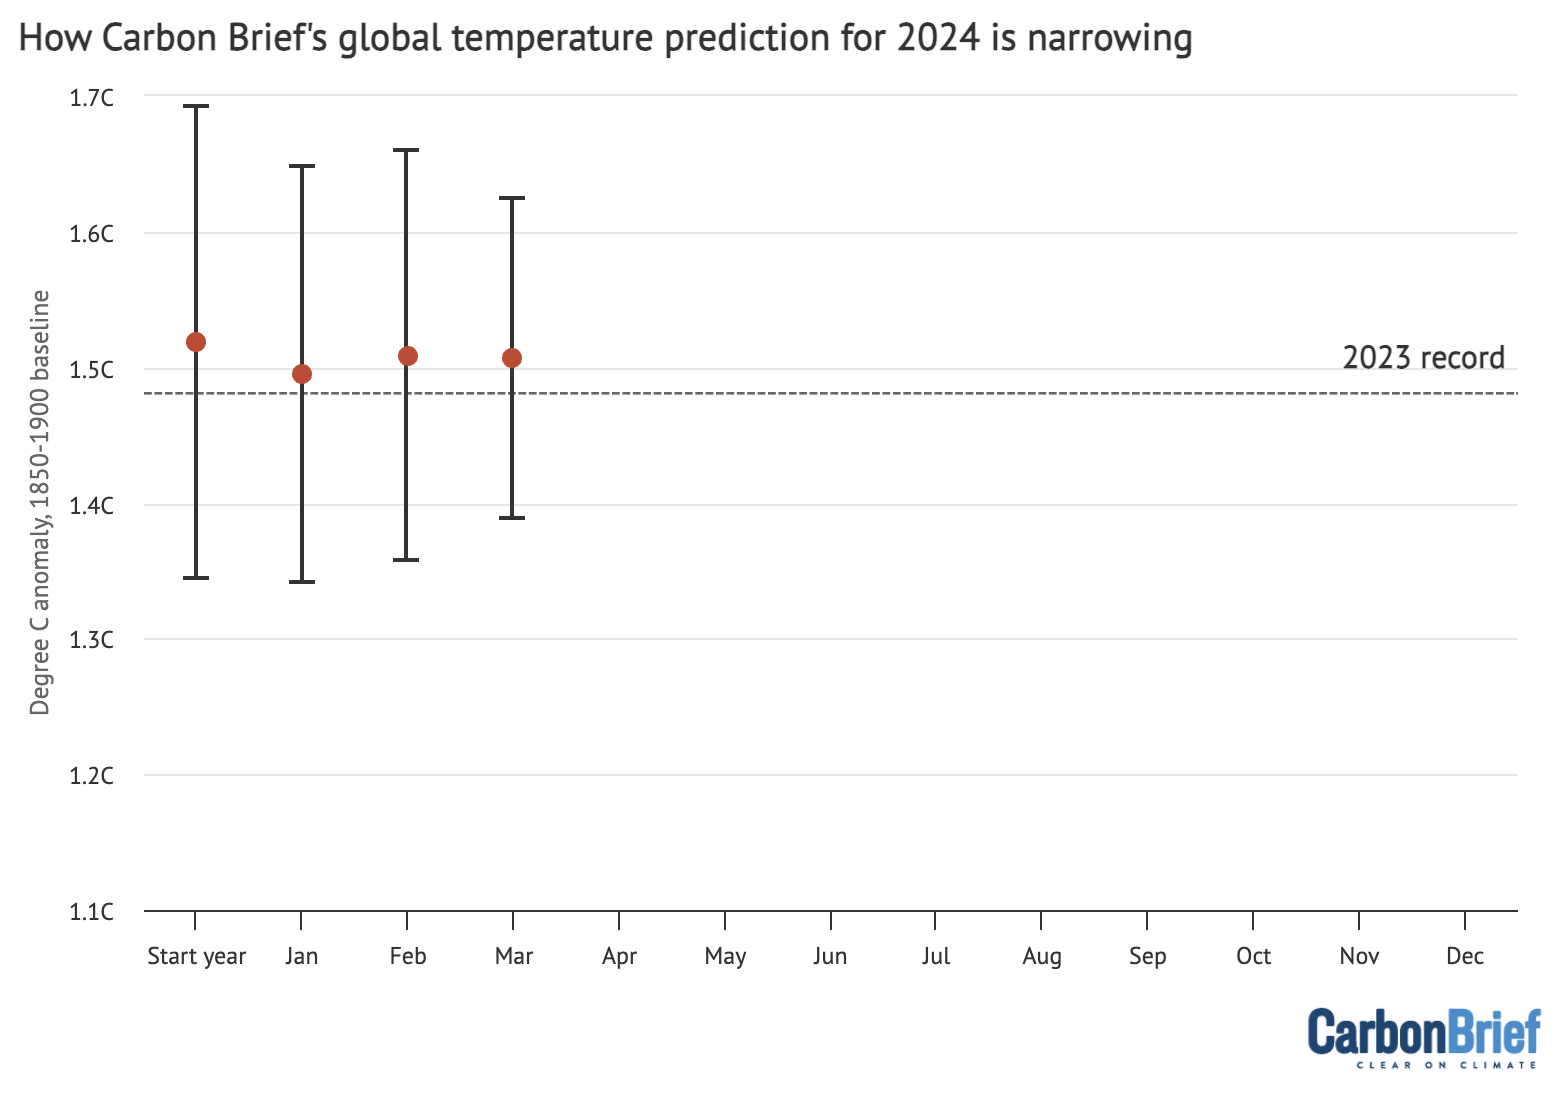
The figure below shows Carbon Brief’s estimate of 2024 temperatures using ERA5, both at the beginning of the year and once each month’s data has come in. While the central estimates have remained relatively unchanged, the uncertainty has diminished with each additional month of data.
Record warmth over large parts of the globe
While global average surface temperature changes are an important indicator of long-term climate change, any month or year will have important regional warm or cool patterns in different parts of the world.
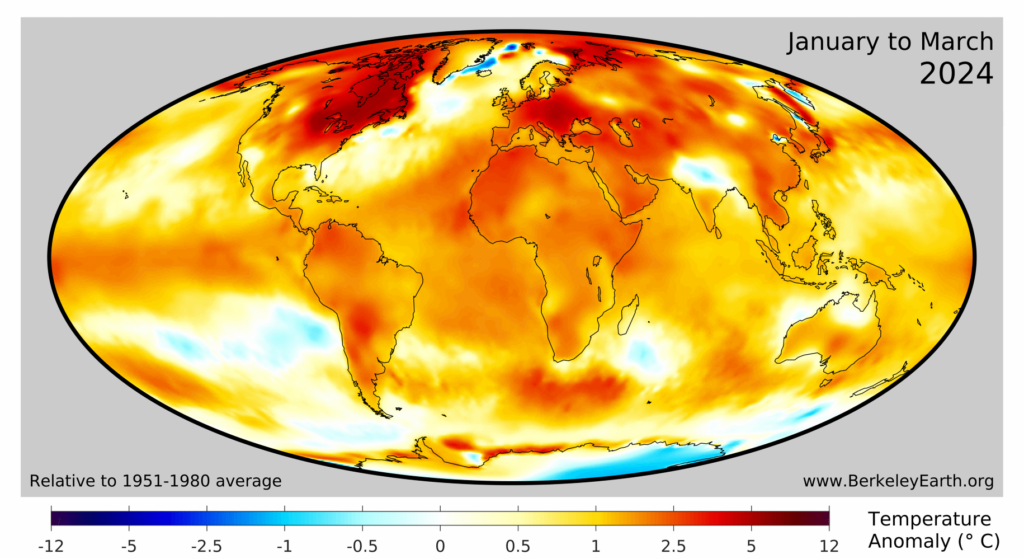
The first three months of 2024 saw particularly warm temperatures over the tropical Atlantic and western Pacific oceans, much of South America, Central Africa, the Mediterranean and the Indian Ocean.
The figure below shows the difference between temperatures in the first three months of 2024 and the baseline period of 1951-80, taken from Berkeley Earth (using their high-resolution temperature dataset). Red, orange and yellow shading indicate areas that have been warmer than average, while blue shows areas that have been cooler.
The figure below shows which portions of the Earth’s surface experienced record high temperatures (deep red shading) for the first three months of 2024. It is noteworthy that no location on the planet experienced record cold temperatures over the first quarter of the year.
Sea ice at the low end of the historical range
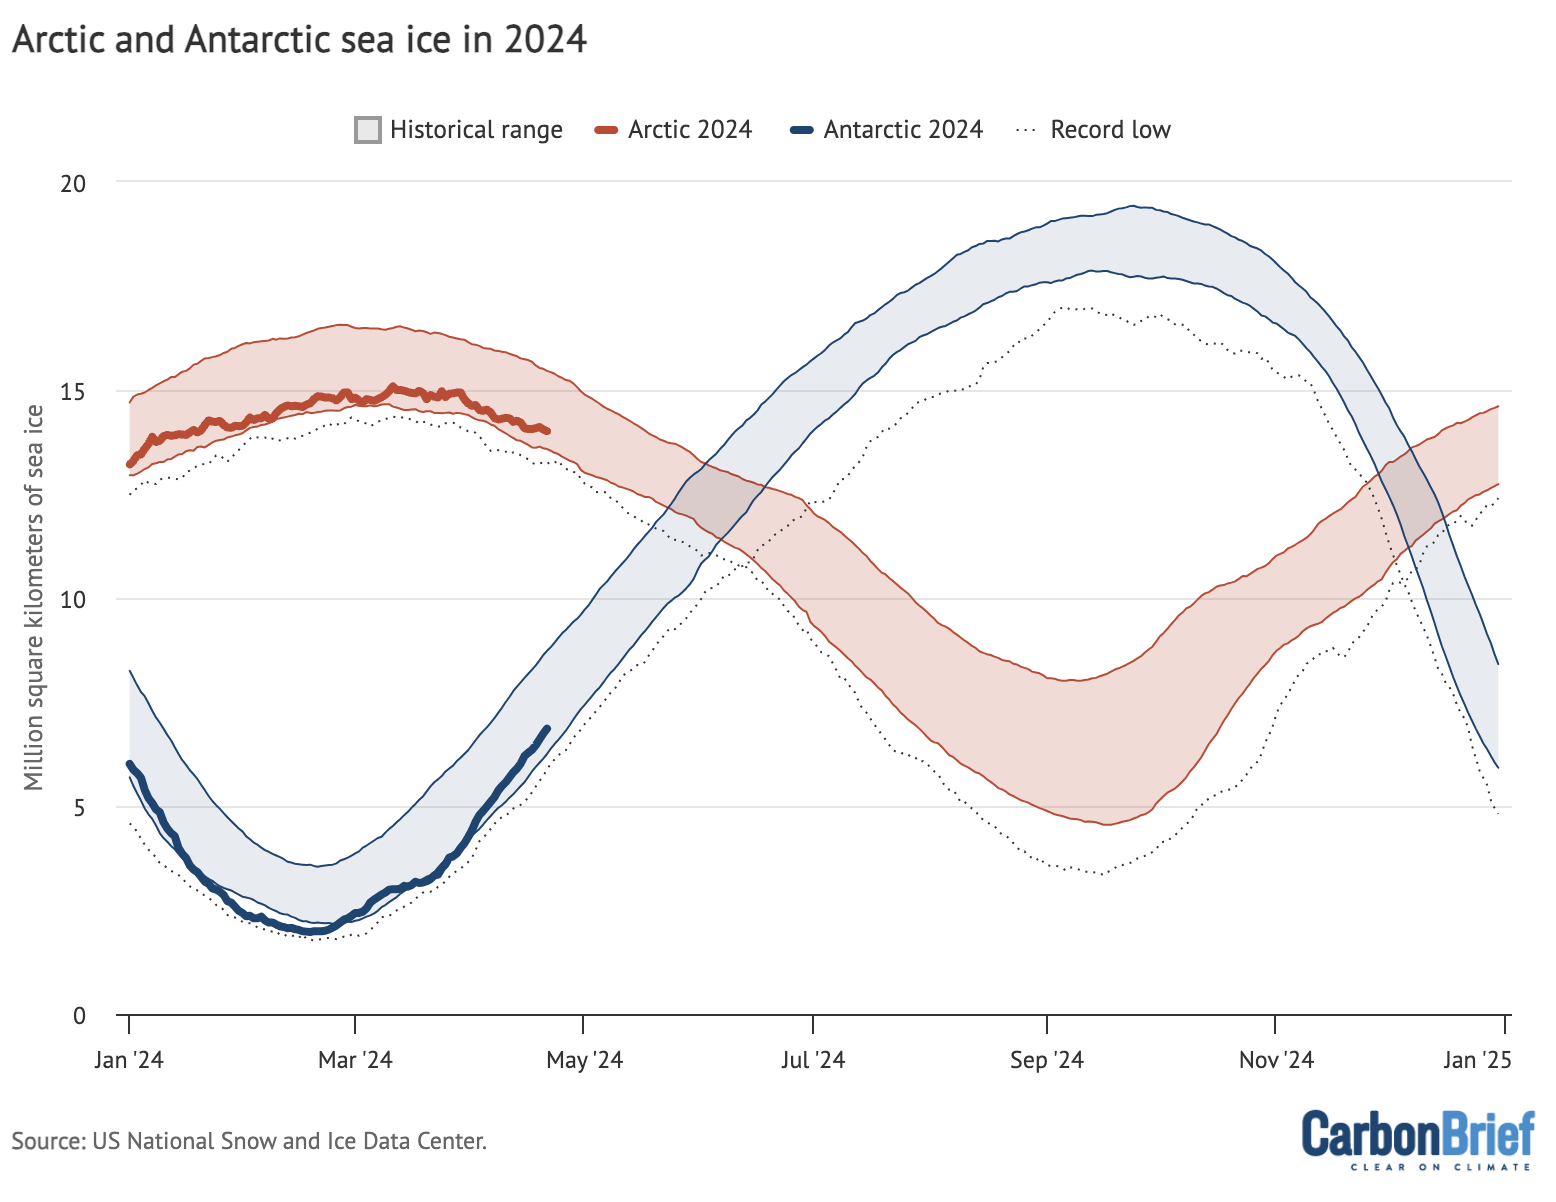
Arctic sea ice extent spent much of early 2024 at the low end of the historical 1979-2010 range, and set a few new record-low values for individual days in February and March.
Since northern hemisphere winter conditions remain cold enough to refreeze sea ice, there tends to be less variability in extent year-to-year in the winter than in the summer.
Following an all-time low maximum in September 2023, Antarctic sea ice has been tracking at near-record-low extent for the past six months. In late February, it hit its minimum extent for the year, tying with 2022 for the second-lowest Antarctic minimum in the satellite record.
The figure below shows both Arctic and Antarctic sea ice extent in 2024 (solid red and blue lines), the historical range in the record between 1979 and 2010 (shaded areas) and the record lows (dotted black line). Unlike global temperature records (which only report monthly averages), sea ice data is collected and updated on a daily basis, allowing sea ice extent to be viewed up to the present.
However, sea ice extent only tells part of the story. In addition to declining ice extent, the sea ice that remains tends to be younger and thinner than ice that used to cover the region.
The figure below, using data from the Pan-Arctic Ice Ocean Modelling and Assimilation System (PIOMAS), shows the Arctic sea ice thickness for every year between 1979 and 2024.
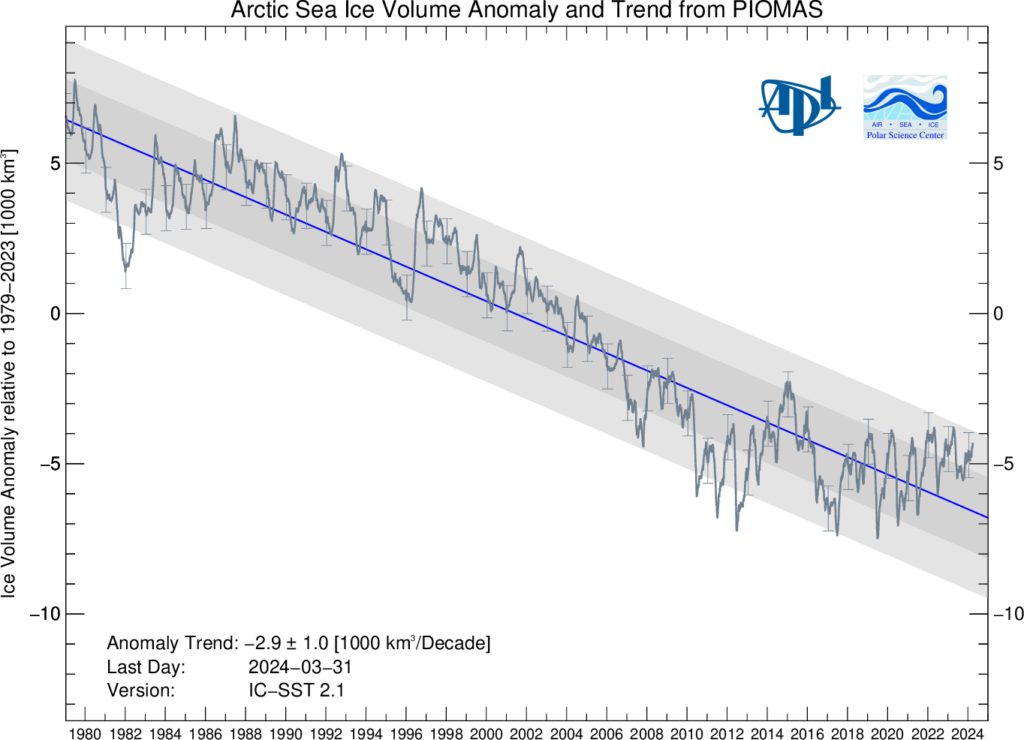
While sea ice volume has been flat or slightly increasing over the past five years, there has been a clear downward trend in sea ice volume since the start of the satellite record in the late 1970s.