By 2030, the world’s expected to have 1.3 billion more people. So where will all that extra energy come from? According to a recent report from oil giant BP, although renewables’ share in the energy mix will grow a bit, fossil fuels will still dominate, and emissions from energy use could rise by up to 26 per cent.
At the time BP’s Energy Outlook report was launched, media reports largely headlined on the view of its Group Chief Executive. He said fears that oil could run out “appear increasingly groundless“, and predicted that shale gas “ won’t be a game changer“. But what else does BP predict about our energy supplies in 2030? We take a closer look – and throw in some of the most interesting graphs.
What is the report?
Along with the International Energy Agency’s World Energy Outlook, BP’s annual report is one of the best-known analyses of future energy supplies. In comparison with the IEA’s several hundred page annual doorstop, BP’s effort is pretty accessible – with a slimline summary, a spreadsheet with all the numbers and an infographic animation featuring oddly cute-looking cartoons of oil wells. Well, it is BP.
Rather than taking the IEA’s approach of analysing several future energy mix scenarios, BP concentrates on the scenario it deems most likely. According to BP, its policy assumptions are closest to those in the IEA’s New Policies Scenario – in which countries deliver on the promises they have already made to reduce emissions, but don’t step it up any further.
Demand for energy: on the up
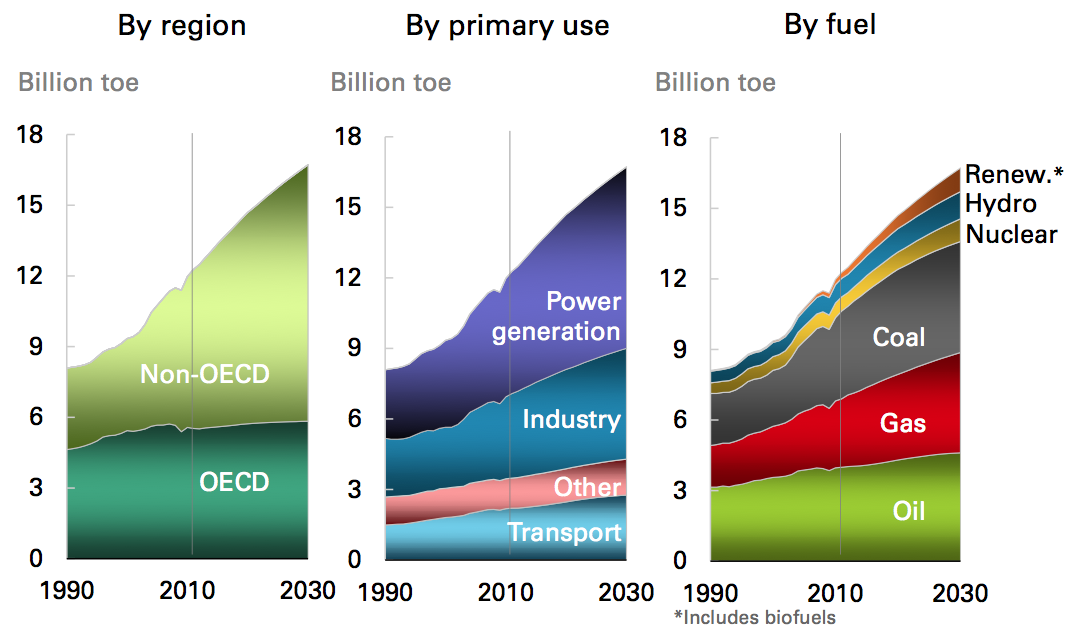
By 2030, BP projects world primary energy consumption will grow by just over a third – 36 per cent.
It anticipates the world’s developing economies – those outside the Organisation for Economic Cooperation and Development (OECD) – will account for more than 90 per cent of this growth, as the first graph below shows:
Energy supply – where will it come from?
As energy demand from growing economies increases, production will have to rise, too. But where is it going to come from? The following quite startling graphic gives an insight:
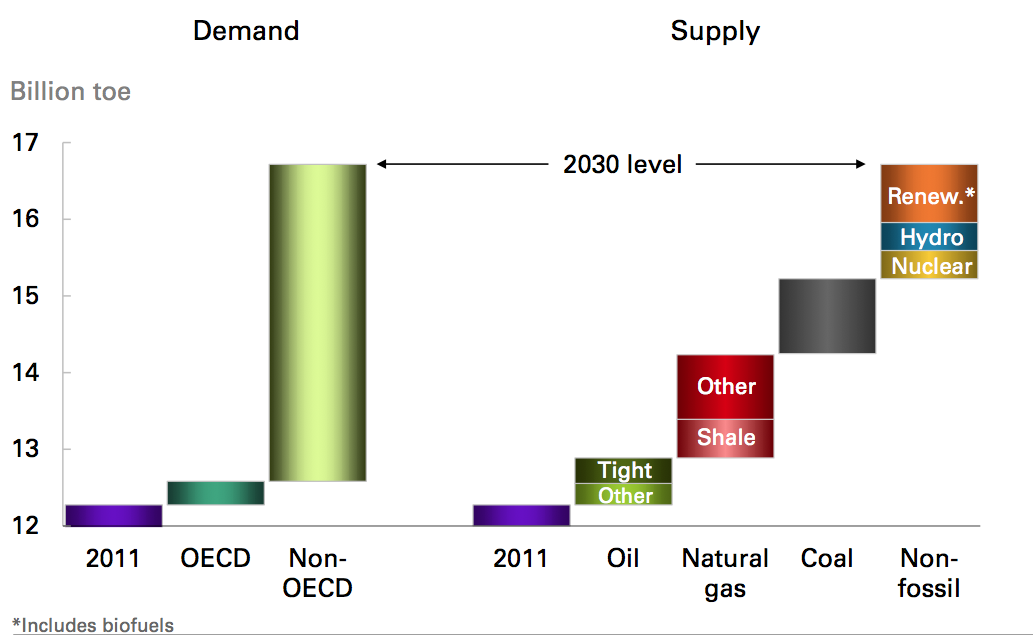
BP predicts that renewables will make up 27 per cent of the growth in energy supply to 2030, just ahead of growth in coal (26 per cent) and gas (21 per cent).
Taking each of the fuels in turn:
Gas
The much discussed US shale gas “ revolution” is certainly partly responsible for the growth in gas. Between 2011 and 2030, BP predicts that production of shale gas around the world will more than treble. As the graph on the right shows, a lot of the expansion is predicted to come from the United States.
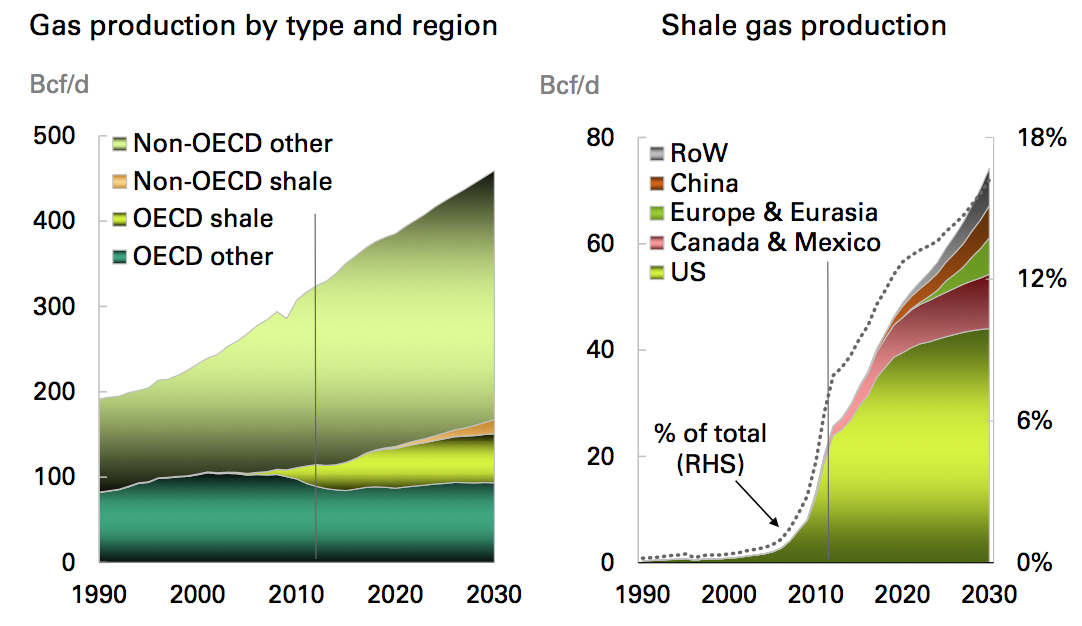
BP says the shale gas boom in North America is down to a variety of factors, including a favourable regulatory system and a particularly innovation-friendly industry structure. Outside the US and Canada, the pace of exploitation is likely to be more “measured”, says BP.
China is expected to be successful in developing shale gas, with shale gas production predicted to account for 20 per cent of its total gas production by 2030. In contrast, BP predicts Europe is unlikely to have a fully-functioning shale gas industry before 2030.
But although the headlines have focused on shale gas, BP says the “bigger story” is the increase in conventional gas production mainly in non-OECD countries, especially the Middle East, Africa and Russia. BP says only 15 per cent of global gas production will be from shale in 2030.
Coal
OECD countries’ coal consumption will continue to decline by about one per cent per year over the next two decades, BP says, in contrast to the rest of the world – which it expects to consume more and more of the black stuff.

Not unsurprisingly, China will continue to top the charts of coal consumption (52 per cent of global consumption), while India (12 per cent) will overtake the US to become the second largest consumer by 2024.
Global coal production is expected to increase about one per cent per year between 2011 and 2030 as increasing consumption in China and India largely cancels out a decrease in the OECD.
Renewables and nuclear
BP predicts non-fossil fuels are set to grow globally – but will still only contribute six per cent of global primary energy by 2030. The growth will be faster in countries outside the OECD, but most of the growth will come from hydro and nuclear power rather than renewables.

The main obstacle to renewables growth is the cost of subsidies, such as Renewable Obligation Certificates in the UK. We think this means BP argues the cost of the subsidies needs to continue to reduce – and fast – to continue to make renewable technologies economically attractive for the governments that pay them.
Energy efficiency and carbon emissions
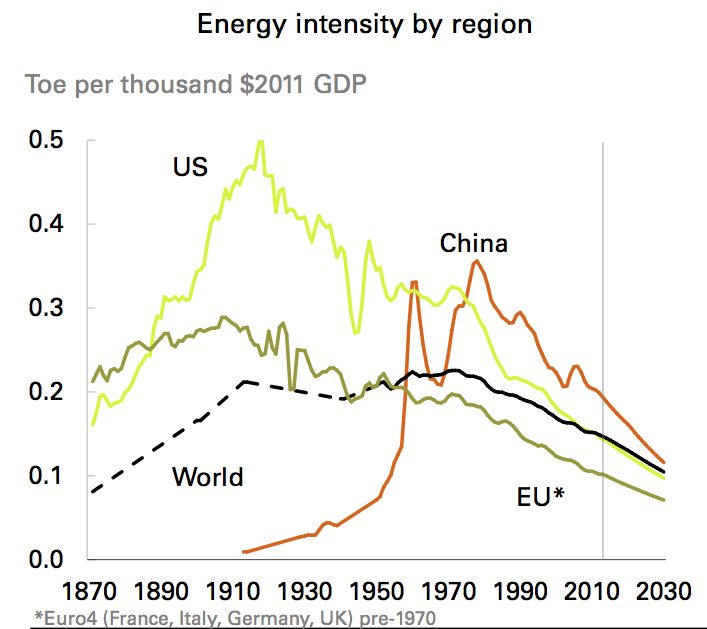
BP says every region in the world is getting more energy efficient. It predicts that the amount of energy used for every dollar in the world will be 31 per cent lower in 2030 than it was in 2011 – as the downward sloping lines on the graph below illustrate. This is largely because it expects China to fuel its development using increasing amounts of renewable energy.
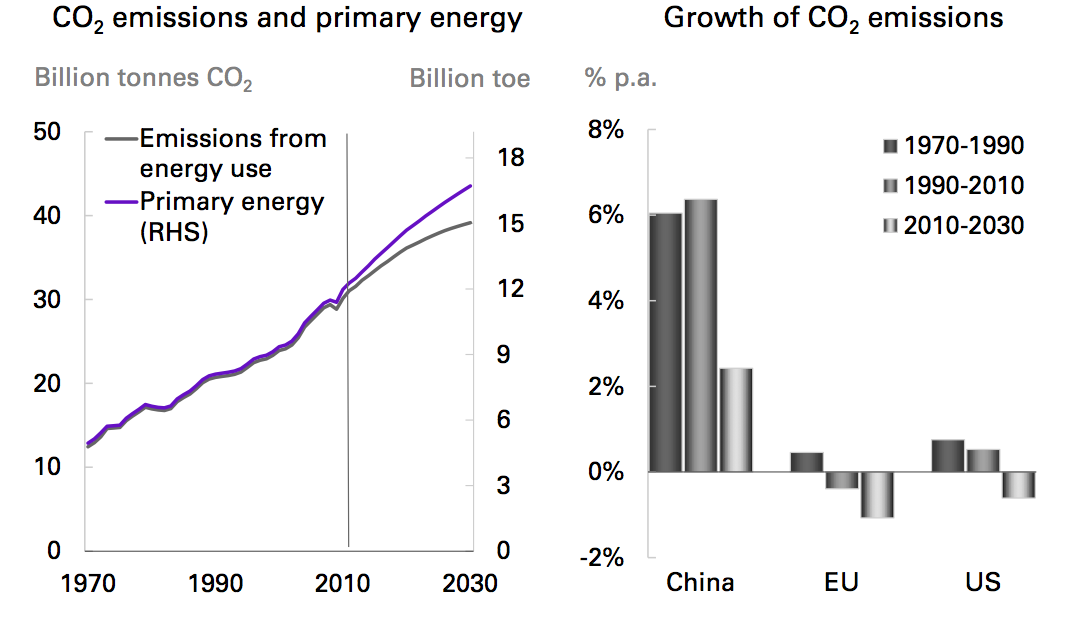
Emissions on the up
The report doesn’t have too much on carbon emissions and climate change. But it forecasts that carbon emissions from energy use globally will grow by just over a quarter (26 per cent) between 2011 and 2030. BP acknowledges that:
“emissions remain well above the required path to stabilise the concentration of greenhouse gases at the level recommended by scientists (450 ppm).”
The Intergovernmental Panel on Climate Change (IPCC) says that this is the threshold of greenhouse gases in the atmosphere beyond which there is a less than 50 per cent chance of staying below two degrees of warming above pre-industrial levels.
BP points out while its scenario is closest to the IEA’s New Policies Scenario, the projected emissions are closer to the results of the IEA’s Current Policies Scenario – which assumes countries policies stay the same as they are now and they don’t hit their emissions targets.
BP’s Chief Economist emphasises the positives of a reduction of US emissions from a switch to shale gas in a video that accompanies the report – but he all but dismissed the idea that the world could avoid warming by two degrees at the report’s launch. In the video he maintains that it is “unlikely” that the world will be able to cap emissions at the level scientists recommend.
Predicting the future
While there are problems with trying to predict so far into the future in a field as uncertain as the global energy market, BP’s predictions are not wildly out of step with other major energy outlooks – as BP helpfully shows in this graph:
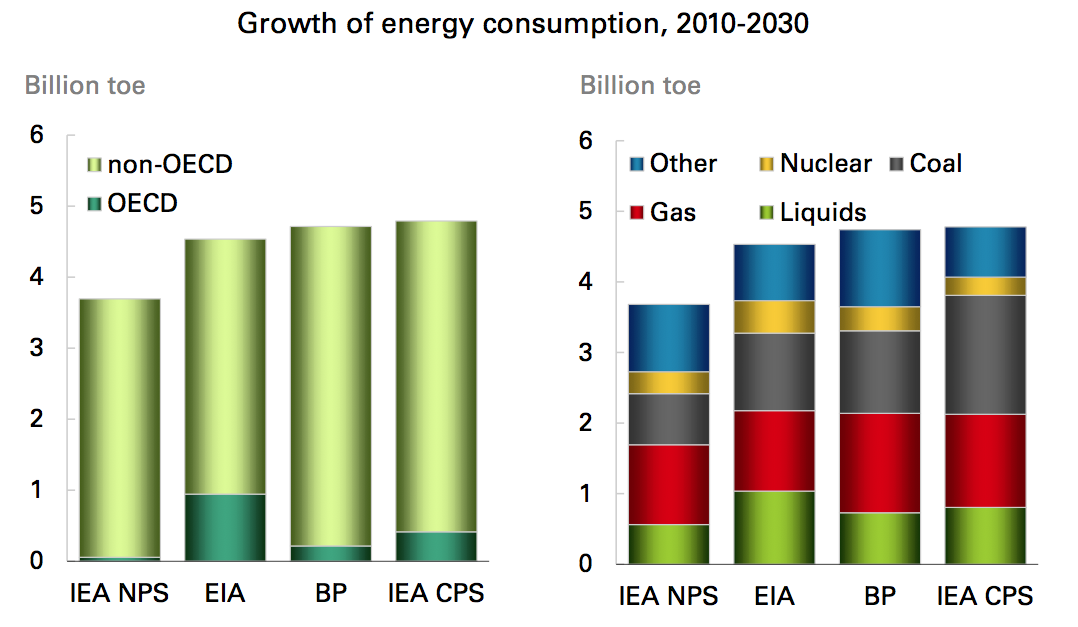
BP’s energy consumption predictions fall somewhere between those of the US Energy Information Agency (EIA) and the Current Policy Scenario from the IEA – and neither the EIA or the IEA have a commercial interest in the energy market. BP’s predictions on the growth of the different fuels is also similar to those from the other agencies – though with a little more nuclear than in the IEA’s forecast and a little more renewables than in the EIA’s forecast.
But BP is – depressingly – less optimistic than the IEA about policies’ ability to deliver emissions cuts. Looking at BP’s predictions, it is easy to see how fossil fuel growth in the next twenty years could lead the world away from the emission reductions it needs to avoid the worst effects of climate change.