Yesterday, the UK government approved a 400-turbine 2.4 gigawatt (GW) offshore windfarm at Dogger Bank in the North Sea. Once built, it would be the world’s largest by far.
But where are the world’s largest offshore windfarms already operating today? And how much electricity do they generate? Carbon Brief has mapped the world’s offshore schemes to find out.
Global offshore wind data
We found 62 offshore wind schemes currently generating electricity around the world, of which 25 are in the UK. Though Denmark was an early pioneer (red bars, below), the UK has installed more megawatts of offshore capacity than any other country in most years since 2004 (blue bars).
This year Germany is expected to knock the UK off top spot (yellow bars), installing the largest offshore capacity for the first time. The chart below only shows capacity already up and running, so the total for 2015 will rise. There’s another important health warning on our figures, see below.
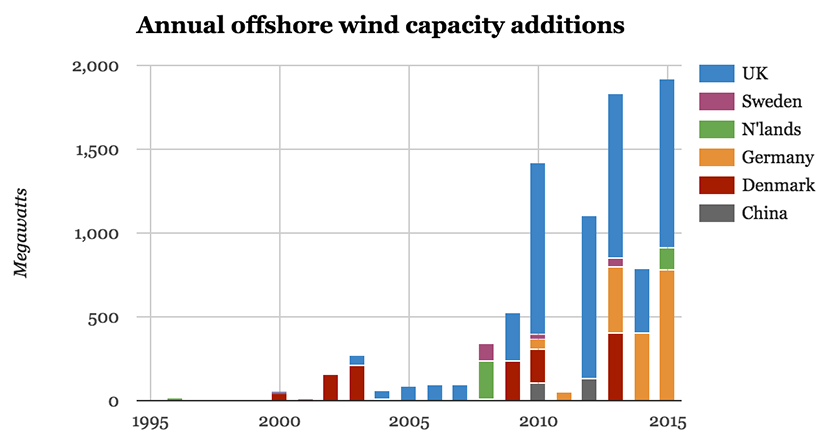
Annual offshore wind capacity additions between 1995 and 2015. Source: Wikipedia. Chart by Carbon Brief. See below for a note on data.
Cumulative capacity
Once you tot up the annual additions it should be obvious that the UK is way out ahead in terms of total offshore wind capacity, with around 5GW currently operating today (blue bars, below). That’s 57% of the current global total of 8.9GW (below right).
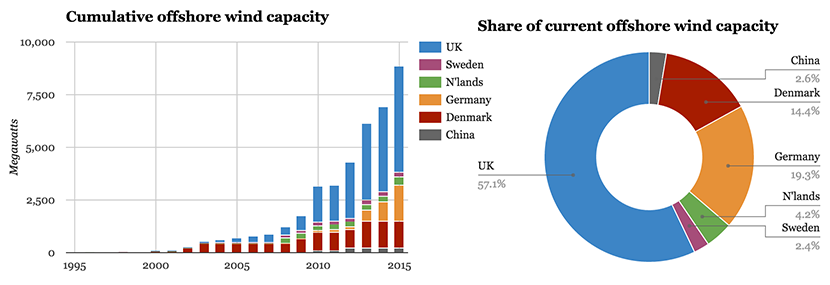
Cumulative offshore wind capacity between 1995 and 2015 (left) and share of the current 8.9GW total (right). Source: Wikipedia. Chart by Carbon Brief. See below for a note on data.
Offshore generation
How much power do offshore windfarms generate? The conversion between capacity in megawatts and generation in megawatt hours depends on the capacity factor. This accounts for the fact that wind turbines don’t always turn, and rarely operate at maximum speed.
Because they tend to be larger and windspeeds at sea more reliable, offshore wind turbines have a higher capacity factor than those onshore. Averages for the UK are 26% onshore and 35% offshore. However, newer schemes tend to be more productive. Government underestimates of this are one reason why renewable energy subsidies may be more expensive than expected.
Using average capacity factors, we can expect the UK’s 5GW of offshore wind capacity to generate upwards of 15 terawatt hours (TWh) of electricity a year, which would be nearly 5% of total UK electricity use. Last year, the UK got 4% of its power from offshore wind.
The wind industry — and the government — tend to report windfarm output in terms of the number of homes they could power. So, for instance, the 2.4GW Dogger Bank Teesside A and B schemes approved yesterday are said to have the potential to power 1.8m UK homes.
This offers a somewhat exaggerated view of the contribution that would be made, as homes only account for about a third of total electricity demand. So, for example, the latest Dogger Bank scheme would be able to power 7% of UK homes, and supply 2.5% of UK electricity needs.
The Dogger Bank Teesside A and B schemes are part of a much larger project at Dogger Bank that could eventually have 1,200 turbines and 7.2GW capacity. It would become the world’s largest offshore wind complex by a long distance, though construction is not expected to begin until 2019.
Largest windfarms
For now, the world’s largest windfarm is the London Array, also in the UK. The 175-turbine scheme in the Thames estuary has a capacity of 630MW, around a quarter of the Teesside A and B scheme that was approved yesterday.
The UK’s projects are larger on average than those elsewhere, and it lays claim to seven of the world’s 10 largest schemes (map, below). These include the London Array, Gwynt y Môr off the coast of north Wales and Greater Gabbard off the Suffolk coast in eastern England. Four of these seven are owned by Danish firm Dong Energy and/or Scottish and Southern Energy.
Have a look at an interactive version of this map on the CartoDB website.
Carbon Brief has plotted 62 offshore windfarms around the world, almost all of which are in Europe. By Rosamund Pearce for Carbon Brief, using CartoDB. Source: Wikipedia. See below for a note on data.
Offshore pipeline
The UK is the king of offshore wind, but will it retain that spot? The short answer is yes — for now. If all of the windfarms currently under construction or holding approval are actually built, then the UK would hold on to its place, with 17.4GW of capacity (green, blue and dark grey bars, below).
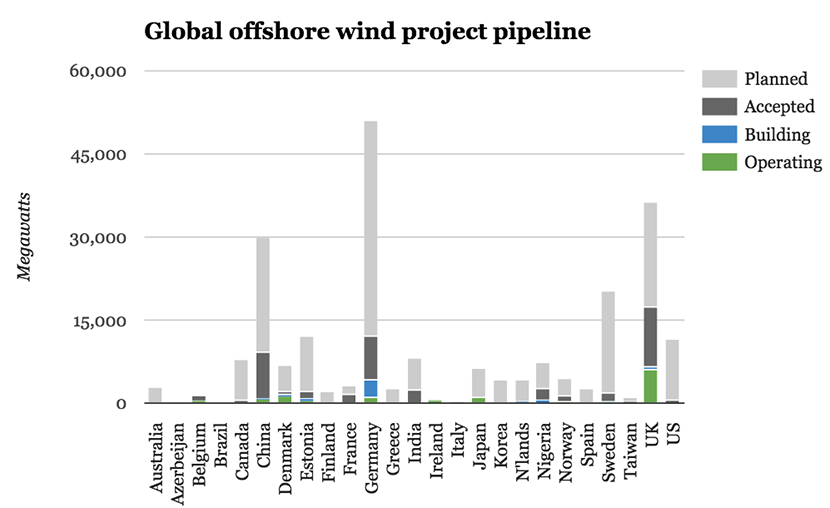
The global offshore wind project pipeline according to The Wind Power database. Chart by Carbon Brief. For a note on data, see below.
Other countries are catching up fast. As already noted, Germany will install more offshore wind this year than the UK. Germany could overtake the UK in terms of total capacity, if its sizeable 39GW of projects at the planning stage were to be taken through to operation (light grey bars).
The total pipeline for offshore wind capacity in the database we used is 228GW. This sounds like a lot — and it is when compared to the 9GW that’s operating today. If all of this got built, it would be capable of generating perhaps 700TWh of electricity
That’s around twice the UK’s current annual usage. For a more sobering perspective, consider that the world used 22,668TWh of electricity in 2012, meaning today’s offshore windfarms generate around 0.1% of current power needs. That impressive-sounding 228GW pipeline would lift the share to 3.1%, as long as electricity demand fails to rise while it’s getting built.
Note on data: Most databases of offshore windfarms are proprietary and data inconsistencies are a widespread problem, even with paid-for services. We have used publicly available information from Wikipedia and The Wind Power.
While Wikipedia’s totals for currently operating offshore capacity are in line with those from the Global Wind Energy Council and Renewable UK, it is almost certain that the data contains errors, particularly around dates when windfarm operations commenced.
For instance, the European Wind Energy Association (EWEA) has reported that 1.5GW of capacity was installed in Europe last year, with Belgium in third place. Our data, which is likely to be less reliable, does not match this total for 2014 and Belgium does not appear at all.
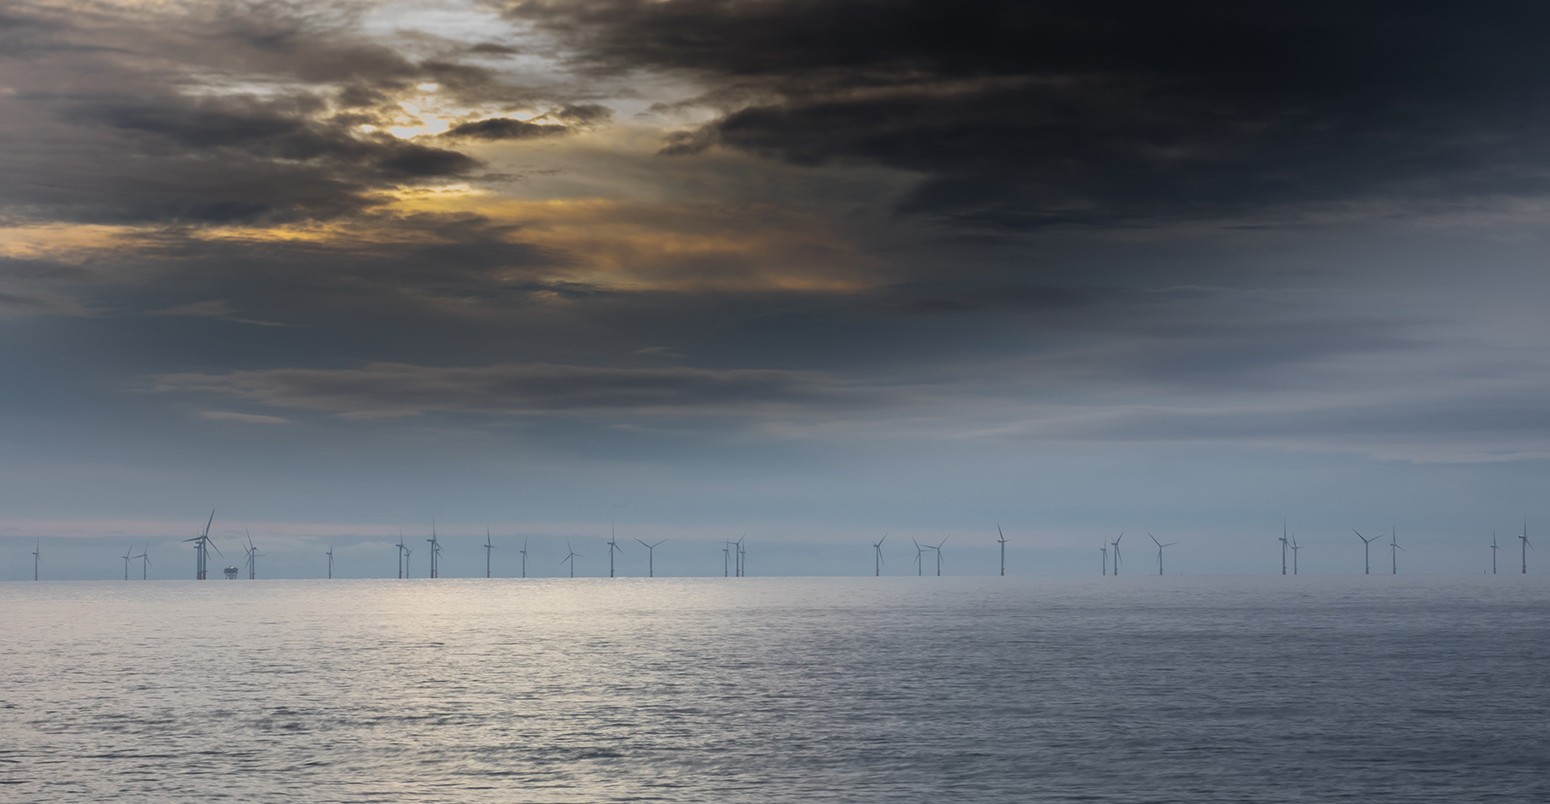
Main image: Offshore wind farm.
For The Wind Power database on the offshore project pipeline, we have used the headline figures available for free. However, this overestimates operational capacity because it counts a project's planned total capacity as in operation now, even when only part of it has been built.