Roz Pidcock
21.07.2014 | 7:30pmScientists know greenhouse gases are causing the world to warm. But an interesting question is why warming at earth’s surface speeds up and slows down.
A new paper shows surface temperature “slowdowns” like we’re experiencing now aren’t unusual – and capturing the timing of natural ups and down in the climate is key to predicting them.
But as a second paper explains, the planet as a whole has warmed up in the last decade even as surface temperature rise has been sluggish.
Model mismatch
Temperatures are rising due to long term greenhouse gas warming. But natural variability causes temperatures to go up and down from one year to the next.
Natural variability can at least partly explain slower surface warming in the last 15 years, the Intergovernmental Panel on Climate Change (IPCC) concluded in its latest report. Recent evidence points to changes in the Pacific causing the deep oceans to absorb more heat.
But most climate models didn’t predict the slowdown. And as a new paper in Nature Climate Change explains, some parts of the media have argued that since models don’t replicate recent temperatures, we shouldn’t trust their predictions for future warming.
But the paper, lead by Australian climate scientist Dr James Risbey, finds that 15 years of temperatures rising slower than models predict “does not constitute evidence against the fidelity” of models in general. Let’s take a closer look at why not.
It’s not unusual
Scientists predict how temperatures will change several decades into the future by combining the results from lots of individual model simulations. And it works pretty well – long term projections from models agree well with what we’ve seen.
But over short time periods, like 10 or 15 years. temperatures are influenced by the ups and downs of natural variability. Right now, surface temperatures are at the lower end of where climate models estimate they should be.
At other times, temperatures have been higher than models predicted. The graph below shows that neither is unusual.
The grey shading is the range of model projections. The blue and red dashed lines are the rate of warming over consecutive 15-year periods for two global temperature datasets (each marker is the midpoint of one 15-year trend.)
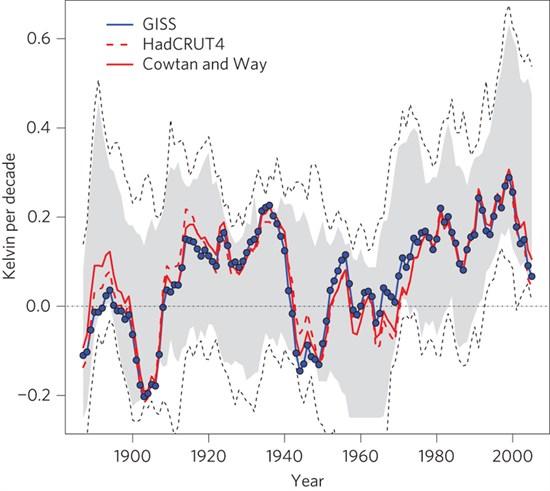
The coloured lines show the rate of global average surface temperature rise calculated for successive 15-year periods, plotted at the central year. Grey shading is the range of IPCC model projections. Source: Risbey et al., ( 2014)
There are several periods when real world temperatures are at the warm end of the models (see 1925, 1935, 1955). But in 1890, 1905, 1945, 1970 and 2005 the trend is towards the colder end. As the paper puts it:
“In other words, the recent ‘hiatus’ centred about 2005 (1998-2012) is not exceptional in context â?¦ One expects the observed trend … to bounce about within the model trend envelope in response to variations in … ocean heat uptake rates, as they do.”
A question of timing
Climate models include all the natural variability scientists know about but they’re not designed to predict exact timing of when we’ll see warming speed up or slow down, say the authors.
Here’s where the paper comes up with an interesting idea.
The authors assume that out of all of the model simulations, some will have got the timing of natural variability ups and downs almost exactly right – by chance. By looking at only these models, they found they could accurately forecast the occurrence and timing of the most recent surface warming slowdown.
Understanding natural variability is crucial to predicting how temperatures will change 10 or 15 years into the future. And these results suggests climate models can do a good job on those timescales – as well as longer ones – provided they capture natural variability well enough.
This won’t come as a surprise to a lot of other scientists working in this area, however. The recent IPCC report did a similar test in its recent report, coming to the same conclusion.
Big picture
It’s tempting to just look at surface temperatures to see how the planet is changing, because it’s where humans live. But little over two per cent of the heat reaching earth stays in the atmosphere. 93 per cent goes into oceans, with the rest shared between land and ice.
A separate paper in the journal Geophysical Research Letters shows that despite the recent period of slower surface warming, the climate system as a whole has continued to warm.
Using the latest satellite measurements of how much energy enters earth’s atmosphere compared to how much leaves, professor Richard Allan from the University of Reading and colleagues show earth absorbed more heat between 2000 to 2012 than 1985 to 1999.
The world as a whole is warming, and will keep warming as long as greenhouse gases keep rising. While models do a good job of anticipating long term warming, this new research looks like a step towards forecasting the ups and downs we can expect along the way.