
Guest post: What can climate models tell us about impacts at 1.5C and 2C?

Standard approach
There are hundreds of scientists and research projects around the world working to investigate the potential consequences of climate change. The studies often rely on climate model experiments. Here, we are talking about simulations with complex global climate models, which are used to explore future change in regional climate; often as a basis for assessing impacts on health, agriculture, ecosystems, infrastructure, water resources, and beyond. More than twenty modelling centres around the world, such as the UK Met Office, run their models on supercomputers to test the climate’s response to human-caused greenhouse gases. Rather than base our conclusions on just one model, scientists try to consider as many as possible. The data from such experiments are available online, courtesy of the Coupled Model Intercomparison Project. Usually, climate modelling centres run their experiments with the same set of scenarios for how greenhouse gases could evolve over the course of the century. But as the figure below shows, the models generate quite different levels of global warming by the end of the 21st century for the same greenhouse gas forcing, ranging from 2C to more than 4C. This makes it difficult to estimate impacts at any one temperature level.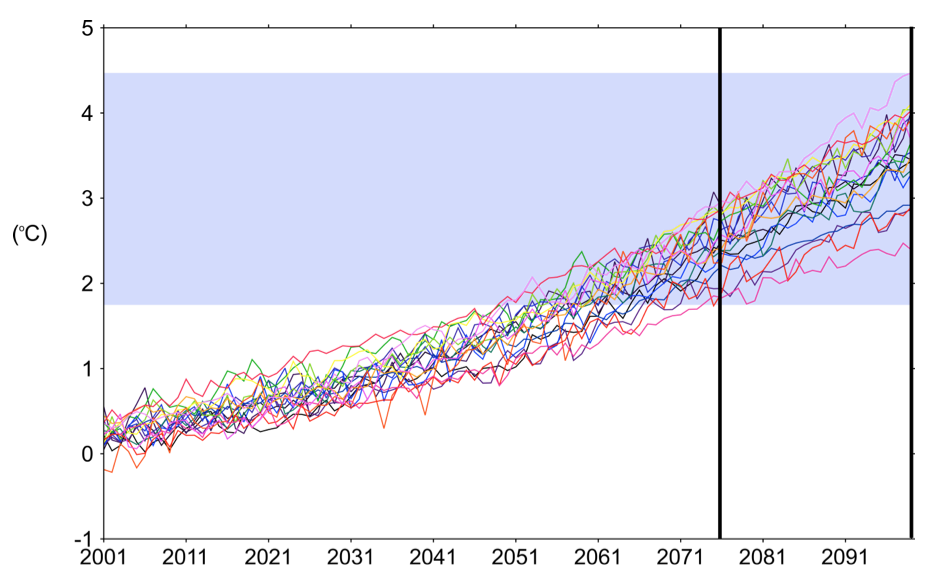
Focusing on 1.5C and 2C
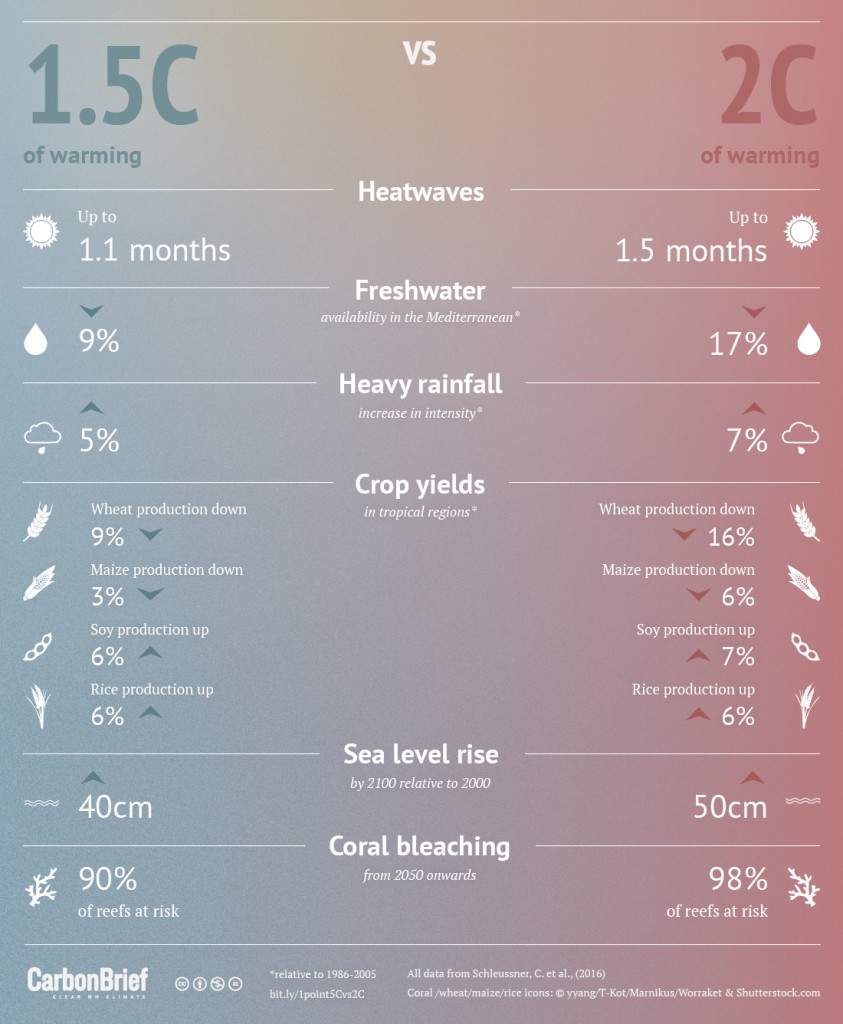
Scientists have used a number of methods to extract climate signals at specific warming levels from existing experiments. Whilst there are very few model runs which hold warming to below 1.5C or 2C, many of them cross those thresholds at some point in time. This allows scientists to compare the “transient” climate response at the point at which we pass 1.5C and 2C. Studies so far that have used this approach to compare impacts at 1.5C and 2C of warming suggest that half a degree could make a very big difference. But there is significantly more we could do on this front. Most of the work so far to analyse the “transient” impact of different levels of warming do so for 2C and/or 4C, but not 1.5C. In other words, we could quite quickly generate much more information about the initial response to 1.5C or 2C, just by analysing the data we already have. One issue with this “transient” approach, however, is the limited number of years of data available at 1.5C and 2C. This makes it difficult to explore differences in extreme events, which are, by definition, rare. New model experiments are currently being run to generate large ensembles at 1.5C and 2C to try to address this problem. These experiments are part of a project called HAPPI (Half a degree Additional warming, Prognosis and Projected Impacts), which aims to better understand extreme weather in a changing climate. Importantly, it looks like this new data source will be in time for studies to be included in the IPCC’s Special Report. It gets more complicated, however, when we try to take into account the uncertainties associated with trying to stabilise or hold temperatures at 1.5C or 2C over long timescales. The long term implications of 1.5C or 2C might vary, depending on the path taken to get there. As shown in the figure below, we could reach 2C or 1.5C very quickly (purple), or take much longer (red, yellow). Global temperature might also temporarily overshoot 1.5C or 2C before stabilising (blue).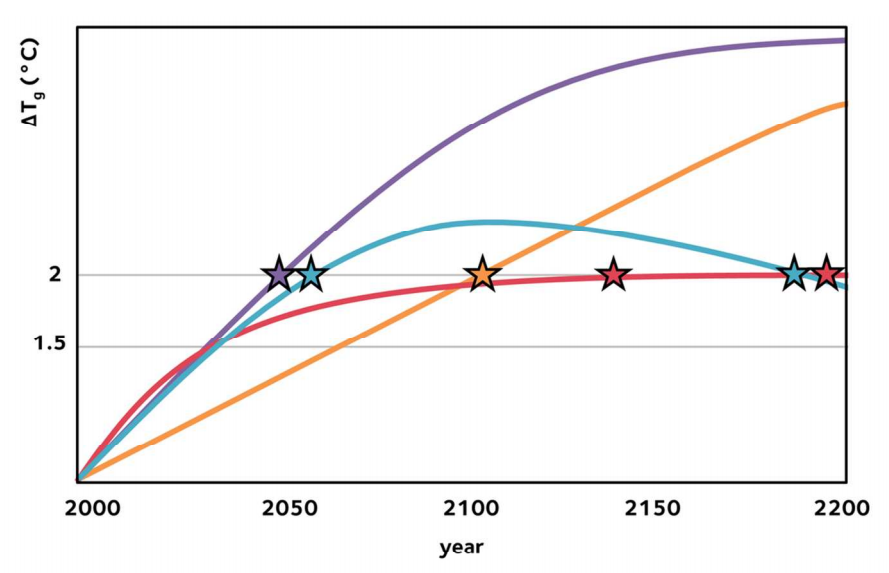
Looking forward
There are clearly a lot of uncertainties associated with modelling climate signals at 1.5C and 2C, and scientists are working with imperfect data sources, with a rapidly approaching deadline. The challenge is great, but our paper suggests a number of promising directions which might provide information in time for the IPCC Special Report.Article information
With thanks to Dr Joeri Rogelj, Dr Carl-Friedrich Schleussner, Prof. Declan Conway, Prof. Richard Washington.