Analysis: UK’s CO2 emissions have fallen 29% over the past decade
Simon Evans
03.03.20Simon Evans
03.03.2020 | 12:07amThe UK’s CO2 emissions fell by 2.9% in 2019, according to Carbon Brief analysis. This brings the total reduction to 29% over the past decade since 2010, even as the economy grew by a fifth.
Another 29% reduction in coal use last year was the driving force behind the decline in UK emissions in 2019, with oil and gas use largely unchanged. Carbon emissions from coal have fallen by 80% over the past decade, while those from gas are down 20% and oil by just 6%.
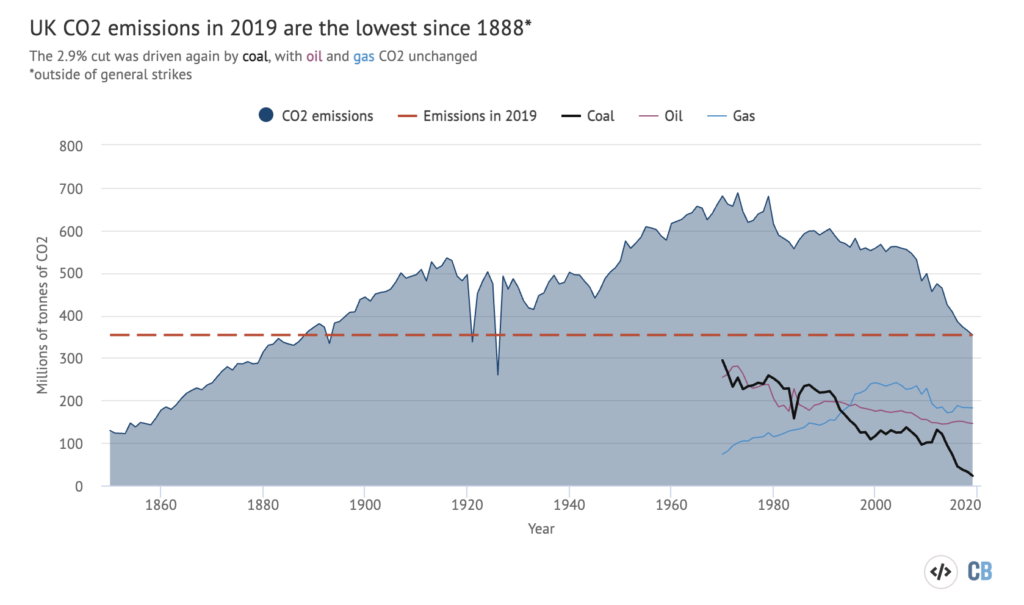
The 2.9% fall in 2019 marks a seventh consecutive year of carbon cuts for the UK, the longest series on record. It also means UK carbon emissions in 2019 fell to levels last seen in 1888.
The analysis comes as the UK – and the world – enter what needs to be a “decade of action” in the 2020s, if global goals to limit rising temperatures are to be met. Ahead of the COP26 UN climate summit this November, countries are expected to submit enhanced pledges to tackle emissions.
But UK government projections show the country will miss its legally binding carbon targets later this decade. To meet the UK’s carbon budgets, CO2 emissions would need to fall by another 31% by 2030, whereas government projections expect just a 10% cut, based on current policies.
The Committee on Climate Change (CCC), which is the UK government’s official climate advisory body, has also said the UK’s targets over the next decade are “likely” to be insufficient, given the increased goal of reaching net-zero emissions by 2050.
Update 26 March 2020: UK government figures published today confirm Carbon Brief’s earlier analysis, showing that the country’s greenhouse gas emissions in 2019 were 45% below 1990 levels. The figures suggest CO2 emissions fell by 3.9% in 2019, slightly more than the 2.9% Carbon Brief estimate.
Annual decline
Carbon Brief’s provisional estimates suggest that the UK’s CO2 emissions fell by another 2.9% in 2019, once again driven primarily by falling coal use, as shown in the table, below.
Annual change in UK CO2 emissions in 2019 and over the past decade| Change in CO2 | Coal | Oil | Gas | Total |
|---|---|---|---|---|
| In 2019 | -27.9% | -0.9% | -0.1% | -2.9% |
| Past decade | -79.8% | -6.0% | -20.0% | -29.0% |
The bulk of the reduction in coal use last year came from the power sector, which accounted for 93% of the overall fall in demand for the fuel in 2019. The remainder was from industry.
Coal generation fell by close to 60% and accounted for just 2% of UK electricity last year – less than solar. Fossil fuels collectively accounted for a record-low 43% of the total, according to Carbon Brief analysis published at the start of January. Some 54% of electricity generation in the UK is now from low-carbon sources, including 37% from renewables and 20% from wind alone.
There were 83 days in 2019 when the UK went without coal power, including a record 18-day stretch in May. Almost all of the UK’s remaining coal power plants have announced plans to close over the next 12 months, leaving just three operating ahead of the 2024 government deadline.
Carbon Brief’s emissions analysis shows that CO2 from burning gas remained virtually unchanged during 2019. The fuel is now the single-largest contributor to UK emissions, ahead of oil.
Gas demand for electricity generation, as well as demand to heat homes and businesses, were relatively flat, with 2019 seeing similar temperatures to those in 2018. (Both years were around 0.5C above the long-term average for 1981-2010.)
Oil demand and emissions fell by nearly 1% in 2019, Carbon Brief’s analysis suggests. This is despite rising road traffic, up 0.8% in the year to September 2019, according to separate government figures published in December.
The UK’s vehicle fleet is changing under several competing influences, with electric vehicle sales surging and diesel cars losing out to petrol in the wake of the Volkswagen emissions scandal.
THREAD
— Simon Evans (@DrSimEvans) September 5, 2019
Battery electric vehicles have just recorded an absolutely stunning increase in their share of the UK market, which has tripled in two months to 3.4%, after 3+ yrs below 1%
HT @colinmckerrache for flagging and @SMMT for data pic.twitter.com/OZkXGqL5Qf
Meanwhile, a broader global trend towards heavier vehicles, such as SUVs, means that the average CO2 emissions per mile for new UK cars has been increasing for three years. Notably, the relative mix of traffic from private cars, vans and trucks is also shifting, as discussed below.
Past decade
Carbon Brief’s analysis shows that the UK’s CO2 emissions have fallen by 29% over the past decade since 2010, the year when the Conservative/Liberal Democrat coalition government took office. At the same time, the UK’s economic output has risen by 18%, as the chart below shows.
Although no other country in the world has achieved similar reductions, it is worth emphasising that the UK was the first to industrialise. As such, its cumulative historical emissions still rank as the fourth-highest in the world.
Reasons for change
If the UK’s energy system had remained unchanged over the past decade, then the country’s rising population and economic growth would have driven emissions higher, rather than lower.
This is shown in the chart, below, which breaks down the reasons for the dramatic reduction in emissions that has actually occurred.
The largest contributor to falling emissions over the past decade has been improvements in energy intensity, which is the amount of energy needed to produce each unit of GDP. Broadly speaking, this reflects the fact that the UK has become much more energy efficient.
The second-largest contributor has been a shift to cleaner fuels, primarily renewable sources of electricity. Together, these effects have more than offset the impact of rising population and GDP.
Contributions to the change in UK CO2 emissions between 2010 (leftmost column) and 2019 (right) in millions of tonnes of CO2. “Cleaner fuels” is shorthand for the carbon intensity of energy and “energy efficiency” is shorthand for the energy intensity of GDP. “Interaction effects” result from changes in one factor, such as energy intensity, influencing the impact of changes in other factors. Source: Carbon Brief analysis of data on energy and emissions from BEIS, population data from the World Bank and UK real GDP estimates from the World Bank. Chart by Carbon Brief using Highcharts.The various factors in the chart above are estimated from a “Kaya identity”, according to which emissions are the product of population, multiplied by GDP per capita, multiplied by the energy intensity of GDP, multiplied by the CO2 intensity of energy.
CO2 = P x GDP/capita x energy/GDP x CO2/energy
To calculate the relative contributions to changing emissions, each factor is systematically varied while holding other elements constant. For example, the Kaya identity can be used to estimate what UK CO2 emissions would have been in 2019, if population had remained at 2010 levels.
As noted in the caption to the figure, above, the chart labels are a shorthand. Specifically, changes in the energy intensity of GDP, labelled as “energy efficiency”, are a reflection of genuine demand reductions – due to more efficient products and processes – but they also reflect the increasing share of energy coming from renewable sources.
This is because a large part of the “primary energy” contained in raw fossil fuels – a lump of coal, for example – is lost as waste heat when the fuel is burned to produce useful energy. The same is not true of electricity from windfarms or solar panels, which, therefore, has a lower energy intensity.
Carbon Brief calculations
Carbon Brief’s estimates of the UK’s CO2 emissions in 2019 are based on analysis of provisional energy use figures published by BEIS on 28 February 2020. The same approach has accurately estimated year-to-year changes in emissions in previous years (see table, below).
Estimated year-on-year change in UK CO2 emissions versus reported results| Reported | Carbon Brief | Difference | |
|---|---|---|---|
| 2010 | 3.6% | 4.0% | 0.4% |
| 2011 | -8.6% | -8.1% | 0.5 |
| 2012 | 4.1% | 4.3% | 03.% |
| 2013 | -2.2% | -3.9% | -1.7% |
| 2014 | -8.4% | -8.6% | -0.2% |
| 2015 | -3.9% | -3.4% | 0.5% |
| 2016 | -5.5% | -6.3% | -0.7% |
| 2017 | -3.3% | -2.4% | 0.8% |
| 2018 | -2.4% | -2.0% | 0.4% |
| 2019 | -2.9% |
One large source of uncertainty is the provisional energy use data, which BEIS revises at the end of March each year and often again later on. Emissions data is also subject to revision in light of improvements in data collection and the methodology used.
The table above applies Carbon Brief’s emissions calculations to the latest energy use and emissions figures, which may differ from those published previously.
Another source of uncertainty is the fact that Carbon Brief’s approach to estimating the annual change in CO2 output differs from the methodology used for the BEIS provisional estimates. This is largely because BEIS has access to more granular data, which is not available for public use.
However, Carbon Brief understands that its methodology has over the past year been used to improve the early “pre-provisional” estimates produced by the department for internal use, prior to the release of full provisional figures at the end of March each year.
In Carbon Brief’s approach, UK CO2 emissions are estimated by multiplying the reported consumption of each fossil fuel, in energy terms, by its emissions factor. This is the amount of CO2 released for each unit of energy consumed and it varies for different fuels.
For example, diesel, petrol and jet fuel have different emissions factors and Carbon Brief’s analysis accounts for this where possible. This adjustment is based on the quantity of each fuel type used per year, drawn from separate BEIS figures covering oil, coal and gas.
Emissions from land use and forestry are assumed to remain at the same level as in 2018. This year, Carbon Brief adopted the BEIS approach to estimating the change in emissions from greenhouse gases other than CO2.
Note that the figures in this article are for emissions within the UK measured according to international guidelines. This means they exclude emissions associated with imported goods, including imported biomass, as well as the UK’s share of international aviation and shipping.
The Office for National Statistics (ONS) has published detailed comparisons between various different approaches to calculating UK emissions, on a territorial, consumption, environmental accounts or international accounting basis.
The UK’s consumption-based CO2 emissions increased between 1990 and 2007. Since then, however, they have fallen by a similar number of tonnes as emissions within the UK. Carbon Brief estimates that consumption-based CO2 emissions fell by around 21% over the past decade.
Bioenergy is a significant source of renewable energy in the UK and its climate benefits are disputed. Contrary to public perception, however, only around one quarter of bioenergy is imported.
International aviation is considered part of the UK’s carbon budgets and faces the prospect of tighter limits on its CO2 emissions. The international shipping sector recently agreed to at least halve its emissions by 2050, relative to 2008 levels.