Explainer: California’s new ‘cap-and-trade’ scheme to cut emissions
Zeke Hausfather
07.28.17Zeke Hausfather
28.07.2017 | 1:35pmLast month, California’s politicians agreed a new cap-and-trade bill to help curb the state’s emissions. This week, governor Jerry Brown signed it into law, representing a major step forward in the state’s effort to combat climate change.
“Cap and trade” requires large emitters such as power plants, refineries and factories to buy permits for the greenhouse gases they release. Distributors of natural gas, gasoline, liquid petroleum gas, and diesel fuels must cover emissions from fuels they sell. The scheme limits the total number of permits available so that overall emissions stay within the cap.
California, one the US’s largest emitting states, has committed to reduce its emissions to 1990 levels by 2020, to 40% below 1990 levels by 2030 and to 80% below 1990 levels by 2050.
While it is on track to meet its 2020 goals, California’s reductions will have to ramp up dramatically to meet its 2030 and 2050 targets. The new cap-and-trade system is expected to play a major role in meeting these ambitious targets.
Here, Carbon Brief explains how the scheme will work.
‘Supermajority’
The existing California cap-and-trade system was passed into law in 2006, began operating in 2012 and expires in 2020 and had become mired by lawsuits. Specifically, California law requires that tax measures pass the legislature with a so-called “supermajority”, with over 66% of legislators voting for the bill.
Opponents, led by the California Chamber of Commerce, argued that the cap-and-trade system effectively constituted a tax, as it raised revenue through the sale of emission allowances.
To avoid further legal challenges in this vein, eight Republicans joined with Democrats to provide a supermajority in both the State Assembly and Senate to extend the cap-and-trade system through to the end of 2030.
California had previously passed a law mandating that emissions be reduced to 40% below 1990 levels. This target serves as the basis for the emissions cap in the extended cap-and-trade system.
The bill was supported by a broad coalition of groups, including the Environmental Defense Fund and the Natural Resources Defense Council, as well as the California Chamber of Commerce which, surprisingly, had been one of the groups behind the lawsuit over the current cap-and-trade system.
It was opposed by some environmental groups who felt that it did not go far enough and who supported a previous, more ambitious version of the bill.
Ratcheting up ambition
Reducing emissions by 40% relative to 1990 levels by 2030 represents a dramatic ratcheting up of ambition compared to California’s current target. The figure below shows California’s emissions in each year since 1990, as well as the 2020, 2030 and 2050 targets.
California CO2 emissions between 1990 and 2015 along with 2020, 2030, and 2050 targets. Data from the California Greenhouse Gas Emission Inventory. Excludes emissions from transport that occur out-of-state. Chart by Carbon Brief using Highcharts.While the state is on track to reduce emissions to meet its 2020 target, the rate of emission reductions will have to significantly increase to meet the 2030 target. This will require large changes, both to electricity generation and emissions from vehicles, as well as emissions from industrial, commercial and residential sectors.
California has put in place a rule requiring 50% of its electricity be generated from renewable sources – excluding large hydro – by 2030. It has also established a zero-emissions vehicle programme. This will encourage the sale of 1.5 million electric and other zero-emission vehicles by 2025.
The cap-and-trade system coexists with these other regulations, and covers approximately 85% of California’s greenhouse gas emissions, though it currently excludes aviation fuel.
Historically, regulations rather than carbon caps have been the main driver of carbon reductions. These regulations have been so effective they have not left much for the cap and trade system to do. This has resulted in little demand for tradable permits in the current market, with permit prices plummeting as a result. In 2016, a sizable portion of the permits offered on the market were never actually sold.
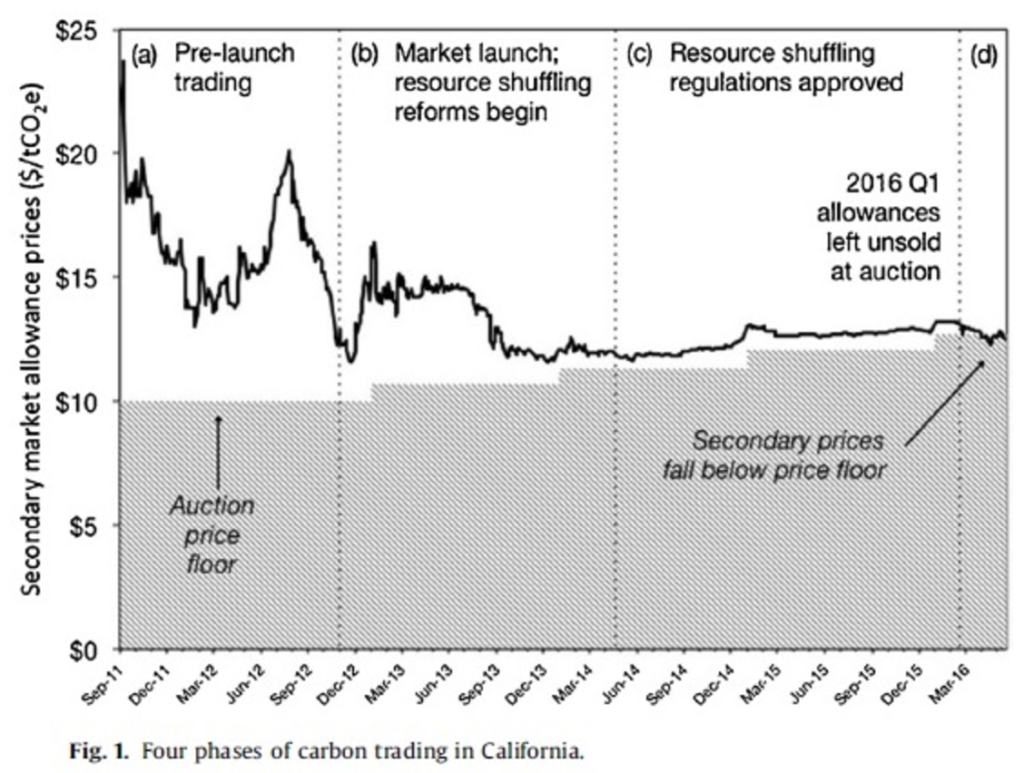
California tradable permit prices between September 2011 and June 2016, along with a shaded area showing the permit price floor. Figure from Cullenward and Coghlan 2016.
The much more ambitious 2030 targets means that this is expected to change, as regulations alone are less likely to lead to the deep reductions needed. The California Air Resources Board, which is tasked with implementing the state’s emission reduction targets, expects the new cap-and-trade system to contribute at least 25% of total emission reductions by 2030, with other regulations making up the remainder.
The new law maintains a price “floor” below which carbon permits are not sold, but also sets a stricter ceiling on prices. This means that if the price of permits spikes up and hits the price ceiling, the state will sell an unlimited amount of emission permits at the ceiling price.
The price floor and relatively low ceiling price mean that the cap and trade system should avoid some of the shortcomings of the European Union Emissions Trading Scheme (EU ETS), where high volatility and price collapses to near-zero created serious problems over its lifetime.
While this has the downside of weakening the “cap” part of cap and trade, it provides a balance between the potentially high cost of emission reduction and the need to meet particular targets.
If emission reductions are relatively inexpensive, the price ceiling may never be reached. If they end up being costly, the system acts more like a carbon tax than a cap.
The new law allows for some use of carbon offsets, but puts stricter limits on them than in the current system. Only 4% of emissions could be covered by offsets between 2021 to 2025 and 6% between 2025 and 2030.
The new law requires that half of the offsets purchased come from projects located within the state of California. For example, farms installing methane digesters to capture emissions from animal manure and convert it to energy, could produce offsets to sell into the market.
Revenue raiser
California’s cap-and-trade system will generate a considerable amount of revenue from selling permits. While some permits will go to businesses based on their historic emissions, most will be auctioned off by the government.
How this revenue will be spent is likely to be the subject of future political battles in the state. Governor Brown has suggested that revenue from the cap-and-trade system should be used, in part, to build a bullet train between San Francisco and Los Angeles.
However, as part of the political compromise involved in the bill’s passage, a constitutional amendment was put on the ballot next year to give legislators more say over how cap-and-trade revenue is spent. If the amendment passes, a supermajority vote of the legislature will be required to allocate cap-and-trade revenue after 2024.
The new bill is not as ambitious as some environmental groups would have preferred. However, Dan Kammen, a professor of energy at UC Berkeley and a US State Department science envoy, tells Carbon Brief:
“While the bill was never perfect… overall, I think it was a necessary step to keep the California process on track and not open us up to a huge debate at a time when federal insecurity [as a result of the Trump administration] could devastate what is working fairly well here. It is, ultimately, what we do with the funds that will matter most”.
California’s emissions
California’s greenhouse gas emissions come from a wide variety of sources, including electricity generation (both in-state and imported from neighboring states, which also count toward California’s emissions target), transportation, industrial activity, commercial and residential building energy use, and agriculture and forestry. California’s emissions since 1990 are shown in the figure below.
California CO2 emissions between 1990 and 2015 by economic sector. Data from the California Greenhouse Gas Emission Inventory. Chart by Carbon Brief using Highcharts.Most of these sectors are covered by the cap-and-trade system. Some, such as power generation or most industrial activity, are directly covered by the cap. Others, such as transportation or building energy use, are indirectly affected by the inclusion of fuel providers in the cap-and-trade system, which has the effect of passing through permit costs in the price of fossil fuels.
The cap-and-trade system does not directly cover most agricultural and forestry sources of emissions, and completely excludes transportation emissions that occur out of state – for example, international and domestic flights originating in California. These are subject to other regulations at the state level, though the ability of states to regulate emissions from aviation is somewhat unclear.
California’s revised cap-and-trade system will be watched closely by other states and countries looking to establish or expand their own emission-trading systems. Should it succeed, it could provide a much-needed success story for emission trading after the challenges experienced by systems in Europe and elsewhere over the past two decades.