
Focus on regional climate impacts to hasten emission cuts, scientists say
Robert McSweeney
01.20.16Robert McSweeney
20.01.2016 | 6:00pmUsing global average temperatures to convey the impacts of climate change may not be getting across the urgency of reducing CO2 emissions, a new study says.
Even if we succeed in holding global temperature rise to 2C or 1.5C above pre-industrial levels, both average and extreme temperatures in some regions could still climb way beyond these limits, the researchers say. For example, a 2C warmer world could see annual hottest daytime temperatures in the Mediterranean increase by over 3C.
The new study illustrates how regional changes in temperature and rainfall extremes are linked to cumulative global CO2 emissions – emphasising the need for ambitious climate targets, the lead author tells Carbon Brief.
Global vs regional, average vs extreme
One of the key negotiating points at the Paris climate summit in December was agreeing a long-term goal for limiting global average temperature rise. The final text of the adopted agreement settled on holding temperatures to “well below 2C” above pre-industrial levels and to “pursue efforts” towards a more ambitious target of 1.5C.
But while this was a crucial argument for many, a temperature rise of a couple of degrees may seem relatively mild to people outside of climate science, say the authors of the new Nature paper. By considering climate change as a global average, we often underestimate what the impacts will mean for specific regions and short-term extremes, they say.
A global figure smoothes out the highs and lows of how quickly different parts of the world warm up, the paper says, while changes in average conditions don’t necessarily tell you how extremes in weather are changing.
For example, the oceans warm up more slowly than land areas, says lead author Prof Sonia Seneviratne from the Institute for Atmospheric and Climate Science at ETH Zürich. This has a huge bearing on global average temperature, she explains to Carbon Brief:
The global mean temperature response is dominated by the response of the ocean surfaces because they cover two-thirds of the surface the Earth. But the temperature that is most relevant for human health and agricultural production is the land surface temperature, which warms much more quickly.
You can see this in the figure below, which maps projected changes in annual average temperature in a 2C warmer world. While the ocean surface typically warms up by less than 2C, land temperatures are consistently more than 2C – and beyond 5C in the Arctic.
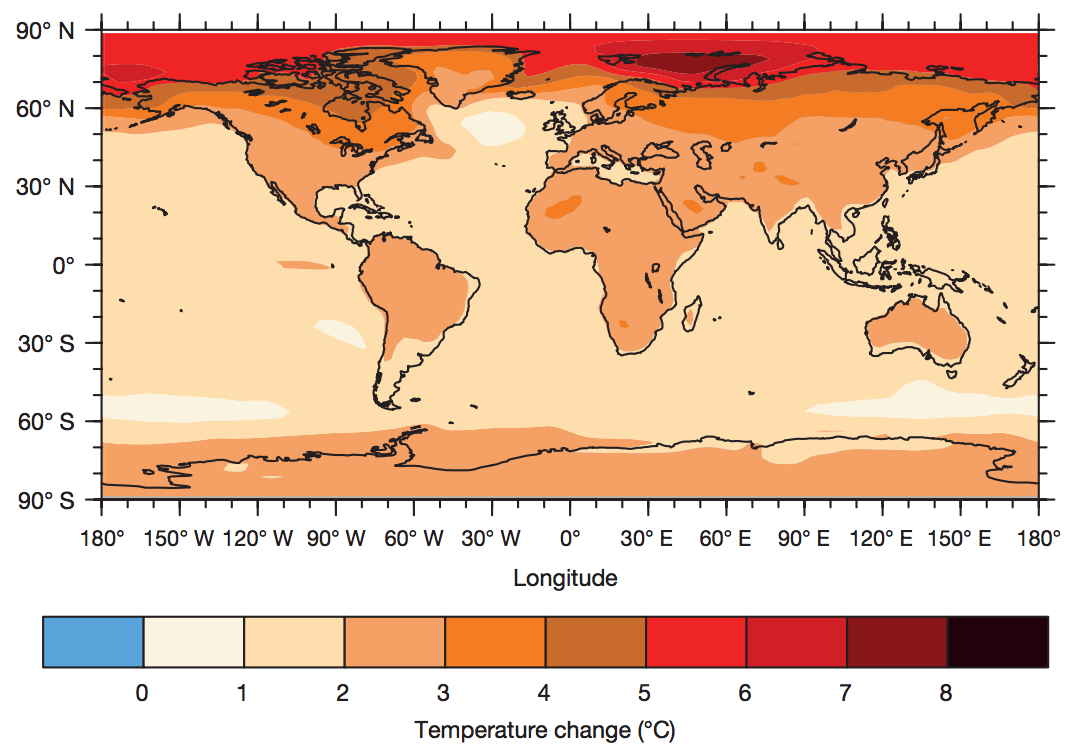
Projected change in annual average temperature in an overall 2C warmer world. Under a high emissions scenario (RCP8.5), the analysis suggests we would reach this point in the year 2044. Source: Seneviratne et al. (2016).
The new paper attempts to address this by illustrating how regional conditions relate to global average temperatures – and the amount of carbon we emit into the atmosphere.
Hottest and coldest temperatures
Using existing output data from global climate models, the researchers plotted projections of changes in global average temperature and rainfall against regional changes in daily extremes.
So, for example, the charts below show the change in annual hottest daytime temperature for the Mediterranean (top-left chart), mainland US (top right), and central Brazil (bottom left), and the change in coldest night-time temperature for the Arctic (bottom right).
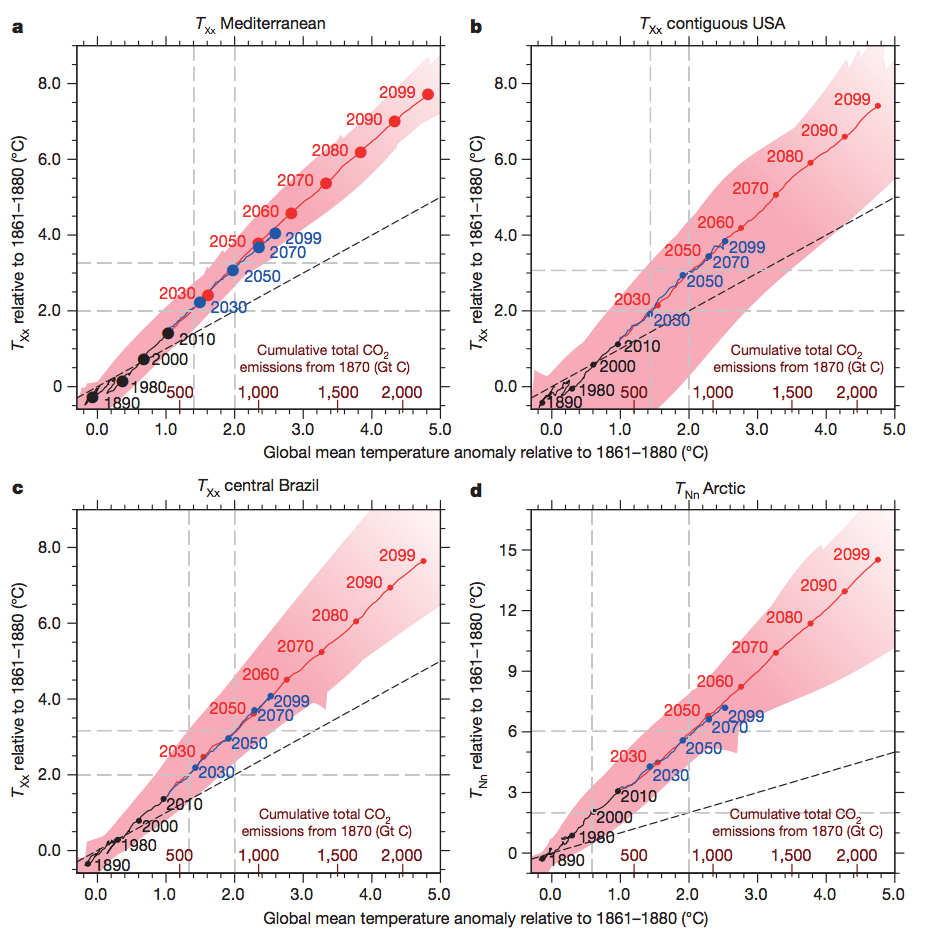
Projected regional changes in annual temperature extremes as global average temperatures rise through the 21st century, for annual maximum daytime temperature (TXx) in a) the Mediterranean, b) US and c) central Brazil, and for the annual minimum night-time temperature (TNn) in the Arctic. Coloured lines indicate emissions scenarios – high (red, RCP8.5) and moderate (blue, RCP4.5) and historical data (black). The red shaded area indicates the total range (minimum to maximum value) of all model simulations. The black dotted line shows equal rate of increase between global and regional temperatures. Source: Seneviratne et al. (2016).
The charts take a little bit of explaining. They show the projected local temperature change (on the y-axis) for every degree of global average temperature rise (x-axis). The coloured lines show the temperature rise under two emissions scenarios – moderate (blue line) and high (red) – and the circles indicate in which decade those temperatures would be reached. Note that the bottom right-hand chart is showing a different metric from the other three (night-time coldest temperature rather than daytime hottest) and has a different scale on the y-axis.
The important line to note is the dashed black line, which indicates how local temperatures would change if they rose at the same rate as the global average.
The results suggest that all four regions could experience increases in daily extremes that exceed the worldwide average. For example, a 2C warmer world would see the annual hottest daytime temperature in the US increase by around 3C, and the annual coldest night-time temperature in the Arctic rise by close to 6C.
Equivalent results for heavy rainfall events in Southern Asia and tropical Africa suggest these would increase in line with global average temperature rise.
Cumulative carbon
The new charts also link regional changes in climate directly to the total amount of carbon in the atmosphere. You can see how temperatures respond to higher cumulative carbon emissions – shown by the dark red numbers on the x-axes on the charts.
So, for example, the results suggest that annual hottest daytime temperatures in the Mediterranean would be 2C higher in a world that was, on average, 1.4C warmer. Keeping global average temperatures to 1.4C would mean cumulative global emissions couldn’t exceed around 600bn tonnes of carbon (~2,200bn tonnes of CO2) since pre-industrial times, rather than 850bn tonnes (~3,100bn tonnes of CO2) for 2C, the paper says.
As of the end of 2014, we have emitted around 545bn tonnes of carbon (~2,000bn tonnes of CO2).
Seeing the regional impacts of rising temperatures highlights how important it is to have agreed the “well-below 2C” target, says Seneviratne:
This is very important in the coming year, as the climate agreement needs to be officially ratified by individual countries. In this context, these results are helpful to better communicate the implications of CO2 forcing for regional impacts, and to provide continued support in the effort to reduce CO2 emissions.
Prof Mat Collins, Joint Met Office Chair in Climate Change at the University of Exeter, who wasn’t involved in the study, says we need to see more studies like this. He tells Carbon Brief:
Aside from all the political and economic difficulties of actually maintaining global mean temperatures below 2C, or even 1.5C, above pre-industrial, it is now imperative to understand what the regional impacts of those targets mean.
However, that’s not to say these charts are the best way to do this, cautions Prof Piers Forster, a professor of physical climate change at the University of Leeds who also wasn’t involved in the study. He tells Carbon Brief:
This paper is really about how to communicate the sense of urgency to policymakers, and to this end I found it disappointing that they did not ask policymakers themselves if they preferred the new approach.
What might seem like a relatively straightforward graph to a climate scientist can be easily misinterpreted by a layperson, says Forster. And while the focus on regional impacts is to be welcomed, he says, it’s important that figures and graphs are understood by those will use them.
Main image: 06 Jul 2015, Madrid, Spain. A woman uses a fan to keep cool as a heatwave continues in Madrid. © Jorge Sanz/Demotix/Corbis.
Seneviratne, S. I. et al. (2016) Allowable CO2 emissions based on regional and impact-related climate targets, Nature, doi:10.1038/nature16542.
-
Focus on regional climate impacts to hasten emission cuts, scientists say
-
Using global average temperatures to convey the impacts of climate change may not be getting across the urgency of reducing CO2 emissions, a new study says