Guest post: How land use drives CO2 emissions around the world
Multiple Authors
04.25.23Around 10,000 years ago, the Neolithic revolution saw many human cultures end their nomadic lifestyles of hunting and gathering to settle and begin farming.
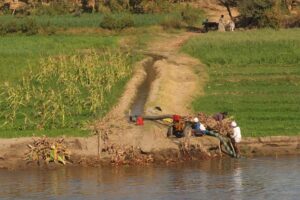
This onset of agriculture has seen humans reshape the Earth’s surface – cultivating crops to provide food for people and animals, grazing livestock on pastures and cutting wood to be used as construction material or fuel.
What started as a gradual process has grown more intensive over time.
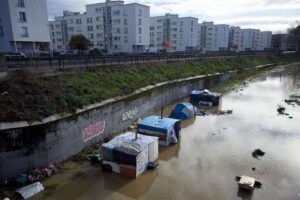
These interventions into natural ecosystems provide the foundation for modern society, but they also come with some unwanted side effects. One of the most dramatic is the tremendous amount of carbon dioxide (CO2) that is released through the way that humans use the land.
As the global community tries to get a grip of its CO2 emissions, understanding where they are coming from is key to stopping them – and to increasing the amount of atmospheric CO2 taken up by the land.
In this article, we show how we can track the ups and downs of CO2 emissions and removals from land-use change in six very different parts of the world – Brazil, China, the Democratic Republic of the Congo (DRC), Europe, Indonesia and the US.
Past, present and future of land-use emissions
Globally, the largest share of humanity’s CO2 emissions stems from burning fossil fuels, which made up about 87% of CO2 emissions over the past 20 years. Land-use emissions are responsible for the remaining 13%.
Historically, land use was even more important, with land-use emissions being larger than fossil emissions until the 1950s. Collectively, one-third of CO2 emissions since 1750 are due to land-use change.
Although the share of land-use emissions has gone down in recent decades, their importance might increase again in the future due to the potential reduction of fossil fuel emissions in line with global climate mitigation policies.
Likewise, reducing CO2 emissions from land use is a key factor for meeting climate targets – for example, the Glasgow Declaration on Forests, agreed at COP26, calls on countries “to halt and reverse forest loss and land degradation by 2030”.
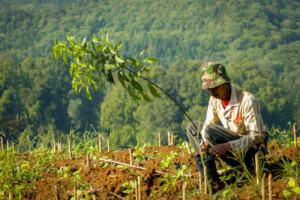
These intended emission reductions can be complemented by taking up and storing additional carbon in biomass and soils – for instance, via forestation and forest management. Sustainable land use can, thus, itself become a key element for climate mitigation.
CO2 emissions to the atmosphere and carbon uptake by vegetation and soils are known as carbon fluxes. The balance between all of these fluxes determines whether the land is a net “source” of carbon or a net “sink”.
To reverse land use from being an overall global source of CO2 to being a sink, it is essential to understand the various drivers of these fluxes.
Furthermore, as mitigation policies are mainly implemented at the national level, estimating land-use CO2 fluxes for individual countries provides important insights into the effectiveness of mitigation efforts.
Estimating CO2 fluxes from land use
Global estimates of land-use CO2 fluxes are often based on computer models that provide a consistent method of quantifying fluxes for all countries.
Of particular importance are “bookkeeping” models. These track changes in the carbon contents of soil and vegetation that occur due to land-use changes (such as deforestation, where forest is converted to agricultural land) or land management (such as wood harvest, where forest remains forest) based on spatially explicit data.
The resulting CO2 fluxes between land and atmosphere are calculated as the changes in carbon contents of soil and vegetation.
Bookkeeping models account for various processes – ranging from the fast emission of CO2 due to fires, to the rather slow decomposition of long-lived wood products, to the gradual regrowth of forest. They are complemented by CO2 emissions from peat drainage and peat fires from existing estimates.
The Global Carbon Budget (GCB) – published each year by the Global Carbon Project – currently uses estimates from three bookkeeping models to provide land-use CO2 fluxes at global level.
These models have been improved in recent years and now include more detailed data for specific countries. As a result, the most recent GCB of 2022 extended its assessment to include land-use CO2 flux estimates at the country-level.
Land-use CO2 fluxes in individual countries
In the chart below, we take a closer look at six countries and regions with distinct land-use flux dynamics. The chart shows annual land-use CO2 fluxes for each region. Lines above the zero line indicate a net source of CO2, while lines below indicate a net sink. In all countries, land-use CO2 fluxes show substantial year-to-year variability.
Brazil (blue), Indonesia (red), China (dark blue) and the DRC (yellow) have had the highest land-use CO2 emissions in the last 70 years – representing around 45% of all emissions from net-emitting countries.
Europe (purple) and the US (orange) have had the largest net CO2 removals – representing about 90% of all removals from countries with a net sink. China switched from net land-use emissions to net removals in the 2000s.
Drivers of land-use change
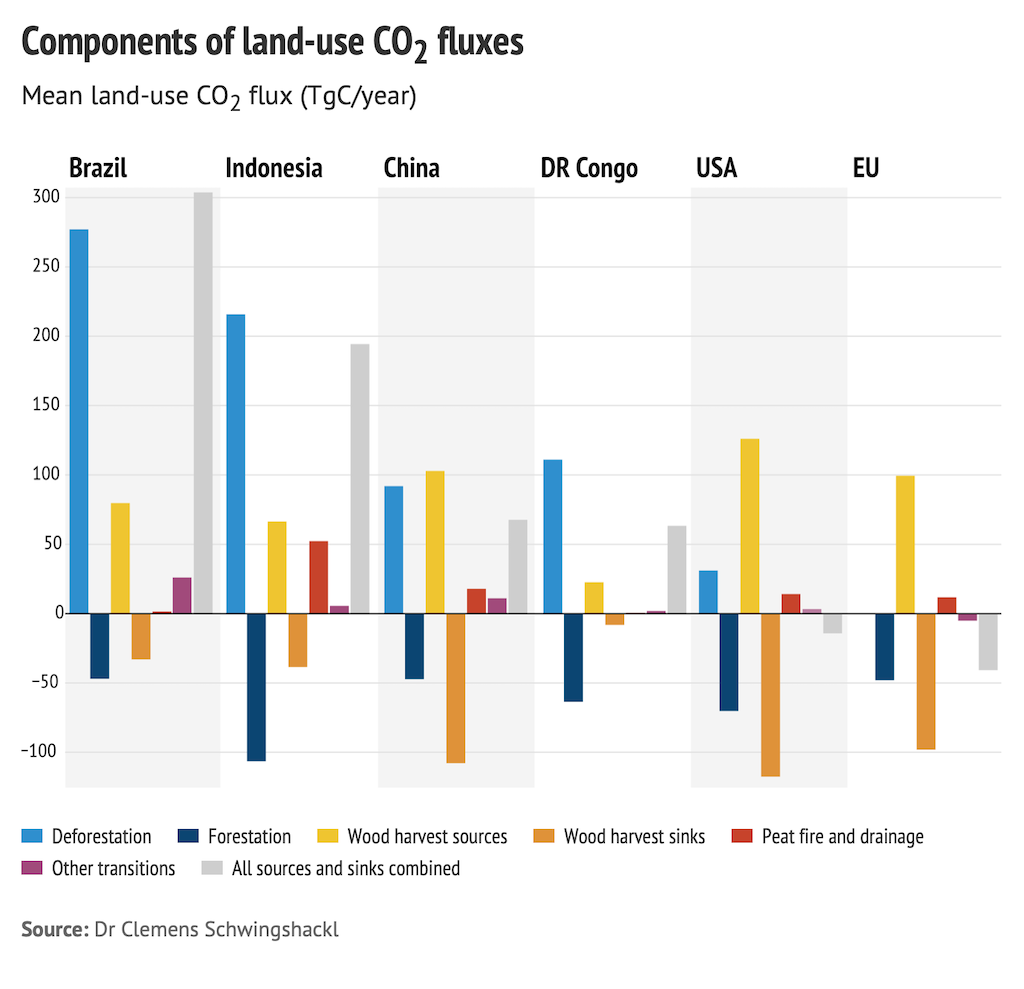
The models we use allow us to estimate the impact of specific drivers of CO2 fluxes for individual countries. The chart below illustrates the variations that this analysis reveals.
The bars for each region show average CO2 fluxes from deforestation (blue), forestation (dark blue), wood-harvest emissions (yellow) and removals due to regrowth (orange), peat fires and drainage (red) and other transitions (purple) for 1950-2020.
These other transitions include the transformation of shrubland to cropland or pasture or conversions between cropland and pasture. Bars above the zero line indicate sources of CO2, while bars below indicate sinks. The grey bars show the overall net fluxes from land use for each region.
In Brazil, land-use emissions were high, but relatively constant, between the 1960s and the 1980s. In the 1990s, emissions began to rise and reached a peak in the early 2000s, as deforestation rates accelerated. In the following years, deforestation and emissions decreased substantially under the presidency of Luiz Inácio Lula da Silva (Lula), but they have started to increase again in the most recent years due to less-stringent forest protection policies under former president Jair Bolsonaro.
While deforestation clearly dominates CO2 emissions in Brazil, substantial emissions also stem from wood harvest and from other transitions.
In contrast, CO2 uptake due to forestation and regrowth after wood harvest only plays a minor role in Brazil. It is noteworthy that the large emissions from deforestation in Brazil (and Indonesia) are not only due to domestic consumption, but are also substantially driven by the demand for agricultural products in Europe, the US and China. Efforts to reduce land-use CO2 emissions thus need to consider that emissions may be partly embodied in international trade.
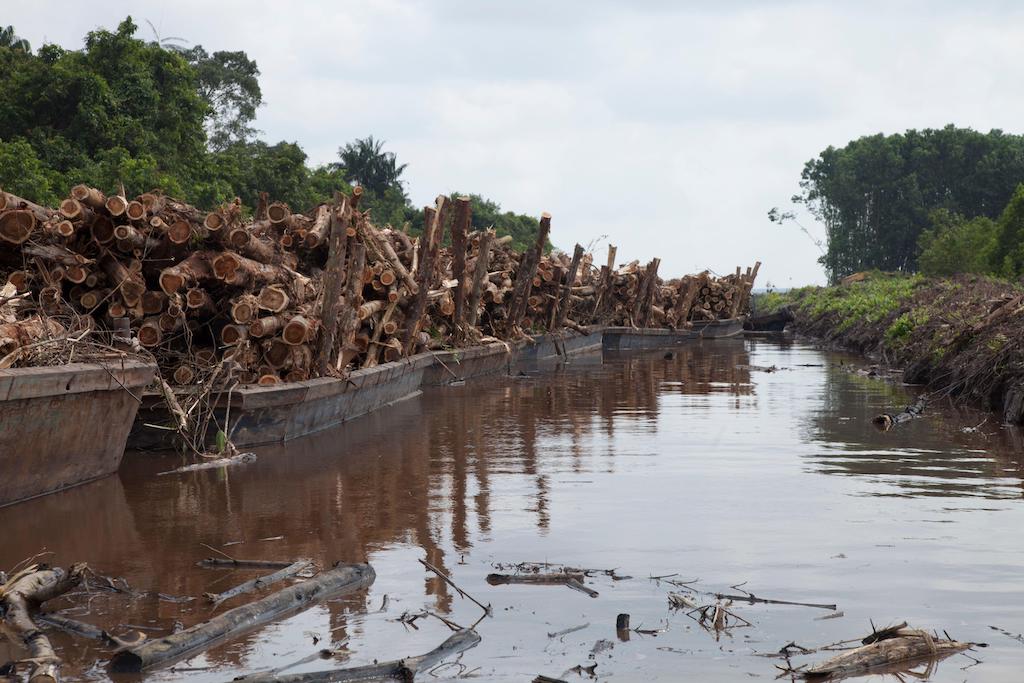
For Indonesia, emissions are characterised by a quick increase in the 1980s, which was predominantly due to deforestation for the expansion of palm oil plantations and cropland. This was followed by several large emissions peaks starting in the late 1990s, caused by widespread peat fires used – on top of drainage – to convert peatlands into agricultural land.
In 1997, remarkably high emissions were apparent resulting from the interaction of land-use changes and an extremely dry El Niño year. Strikingly, Indonesia has the largest CO2 uptake due to forestation of all countries displayed. However, regrowth after harvest only partly offsets wood harvest emissions, pointing to unsustainable forestry practices.
The DRC has had low emissions throughout the 20th century, but emissions increased substantially in the late 2000s and remain high to this day.
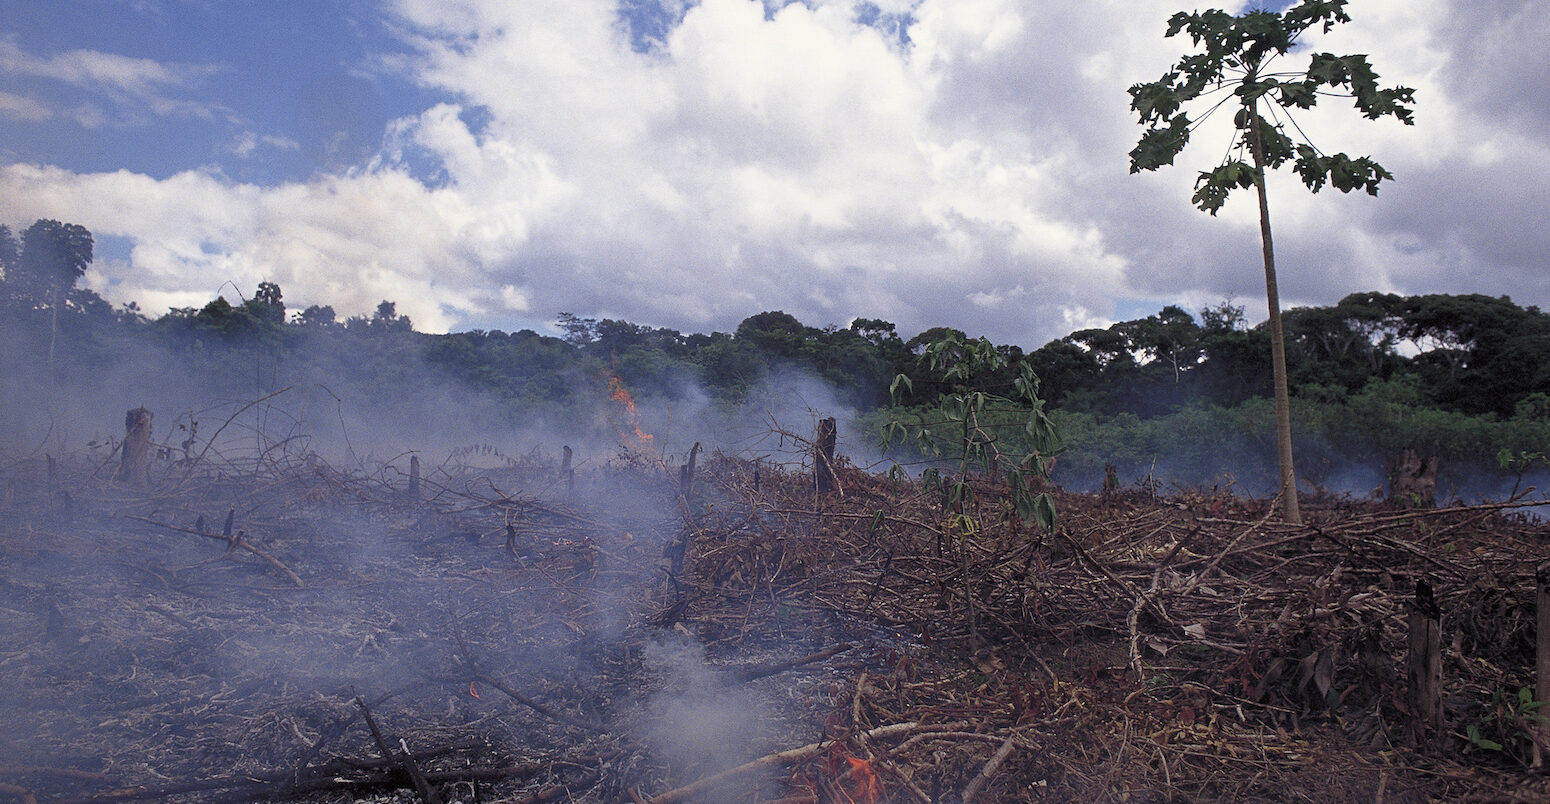
Emissions from deforestation dominate land-use fluxes in the DRC, but they are largely counterbalanced by removals due to forestation. Farmers in the DRC often apply shifting cultivation, an agricultural practice in which forests are burned down to obtain arable land (causing CO2 emissions), which is in turn abandoned after a few years, allowing forests to regrow and take up CO2 again. This results in high CO2 fluxes from both deforestation and forestation, respectively. Other fluxes are mostly negligible in the DRC.
China saw a sharp increase in emissions due to deforestation in the 1980s. However, large uncertainties exist regarding the timing and extent of the deforestation activities, which is reflected in the large uncertainties of China’s emissions in that period. Economic reforms starting in 1978 led to decreasing deforestation rates and to forest expansion, causing a decline in CO2 emissions from the 1980s onwards.
In the last 20 years, land-use fluxes in China have remained close to net-zero, as emissions due to deforestation and wood harvest have been largely offset by CO2 uptake from forestation and regrowth after wood harvest.
In the US, emissions decreased in the 1950s, and land use has been a relatively small net carbon sink from the 1960s onwards, albeit with substantial uncertainties. Wood harvest causes the highest emissions, although these are counterbalanced by subsequent regrowth.
Collectively, Europe (specifically, the 27 countries that now make up the EU) had a constant carbon sink throughout the last 70 years, mainly due to forestation. Europe has a long history of deforestation, going back to Roman times and intensifying until it reached a peak at the onset of the industrial revolution. In the years that followed, forests in Europe started to regrow again, leading to large-scale CO2 removals. The balance of emissions and removals from wood harvest suggests that forestry in Europe is sustainable.
It is worth noting that the uncertainties around the land-use CO2 fluxes shown here are substantial for several countries – particularly in Brazil, China and the US. These large uncertainties are due to various reasons, but mostly stem from differences in land-use change data used by the different bookkeeping models and differences in process implementation – such as in the consideration of fire management in the US. There are also varying assumptions on how much carbon is stored in soils and different types of vegetation, and on how quickly vegetation and soils emit carbon (after deforestation) or take up carbon (after reforestation) following land-use changes.
Importance of national mitigation plans
Emissions from land-use change can be expected to decrease substantially in the coming years – as long as countries put the land-use commitments within their Paris Agreement climate pledges into action.
Detailed knowledge of the changes and drivers of land-use CO2 fluxes in individual countries provides a key element to monitor and assess the country-specific measures to cut emissions and increase removals.
Specifically, splitting up land-use fluxes into their components allows for a separate assessment of emissions and removals. Net CO2 sinks are only possible if CO2 removals from forestation exceed the sum of emissions from deforestation, peat emissions and other emission-causing land-use transitions.
Furthermore, the split into components makes it possible to compare model-based estimates with the land-use CO2 fluxes that countries report to the United Nations Framework Convention on Climate Change (UNFCCC) in their national greenhouse gas inventories.
A comprehensive and reliable quantification of land-use fluxes is also essential in light of the increasing importance of carbon dioxide removal (CDR) technologies, since the vast majority of CDR currently stems from conventional management of land, such as reforestation.