Guest post: Misleading media coverage of Antarctic sea ice paper

Dr Jonathan Day
11.29.16Dr Jonathan Day
29.11.2016 | 8:41amDr Jonathan Day is a polar climate scientist at the University of Reading. His work focuses on understanding and predicting changes in sea ice in the Arctic and Antarctic.
Last week, my colleague Tom Edinburgh and I published an article estimating the extent of Antarctic sea ice in the early 1900s, using sea ice observations recorded by explorers of the time.
It received an overwhelming amount of coverage in the media. This was largely because it combined a human-interest story about the conditions faced by the early Antarctic explorers with an illuminating result regarding the thorny issue of Antarctic sea ice trends.
Despite significant increases in global average temperature, sea ice in the Antarctic has been slightly increasing in extent over recent decades (1979 – present).
Although much of the coverage was very well reported, there were other examples of the results being wrongfully interpreted, perhaps wilfully so. Some of the errors led to confusion, such as conflating sea ice with land ice. Others attempted to cast doubt on the link between greenhouse gases and global mean temperature, which was inappropriate and misleading.
-
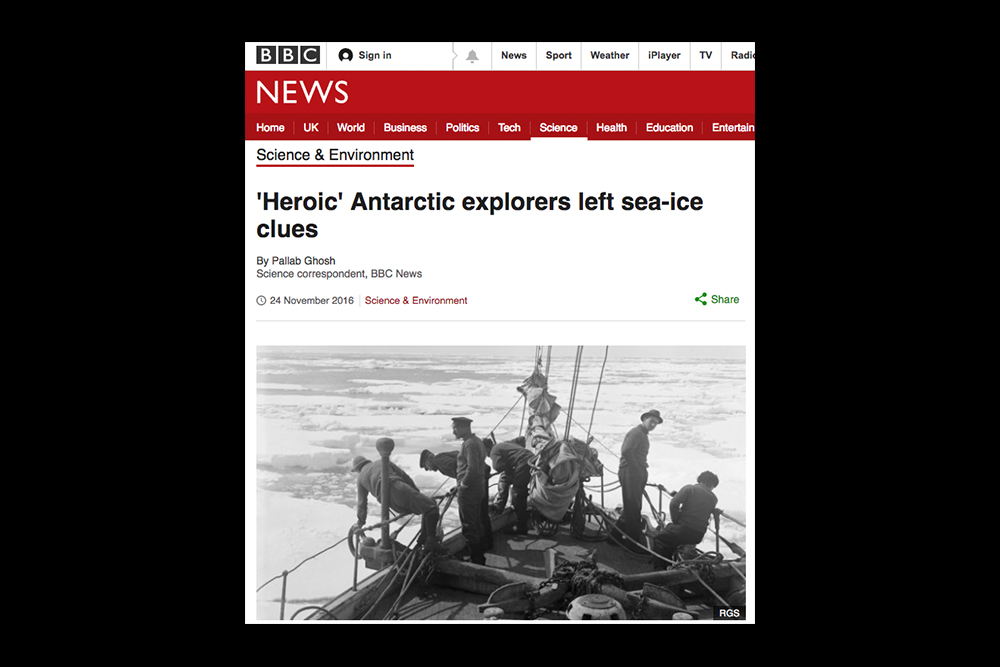
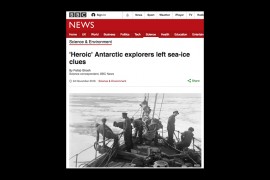
The BBC's coverage of Edinburgh and Day's 2016 paper on Antarctic sea ice and Captain Scott's expedition logs.
-

The Daily Express' coverage .
-
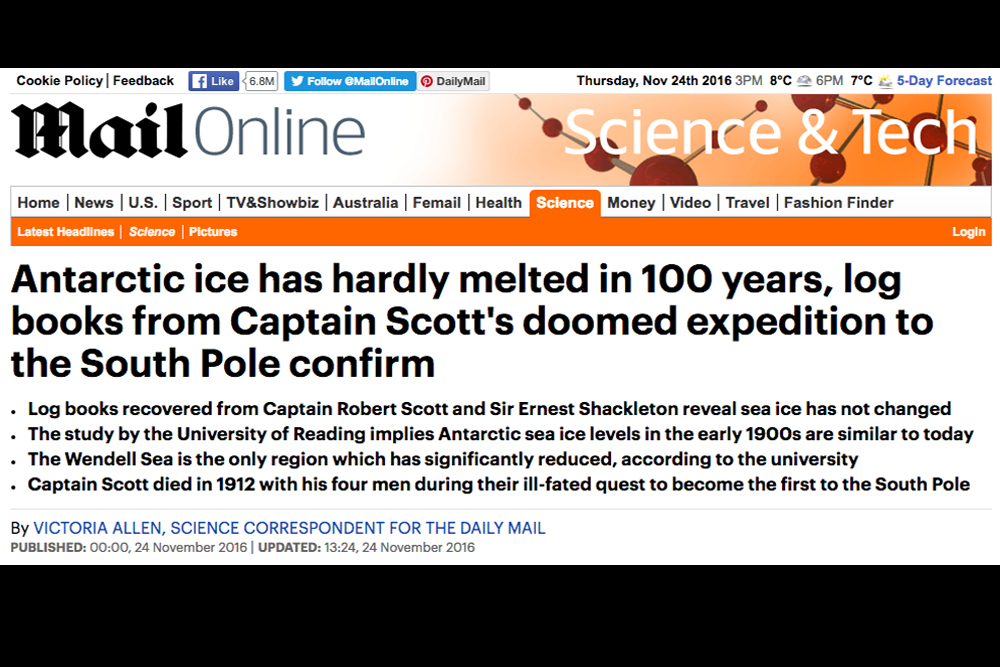
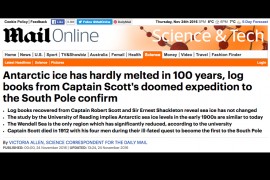
The Mail Online's coverage.
-
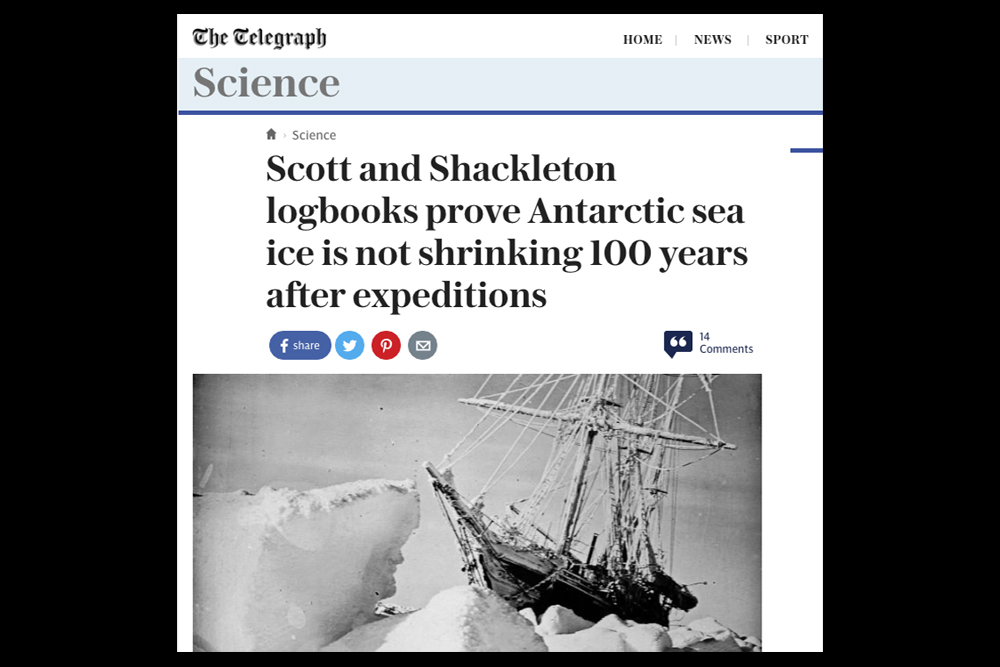
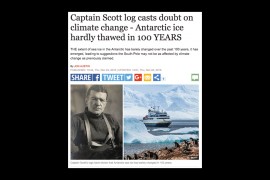
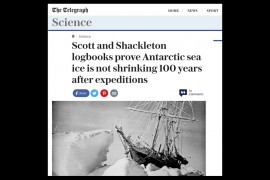
The Telegraph's coverage.
-

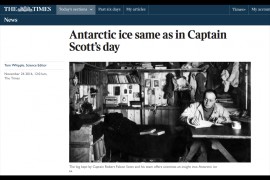
The Times' coverage.
-
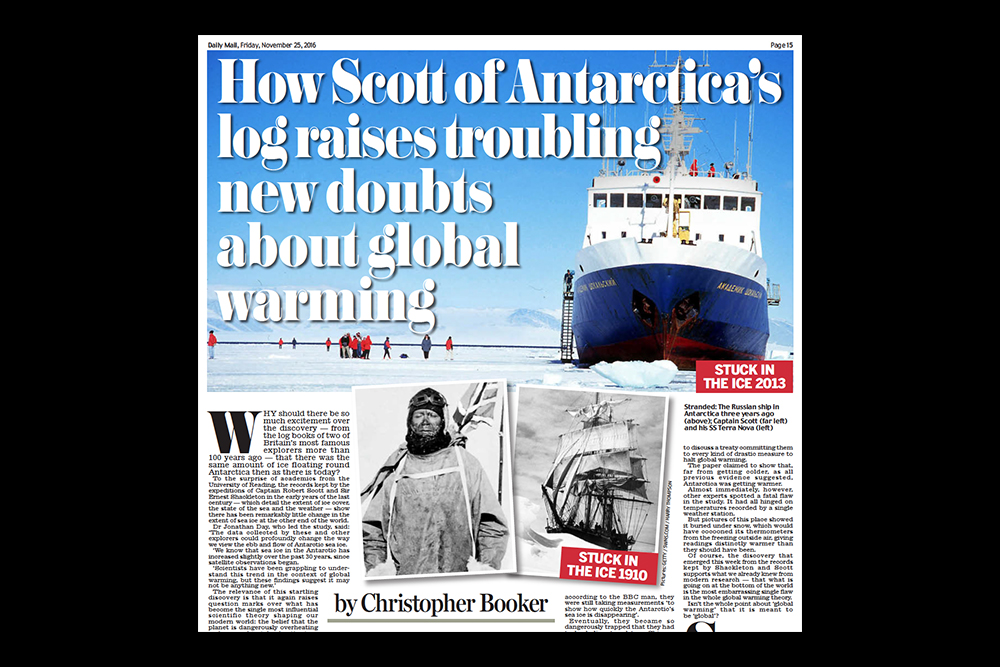
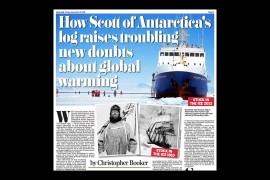
The Daily Mail's coverage.
Sea ice extent
Our study showed that expeditions to the Weddell Sea in the early 1900s found the sea ice edge much further north than we’ve seen in recent decades. For example, in early February 1903, the Scotia expedition encountered sea ice much further north than the maximum observed between 1989 and 2014.
In other regions, sea ice conditions were much the same as recent observations. For example, in the Ross Sea, where the Terra Nova expedition enters (12th Dec 1910) and leaves (5th March 1911) the sea ice is very close to the average sea ice edge during 1989-2014.
This led us to conclude that, overall, summer sea ice conditions in the early 1900s were similar to today, with a likely reduction in the Weddell Sea.
However, published estimates for the intervening period estimate that the sea ice was more extensive during the period from the 1930s to 1950s, before declining in the 1960s and ‘70s to today’s levels. Putting this information together indicates that, far from being stationary in time, the summer sea ice ebbs and flows on timescales of multiple decades.
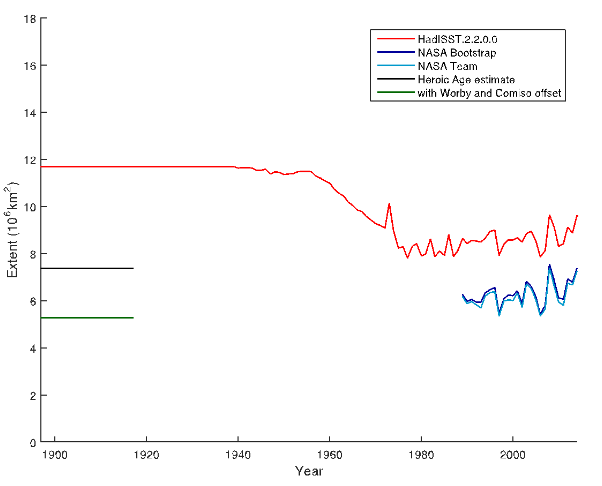
The estimated DJFM Antarctic sea ice extent climatology for the period 1897–1917, with and without the inclusion of the Worby and Comiso offset (an offset between where satellites and human observers view the sea ice edge), is plotted alongside time series of DJFM mean sea ice extent calculated from HadISST2.2, NASA Team and NASA Bootstrap sea ice datasets. Note: The Heroic age estimate should be compared with the NASA Bootstrap modern climate rather than HadISST.
Signal vs noise
Climate variations are made up of both long-term trends, such as in response to greenhouse gases and aerosols, and shorter term fluctuations due to natural variability, such as the El Nino Southern Oscillation. Climate scientists use statistical techniques to identify where there is a noticeable long term trend amongst the noise of natural variability. The North Atlantic, for example, has experienced periods of accelerated warming and cooling, superimposed on a long-term warming trend.
Research by Ed Hawkins indicates that for surface temperature in the waters surrounding Antarctica, the signal of climate change may be slow to emerge from the noise of natural variability in this region. This means a long observational record would be needed to measure the climate signal.
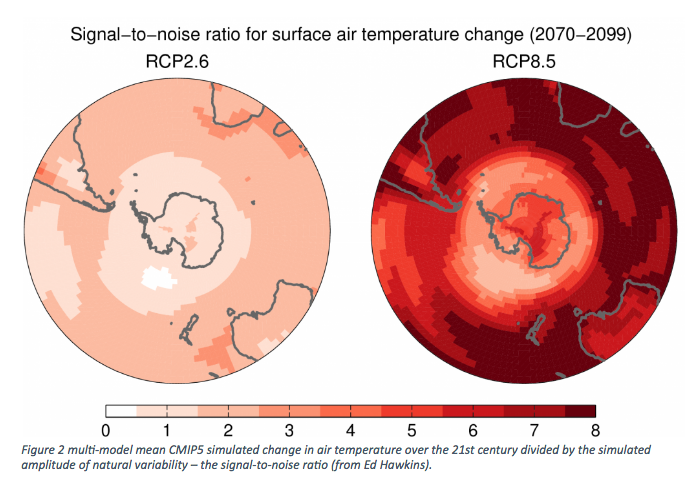
Multi-model mean CMIP5 simulated change in air temperature over the 21st century divided by the simulated amplitude of natural variability – the signal-to-noise ratio (from Ed Hawkins).
In my efforts to communicate these points to the media last week I learnt exactly how hard it is to get these messages across, with a tendency for some reporters to reduce the message to one of no human caused climate change in Antarctica. This message in incorrect for two main reasons.
First, the actual message should have been along the lines of “natural variability may be more important in Antarctica than previously thought”. A high degree of natural variability can mask any human caused signal, so this tendency to reduce climate shifts to either being natural or manmade is not useful, even if it does simplify the message for a better story.
Secondly, some reports confused sea ice with land ice, inferring from our analysis of sea ice extent that Antarctic climate, more generally, is not sensitive to global warming. Some outlets even used this to cast doubt on the overall science of climate change. Our examination of one variable, in one season, in one particular region of the Earth adds to our understanding of Antarctic climate variability and does not change the fundamentals of the role of greenhouse gases in the climate system.
Confusing sea ice and land ice is a problem!
The West Antarctic ice sheet, the majority of which is not floating, has received much attention in recent decades. It is dynamically unstable and has the potential to raise sea levels by several meters.
The sea ice surrounding the continent is frozen seawater and does not have the same potential to raise sea levels if it melts. Therefore, using our study to make generalisations about Antarctic ice more generally is deeply unhelpful and confusing.
Looking ahead
Finally, what does all this tell us about recent sea ice trends and the future?
For those following the Antarctic sea ice news last week, there were two stories breaking. Our study which presented a picture of little overall change in 100 years and another about the lowest sea ice levels seen in October-November for 35 years.
Does this indicate that the sign of the trend in Antarctic sea ice is changing?
It is hard to tell from two months of data, but if natural variability has contributed to the positive sea ice trends in recent decades at some point in the future we would expect this to switch sign to a decreasing trend, similar to that seen in the 1970s.