
Guest post: Piecing together the Arctic’s sea ice history back to 1850
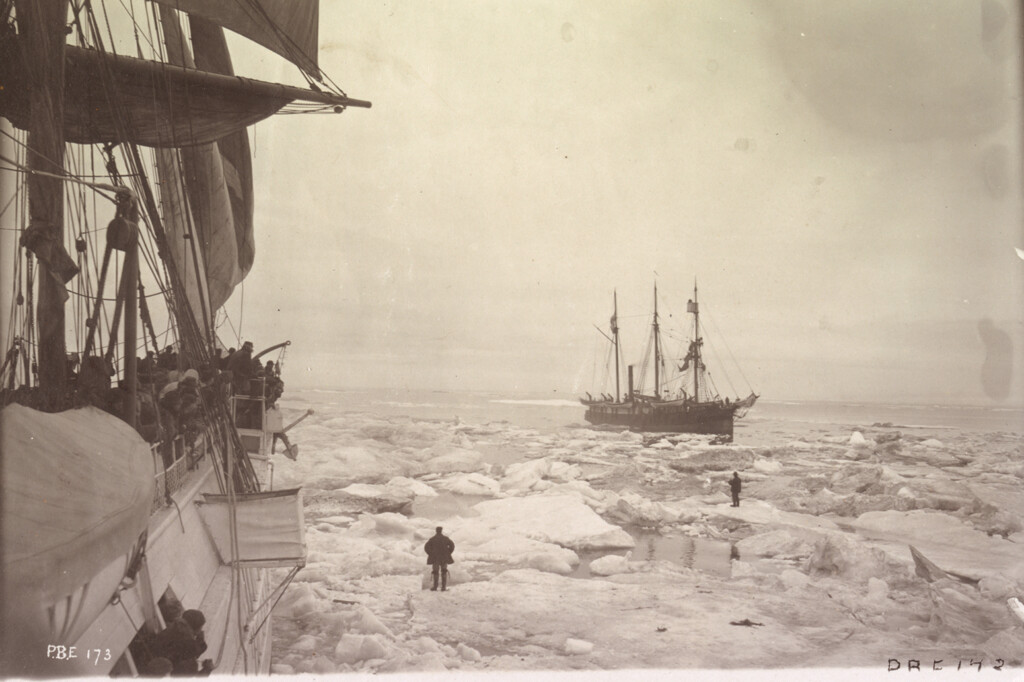
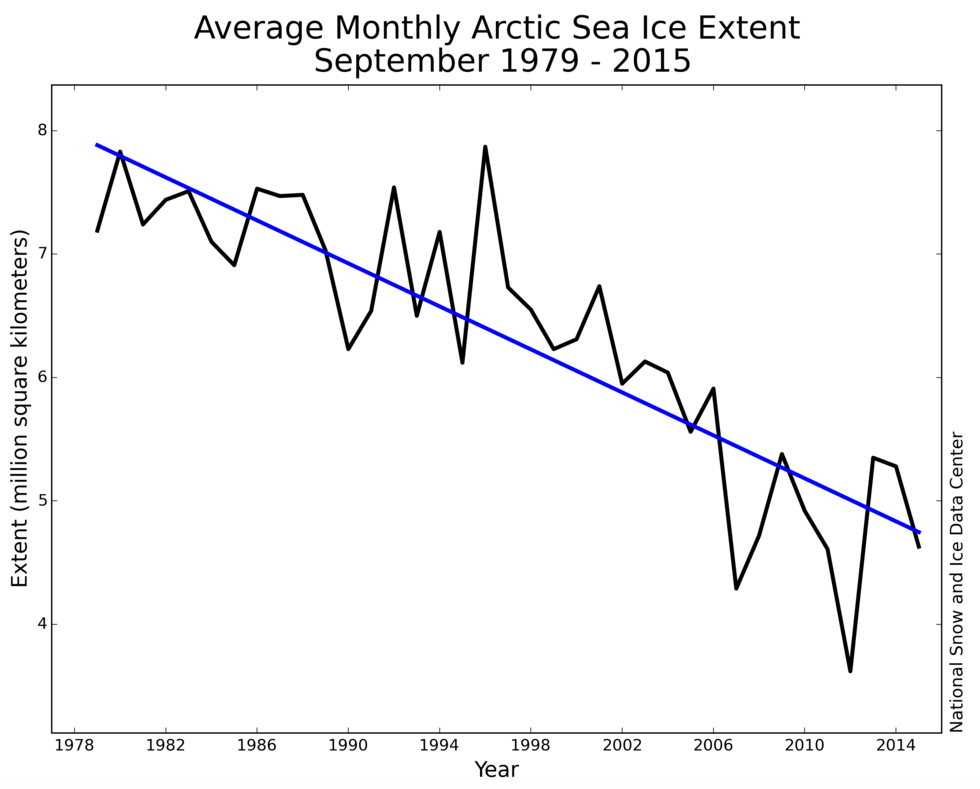
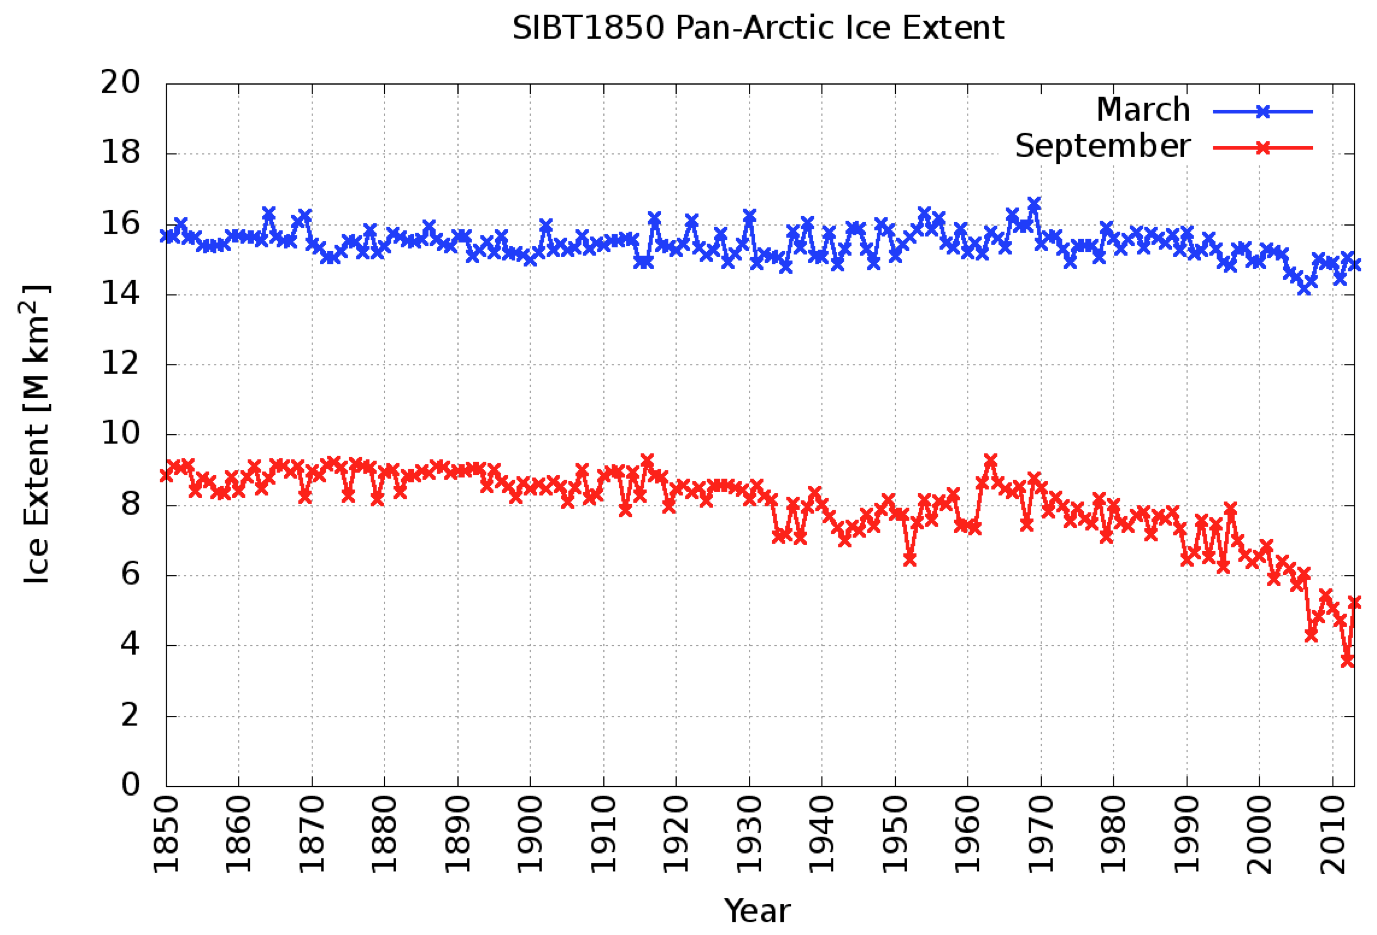
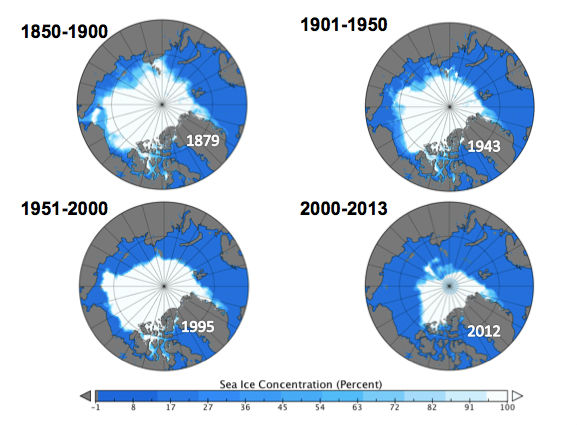
- Has Arctic sea ice cover been this small since the start of the industrial revolution?
- Has sea ice ever declined this rapidly in the historical record?
- How is sea ice affected by natural fluctuations over multiple decades?
Digitising data
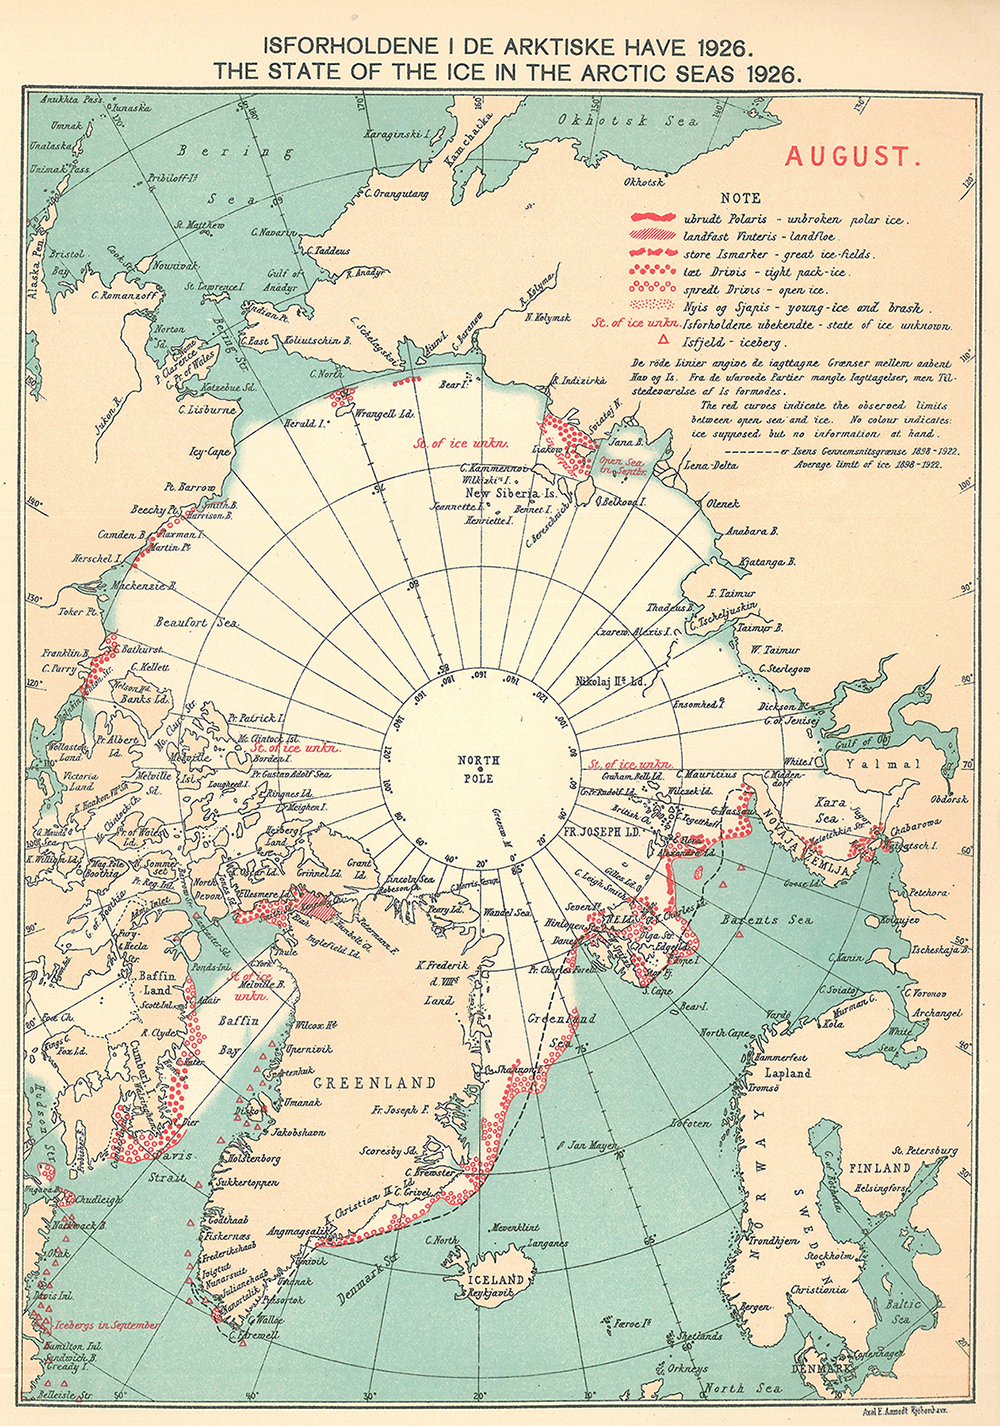
First, a little background. In the 1970s, the world’s community of sea ice researchers was a small one. Academics were mainly interested in the role sea ice played in regulating the surface energy balance of the Arctic. Sea ice insulates the cold atmosphere from the warmer ocean, reflects sunlight throughout the polar summer, and releases or stores heat through the process of melting or freezing. At the time, the question of whether variability in Arctic sea ice extent was being affected by the climate was still an open one. Nevertheless, scientists were still concerned about preserving existing data on sea ice, and gathering more, with the aim of producing an Arctic-wide view of sea ice conditions. Observations of sea ice came from far and wide, including ship reports, aeroplane surveys, compilations by naval oceanographers, and analyses by national ice services and meteorological offices. Prof John Walsh, now at the University of Alaska Fairbanks, and Dr Mick Kelly, from the University of East Anglia (now retired), were pioneers at retrieving data. They hand-digitised information from sources, such as aerial surveys, from the US Navy and UK Meteorological Office, and from the Danish Meteorological Institute’s yearbook maps (see examples from 1978 and 1979 – both pdfs). Walsh, along with Prof William Chapman from University of Illinois, used these various sources to make monthly grids in Arctic and Southern Ocean sea ice concentrations, covering the period 1901-95. These grids proved to be very popular among researchers – possibly because there were few alternatives. However, the early years of this record had significant gaps. Almost no ice information was collected during the second world war, for example. These gaps were filled by using the long-term averages for each month. This is illustrated in the charts below, which show monthly sea ice data from the Met Office Hadley Centre (red and black lines) and the recent NASA satellite record (blue line).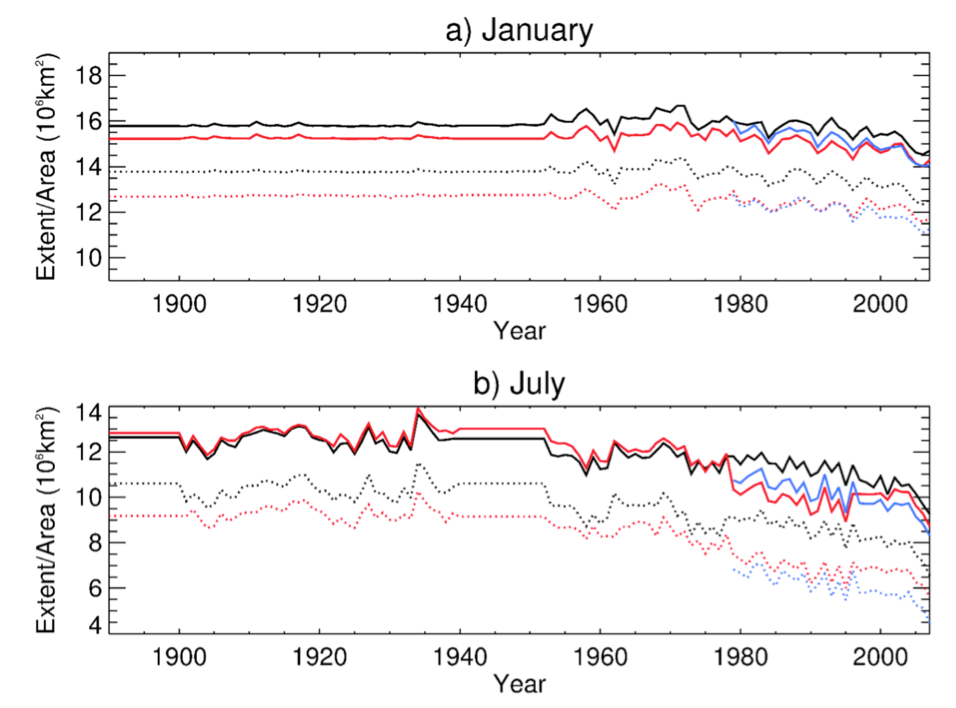
New sources
We’ve used a range of new data sources to fill gaps and extend the Arctic sea ice record back to 1850. We’ve also updated the record with the latest satellite data. These are some of the sources of information we used to create our sea ice dataset:- The sea ice edge positions in the North Atlantic, between 1850 and 1978, derived from various sources, including newspapers, ship observations, aircraft observations, diaries and more.
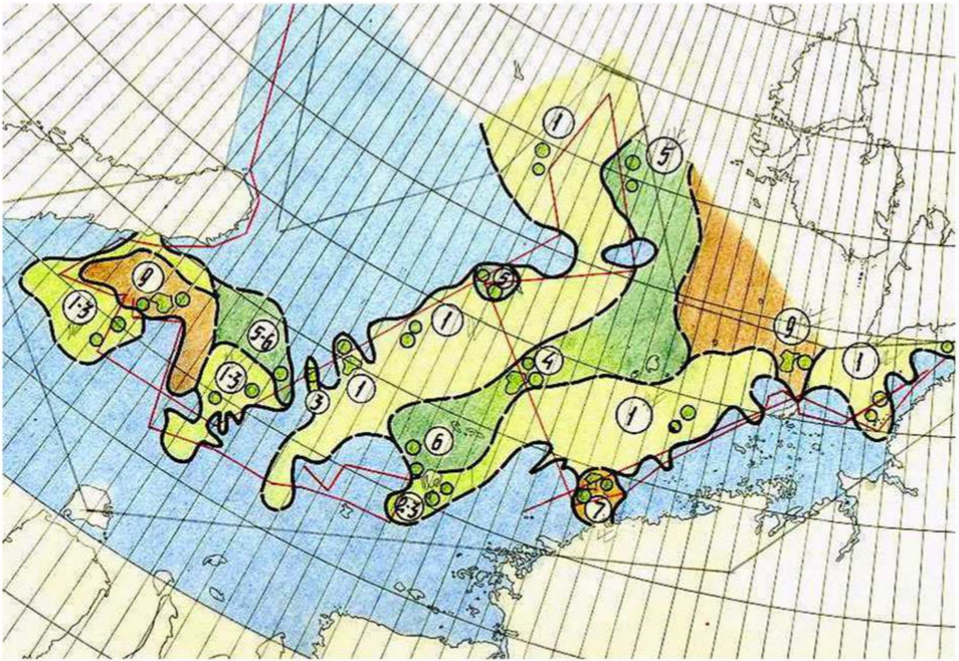
- Sea ice concentration data from regular aerial surveys of ice in the eastern Arctic by the Arctic and Antarctic Research Institute, St. Petersburg, Russia, beginning in 1933.
- Sea ice edge positions for Newfoundland and the Canadian Maritime Region from observations, for 1870 to 1962.
- Detailed charts of ice in the waters around Alaska for 1954 to 1978, originally the property of a consulting firm (the Dehn collection).
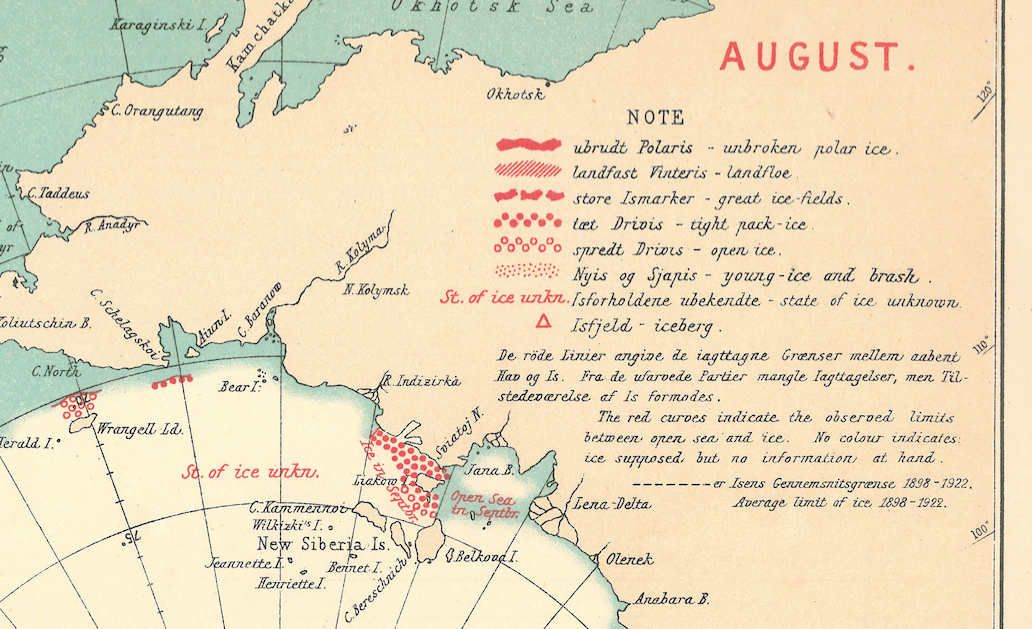
- Arctic-wide maps of ice cover from the Danish Meteorological Institute from 1901 to 1956.
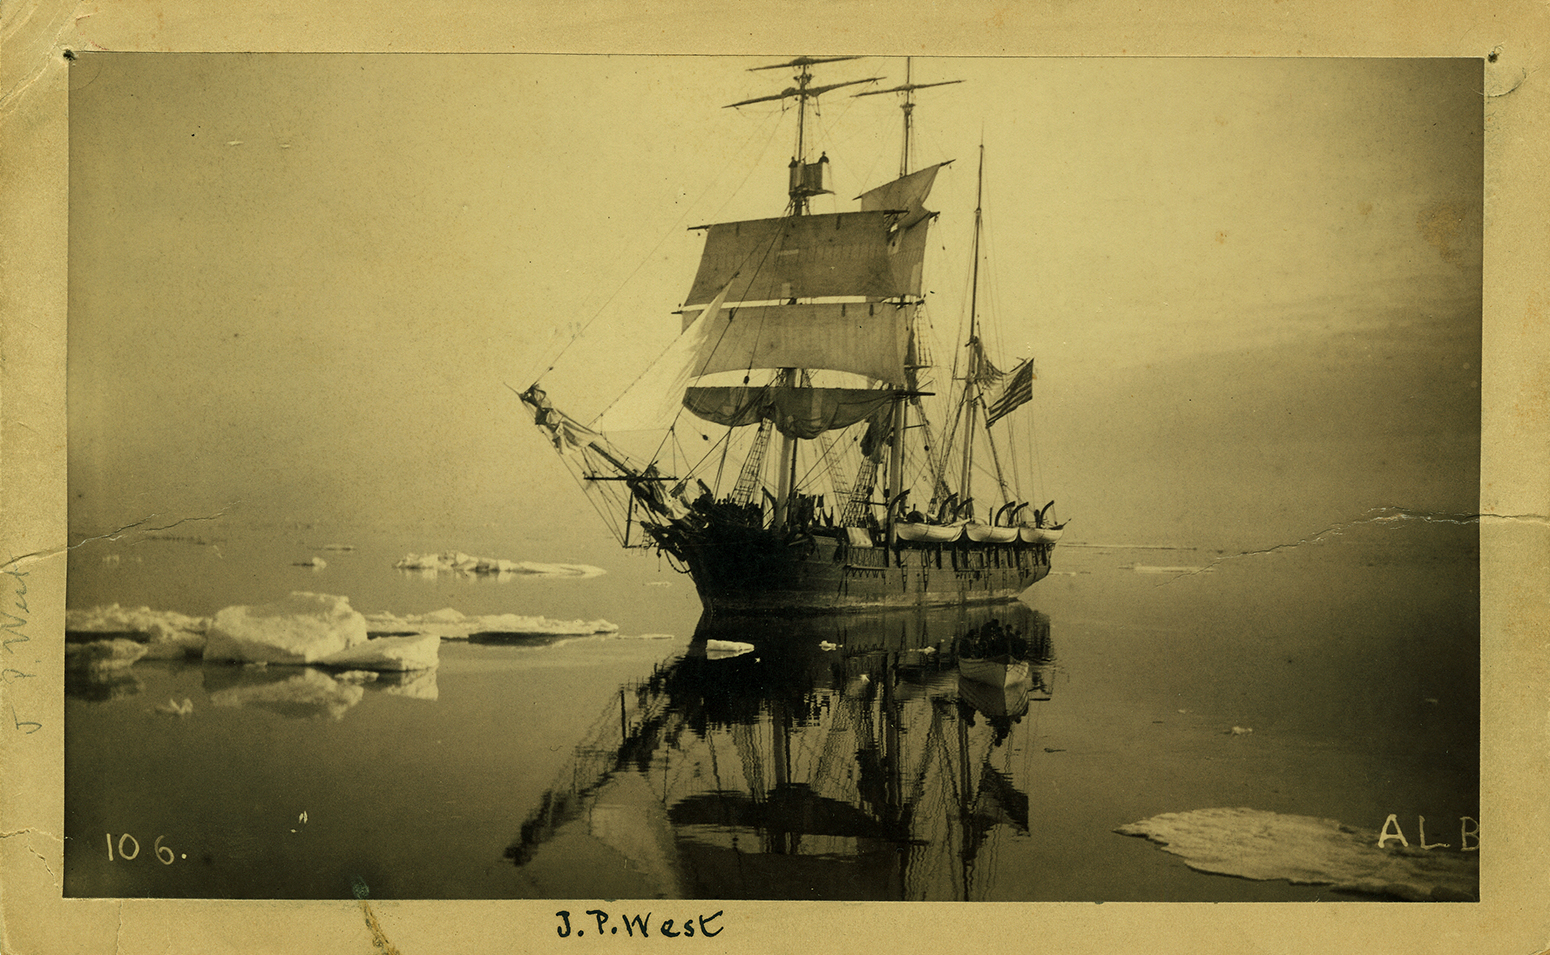
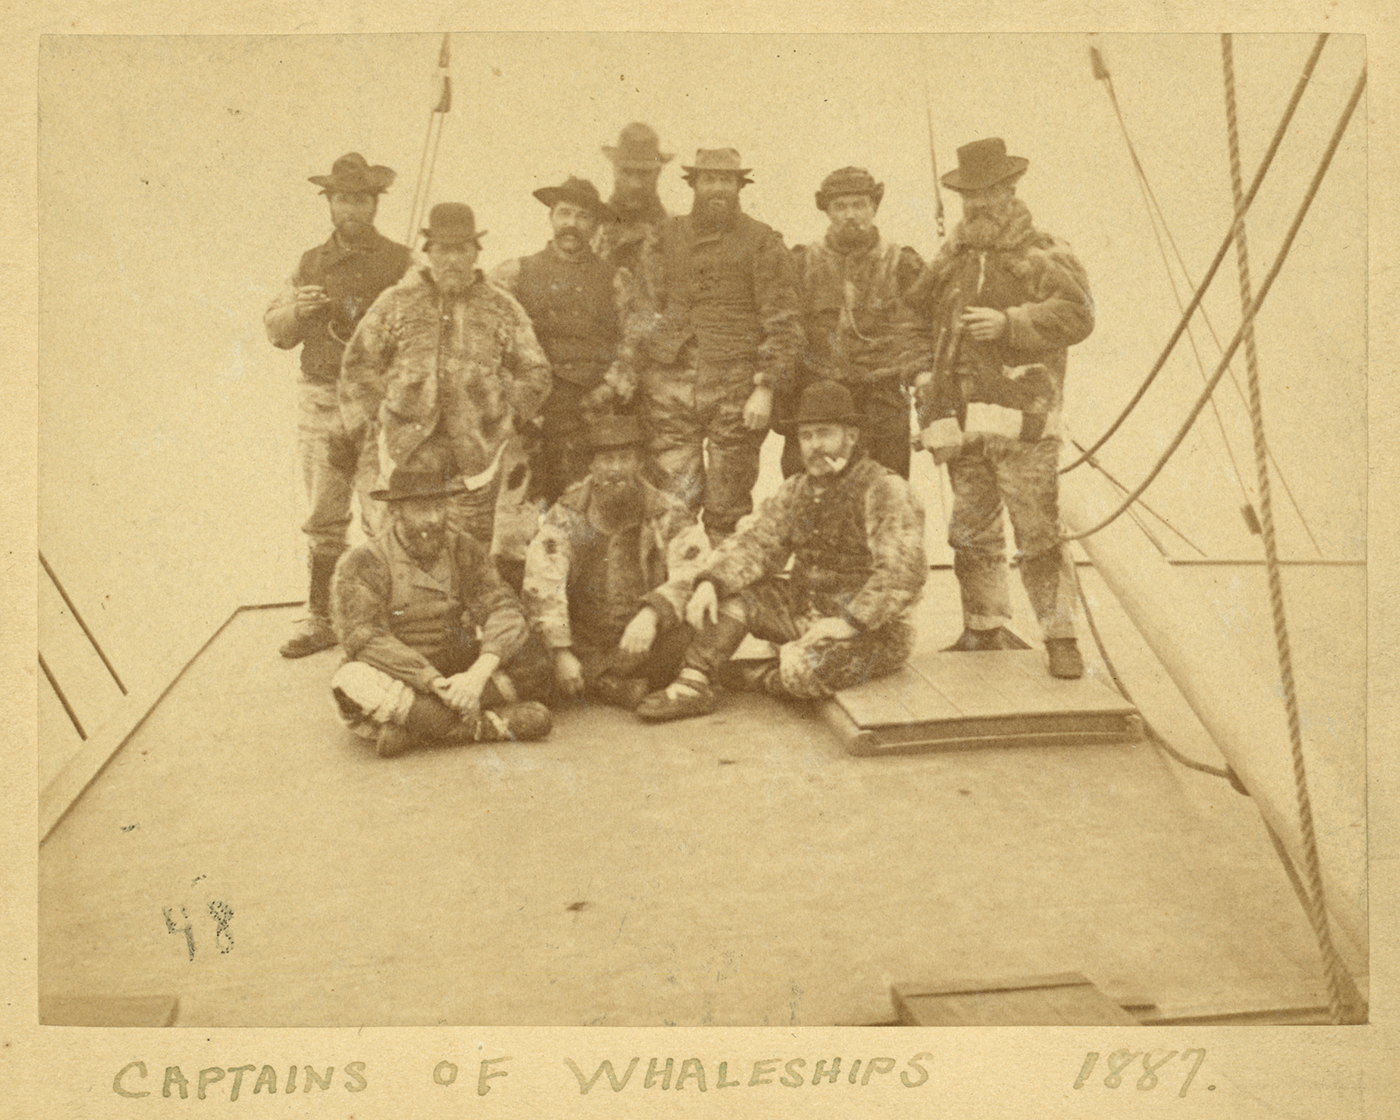
- Whaling ship logbook entries that noted ship position along with an indication of whether the ship was in the presence of ice (see image of whaling ship below).
Article information
This guest article is based on the following journal paper:
Walsh, J. E., Fetterer, F., Stewart, J. S. and Chapman, W. L. (2016) A database for depicting Arctic sea ice variations back to 1850. Geographical Review, doi:10.1111/j.1931-0846.2016.12195.x