Guest post: The causes and impacts of Pacific north-west’s brutal 2021 heatwave

Dr Rachel White
02.13.23Dr Rachel White
13.02.2023 | 3:35pmHeatwaves can have devastating impacts on humans and ecosystems. And the record-breaking Pacific north-west heatwave of June 2021 was no exception.
It was one of the most extreme regional heat events ever recorded globally, breaking some local high temperature records by more than 6C.
When a heatwave surpasses temperature records by such a distance, the impacts may be particularly catastrophic. Understanding the impacts of such extremes may help communities across the world better prepare for the record-shattering heat events that are projected to occur with increasing frequency as the climate continues to warm.
In a new study, published in Nature Communications, my co-authors and I – many of whom personally experienced the heatwave – look back at this unprecedented event, its causes and its multitude of impacts.
Record-shattering heat
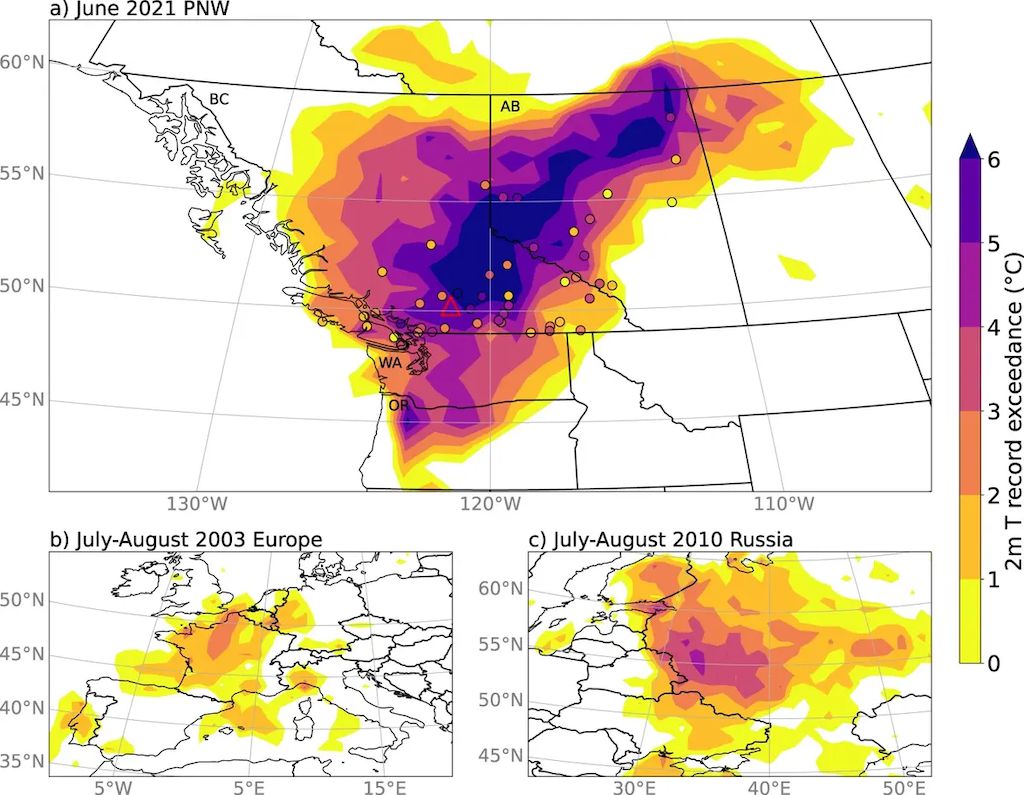
The upper map below shows the margins by which local records were broken in the Pacific north-west heatwave.
The purple shading indicates the areas where 70-year records were eclipsed by more than 6C. Even the national Canadian temperature record was shattered, with a new record temperature of 49.6C, an extraordinary 4.6C higher than the previous record of 45C (set in Saskatchewan in 1937).
The extreme high temperatures lasted for around a week – a relatively short time period compared to some other heatwaves. However, many of the impacts continued to act long after the heatwave finished.
For comparison, the two lower maps show the infamous heatwaves in Europe during July-August 2003 and Russia in July-August 2010. These heatwaves were ferocious and deadly – both killed tens of thousands of people – but their record-breaking margins were smaller.
Why was this heatwave so unprecedented?
The primary cause of this heatwave was a “blocking” weather pattern – a region of high pressure in the atmosphere that stalled over the Pacific north-west region.
In the mid-latitudes, weather systems typically move from west to east. However, sometimes they stall and stay in one place for several days or weeks – a stalled high pressure system can create an atmospheric block – also known as a “blocking high”.
During summer, blocking highs often lead to high temperatures. This is due to a combination of factors, including subsidence – where warmer air descends from higher levels – in the centre of the block, stable atmospheric conditions trapping heat near the surface and heating from the sun’s incoming radiation on cloudless days.
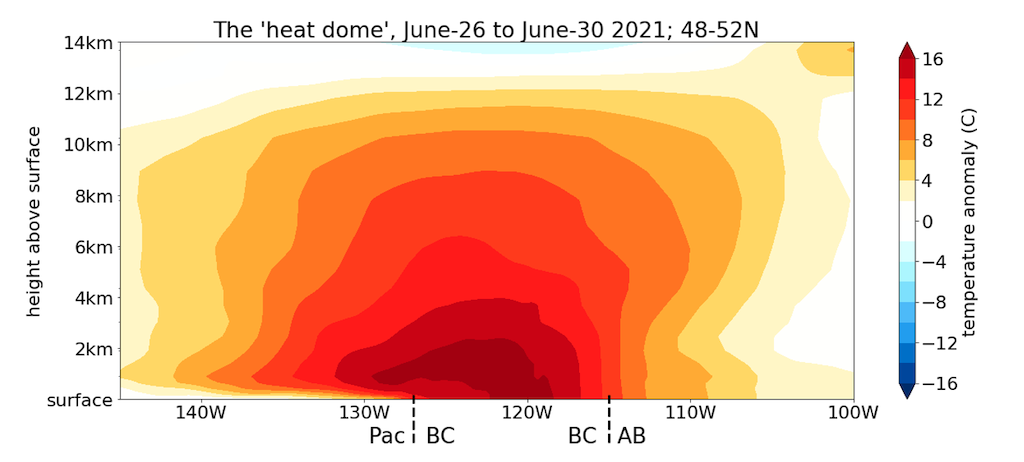
In the 2021 heatwave, these conditions led to the creation of a dome-shaped region of unusually high temperatures. This is illustrated in the figure below, which shows a dome of strong temperature anomalies in a west-east cross-section along 50 degrees north during the heatwave. This was frequently described as a “heat dome” in the media.
But why did this blocking high cause such record-shattering temperatures?
Our analysis finds that, in addition to the “heat dome” processes, a substantial amount of the anomalous heat in this event was actually generated upwind of the block, through “latent heating” – heat given off as water vapour condenses – within weather systems over the Pacific ocean.
Other research has found that unusually dry soil moisture also helped increase surface temperatures during the event. With less moisture in the soil, less heat goes into evaporation and more is available to heat the land. (It is for the same reason that land warms up faster than the ocean.)
The timing of the event, just after the summer solstice when solar insolation in the northern hemisphere is maximum, likely also played a role, but further research is required to quantify this.
By driving up average summer-time temperatures, human-caused climate change likely increased the extreme temperatures by around 1C. In addition to this well-understood thermodynamic impact of climate change on extreme heat, there is on-going scientific debate about what the dynamic impacts of climate change are – that is, whether the frequency or strength of these blocking highs may be changing.
What is clear is that climate change contributed to how extreme this record-shattering event was.
But, even taking the effects of climate change into account, this was an extraordinary and rare event. Exactly how rare this heatwave was in the current climate conditions is still under scientific debate, with recently published estimates – using different methodologies – varying from 1 in 200 years to 1 in 100,000 years.
Health impacts
Shortly after the heatwave, the Canadian provinces of British Columbia and Alberta and the US states of Washington and Oregon all reported an increase in deaths.
The British Columbia Coroners Service has attributed 619 deaths (pdf) to the extreme conditions. Combined with data reported from other provinces and states produces a preliminary estimate of at least 868 attributable deaths.
It is worth noting that this heatwave occurred after 18 months of a global pandemic. Social isolation is a known risk factor for heat-related deaths, and there is ample evidence that social isolation increased drastically during the pandemic, especially amongst older adults. It is likely, therefore, that the Covid-19 pandemic response primed the most at-risk population to be particularly susceptible to this extreme heat.
This heatwave also led to increased mortality of marine life on rocky intertidal shores.
The hottest days of the heatwave coincided with very low, early afternoon low tides throughout most of the Salish Sea (the inland waters of British Columbia and Washington state). The combination of strong early afternoon solar radiation and the extreme air temperatures resulted in surface temperatures in excess of 50C in the intertidal zone – shown by the yellow and white shading in the images below.
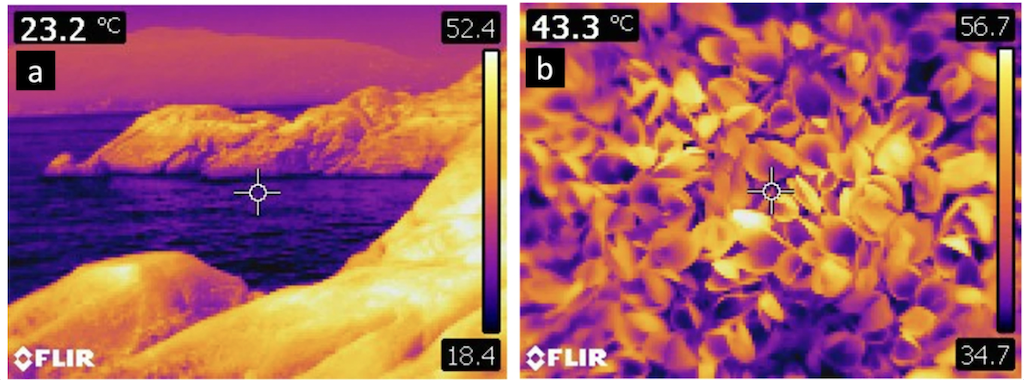
Surveys reported in our paper found that the extreme heat likely killed more than one million mussels on a 100-metre stretch of mussel-dominated shoreline, and around 10m barnacles along a single 100-metre stretch of barnacle-dominated intertidal habitat.
The total number of marine invertebrates killed was almost certainly in the billions.
Far-reaching impacts
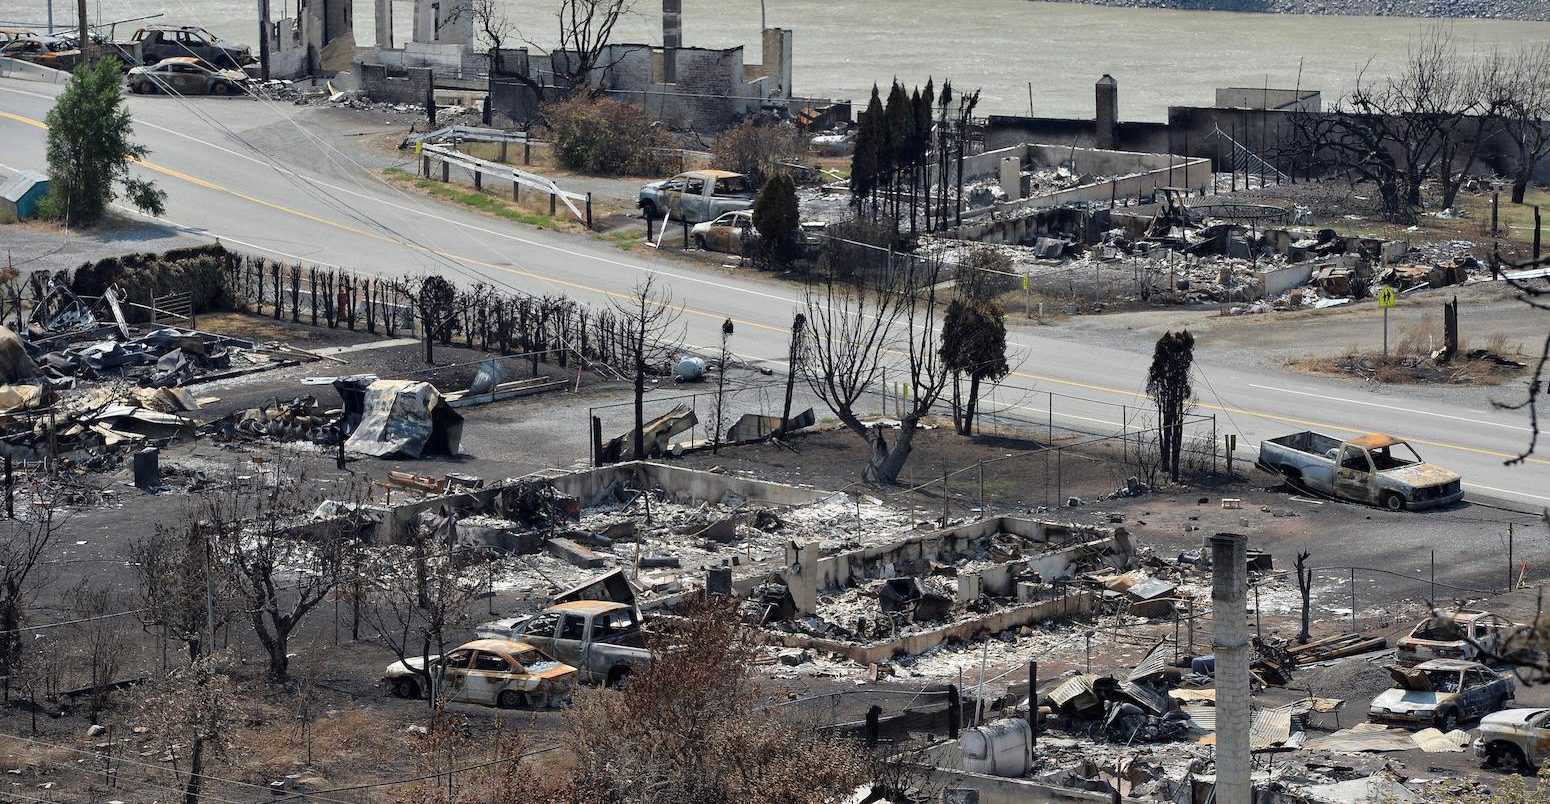
The heatwave’s persistent hot and dry conditions dried forest vegetation, resulting in extreme fire danger and increased wildfire activity.
The number of active wildfires in British Columbia leapt from just six on 20 June to 175 by 3 July – most of which were ignited by lightning.
Wildfires produce smoke particles and release water vapour from forest vegetation into the atmosphere, which, under particular atmospheric conditions, can produce clouds known as pyrocumulonimbus flammagenitus. Such clouds can produce lightning, providing ignition for more fires. The production of these clouds occurred frequently in British Columbia throughout the first week of July 2021, with an average of more than 48 new wildfires per day reported.
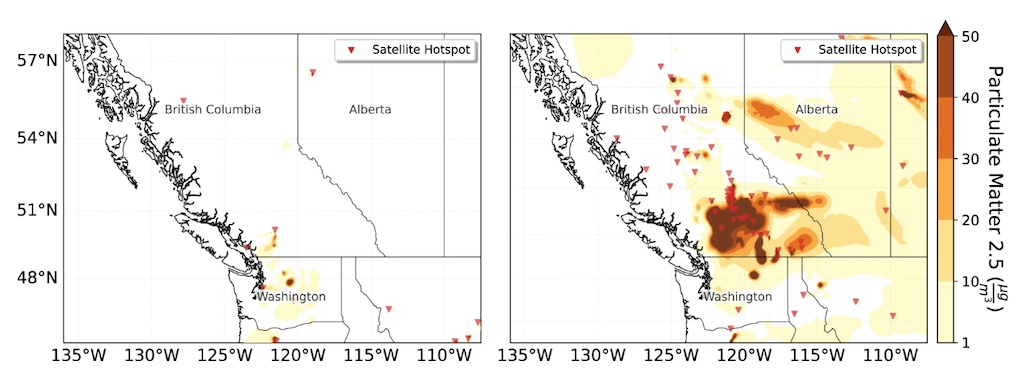
The maps below show the concentration of smoke from wildfires across the Pacific north-west below (left) and after (right) the heatwave. Deep red shading indicates the most intense smoke and red triangles show locations of probably wildfires.
As well as these immediate impacts, the heatwave had longer-term implications for crop yields, river flows and landslides.
The heatwave had pronounced impacts on agriculture in British Columbia and Alberta, notably occurring during crucial growing stages of many crops. Of the 26 crops we analysed, 24 showed decreases in 2021 relative to predicted yields – many by large margins when compared to normal year-to-year variability.
Attributing annual yield decreases to a particular event is difficult, as crops are impacted by conditions throughout many months. However, we do see noticeable drops in satellite-derived measurements of crop greenness during the heatwave. Combined with local reporting of immediate crop damages, this indicates that the heatwave played a substantial role in 2021 yield declines.
A pronounced impact on glaciers, snowpack and river flows was also seen both during the event and for months after. The exceptionally warm temperatures and clear sky conditions drove rapid ice and snow melt, leading to substantially increased flows in many river basins during the event. In many cases, daily record high flows were achieved, with some all-time records broken.
The high flows led to flood warnings for several communities and one evacuation order in British Columbia. For the remainder of the summer, river basins without substantial glacier coverage experienced lower-than-normal flows due to the loss of snowpack during the heatwave. River basins with large glaciers maintained near normal flows, at the expense of glacier mass loss.
In addition to the immediate impacts on human lives, wildfires can result in an increased risk of flooding, erosion and landslides, due to impacts on both vegetation and soil. Indeed, in regions strongly impacted by the 2021 wildfires in south-western British Columbia, we find that hundreds of debris flows were triggered by rainstorms in the summer and autumn of 2021.
The significant impacts of this extraordinary heatwave highlight the importance for regions to address the risks they face. Our findings draw attention to the need for jurisdictions that have not experienced a record-breaking heat event in recent decades to prepare now, before such a disaster hits locally.
And with extreme heatwaves expected to occur more frequently in a warming climate, cutting greenhouse gas emissions rapidly gives us the best chance of reducing the risk of experiencing unprecedented heat in the decades to come.

White, R. H. et al. (2023) The unprecedented Pacific north-west heatwave of June 2021, Nature Communications, DOI:10.1038/s41467-023-36289-3
-
Guest post: The causes and impacts of Pacific north-west’s brutal 2021 heatwave