
Guest post: What can climate models tell us about impacts at 1.5C and 2C?

Dr Rachel James
01.25.17Dr Rachel James
25.01.2017 | 5:21pmDr Rachel James is a research fellow at the Environmental Change Institute at the University of Oxford, specialising in climate modelling and African climate change.
The commitment enshrined in the Paris climate agreement to “pursue efforts” to limit global warming to 1.5C above preindustrial levels surprised many people, not least climate scientists.
As part of the outcomes from Paris, the UN’s official climate science body – the Intergovernmental Panel on Climate Change (IPCC) – was asked to produce a Special Report on 1.5C by 2018.
With less than two years to go, how much can scientists say about the impacts of 1.5C warming? How do the impacts compare to those at 2C? And given that limiting to 1.5C would be more difficult, is it worth it?
These questions pose quite a challenge. Until recently, there was very little research explicitly comparing impacts at discrete levels of warming. But while most existing model experiments were not designed to simulate 1.5C or 2C worlds, they can go some way to answering these questions. And new experiments are rapidly becoming available.
Our new review paper, published today in WIREs Climate Change, looks at the tools scientists have available to compare climate signals at different warming levels, where the field is headed next and how much can be done in time for the Special Report on 1.5C.
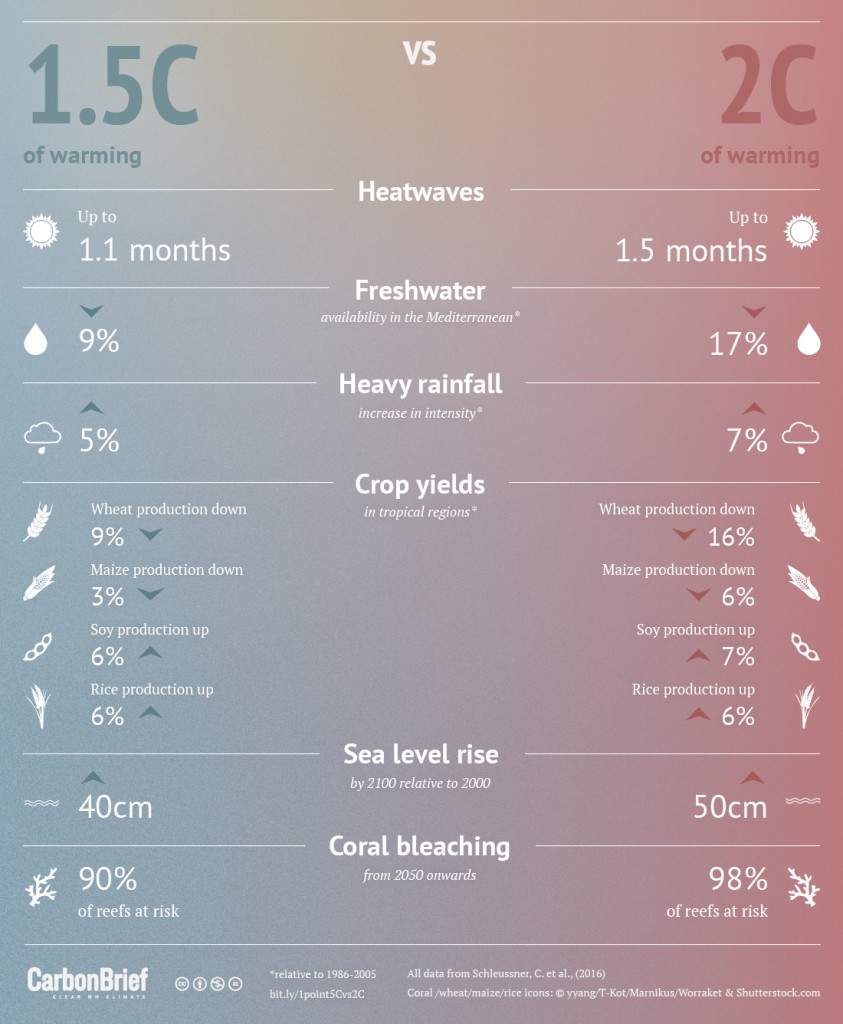
Infographic: How do the impacts of 1.5C of warming compare to 2C of warming? By Rosamund Pearce for Carbon Brief.
Standard approach
There are hundreds of scientists and research projects around the world working to investigate the potential consequences of climate change. The studies often rely on climate model experiments.
Here, we are talking about simulations with complex global climate models, which are used to explore future change in regional climate; often as a basis for assessing impacts on health, agriculture, ecosystems, infrastructure, water resources, and beyond.
More than twenty modelling centres around the world, such as the UK Met Office, run their models on supercomputers to test the climate’s response to human-caused greenhouse gases. Rather than base our conclusions on just one model, scientists try to consider as many as possible. The data from such experiments are available online, courtesy of the Coupled Model Intercomparison Project.
Usually, climate modelling centres run their experiments with the same set of scenarios for how greenhouse gases could evolve over the course of the century.
But as the figure below shows, the models generate quite different levels of global warming by the end of the 21st century for the same greenhouse gas forcing, ranging from 2C to more than 4C. This makes it difficult to estimate impacts at any one temperature level.
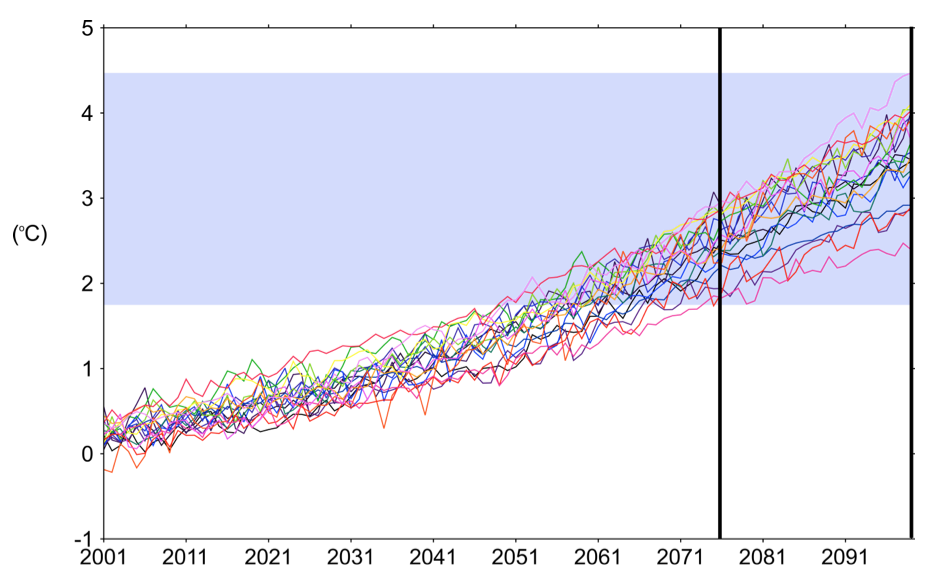
A group of model experiments sampled at 2075-2100 returns global warming ranging from less than 2C to more than 4C, making it difficult to infer impacts at any specific warming level. Source: James et al. (2016)
Another challenge is that until recently, many climate model scenarios tended to focus on what might happen if we keep emitting lots of CO2, and how we can adapt to a much warmer world. In the newest generation of model experiments, however, there has been more effort to directly model the impact of emission reductions.
The latest set of scenarios, called “Representative Concentration Pathways” or “RCPs” include a low greenhouse gas scenario called RCP2.6. Following this scenario gives us a “likely” (or 66%) chance that we can limit warming to 2C.
However, the multi-model spread in end-of-century warming under RCP2.6 ranges from 0.9C to 2.3C, which still doesn’t allow for easy comparison between 1.5C and 2C.
Scientists are developing a brand new RCP to explicitly investigate the implications of staying below 1.5C, representing even more ambitious mitigation. Unfortunately, these model runs will not be available in time for the IPCC’s Special Report.
So, what are the alternative approaches for investigating 1.5C and 2C?
Focusing on 1.5C and 2C
Scientists have used a number of methods to extract climate signals at specific warming levels from existing experiments. Whilst there are very few model runs which hold warming to below 1.5C or 2C, many of them cross those thresholds at some point in time. This allows scientists to compare the “transient” climate response at the point at which we pass 1.5C and 2C.
Studies so far that have used this approach to compare impacts at 1.5C and 2C of warming suggest that half a degree could make a very big difference. But there is significantly more we could do on this front. Most of the work so far to analyse the “transient” impact of different levels of warming do so for 2C and/or 4C, but not 1.5C.
In other words, we could quite quickly generate much more information about the initial response to 1.5C or 2C, just by analysing the data we already have.
One issue with this “transient” approach, however, is the limited number of years of data available at 1.5C and 2C. This makes it difficult to explore differences in extreme events, which are, by definition, rare. New model experiments are currently being run to generate large ensembles at 1.5C and 2C to try to address this problem.
These experiments are part of a project called HAPPI (Half a degree Additional warming, Prognosis and Projected Impacts), which aims to better understand extreme weather in a changing climate. Importantly, it looks like this new data source will be in time for studies to be included in the IPCC’s Special Report.
It gets more complicated, however, when we try to take into account the uncertainties associated with trying to stabilise or hold temperatures at 1.5C or 2C over long timescales.
The long term implications of 1.5C or 2C might vary, depending on the path taken to get there. As shown in the figure below, we could reach 2C or 1.5C very quickly (purple), or take much longer (red, yellow). Global temperature might also temporarily overshoot 1.5C or 2C before stabilising (blue).
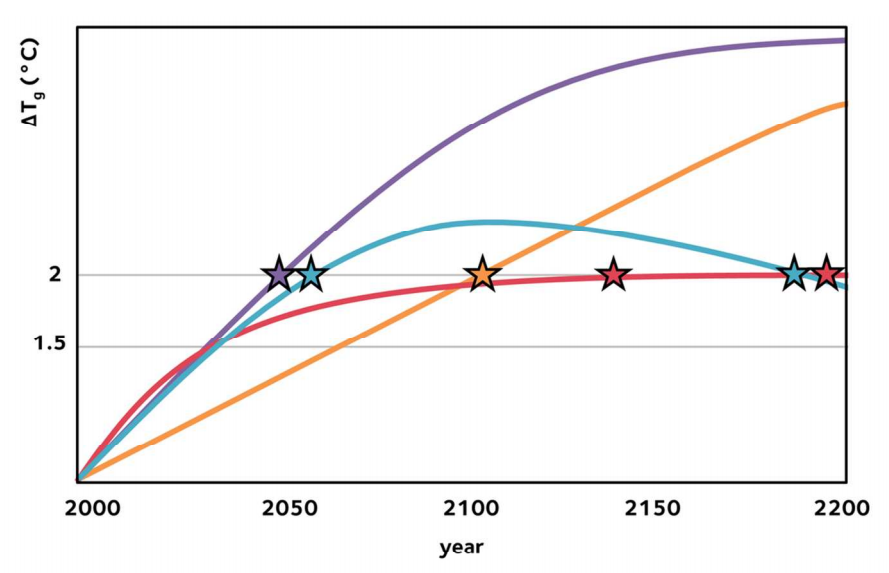
Hypothetical warming pathways. All reach 2C (shown by the stars) but might have different climate change impacts. Source: James et al. (2016)
We need to take the “pathway” into account because different routes to the end-goal could have distinct climate impacts. This is partly due to lags in the system: the climate will continue to respond to CO2 emissions for decades.
Reducing CO2 might itself have a distinct influence on the climate. Mitigating to 1.5C or 2C could require large scale changes in land use, such as afforestation, or growing crops for bioenergy, which could modify regional climate.
Finally, models might struggle to represent potential thresholds or “tipping points” in the climate system, such as the irreversible collapse of the Greenland Ice Sheet. Processes that can act to further amplify warming, such as permafrost thaw, may also be absent or incompletely represented. This is particularly pertinent if the triggers for such “tipping points” exist between 1.5C and 2C.
Looking forward
There are clearly a lot of uncertainties associated with modelling climate signals at 1.5C and 2C, and scientists are working with imperfect data sources, with a rapidly approaching deadline. The challenge is great, but our paper suggests a number of promising directions which might provide information in time for the IPCC Special Report.
With thanks to Dr Joeri Rogelj, Dr Carl-Friedrich Schleussner, Prof. Declan Conway, Prof. Richard Washington.
-
Guest post: What can climate models tell us about impacts at 1.5C and 2C?