Met Office: Why the UK saw record-breaking rainfall in February 2020

Dr Mark McCarthy
03.05.20Dr Mark McCarthy
05.03.2020 | 3:00pmFebruary 2020 was the UK’s wettest February on record in a series dating back to 1862. England, Wales and Northern Ireland all saw their wettest February on record, with Scotland seeing its second wettest.
Overall, the UK had 209.1mm of rain which is 237% of the average for February. This exceeds the previous record of 193.4mm set in February 1990.
Rainfall was more than twice the average quite widely across the regions. Some areas, including Lancashire and West Yorkshire, recorded more than three times the average and, locally, some areas saw more than four times their normal February rainfall.
It was also a notably mild February, particularly for southeast England. Overall, it was the 10th warmest for England and Wales, but closer to average for Scotland and Northern Ireland.
Below, I explain in detail why the UK experienced such extreme levels of rainfall last month, but first a summary:
- The extremely wet February of 2020 was a result of a strong and southward displaced jet stream and positive North Atlantic Oscillation. The associated strong north-south surface pressure gradient across the north Atlantic resulted in the UK being in a westerly regime and a succession of cyclonic systems that brought persistent and heavy rain to the UK.
- Named storms Ciara (7-8 February), Dennis (15-16 February) and Jorge (28-29 February) resulted in significant daily rainfall extremes for the UK and accounted for about 44% of the February rainfall total.
- In the current climate there is estimated to be a 34% probability of experiencing record-breaking rainfall in at least one month and one region of the UK during winter.
- Increases in winter rainfall and extremes have been observed in recent decades, but detecting climate-change signals in observations is challenging due to the high natural variability in UK winter rainfall.
- Using observational analysis and climate modelling in event-based attribution studies provides a growing body of evidence that climate change has increased and will further increase the probability of the UK experiencing such rainfall extremes.
- The latest UK climate projections (UKCP18) show a general trend toward wetter and milder winters. By 2070 for a high emissions scenario the mean winter rainfall could change by between -1% and +35%. Months with as much rainfall as February 2020 (237% of normal) are expected to become more frequent during the 21st century.
Record-breaking February
The chart below, left, shows just how extreme – and where – the rainfall was last month, relative to the average for the period from 1981 to 2010. Additionally, on the right, it shows the temperature anomaly.
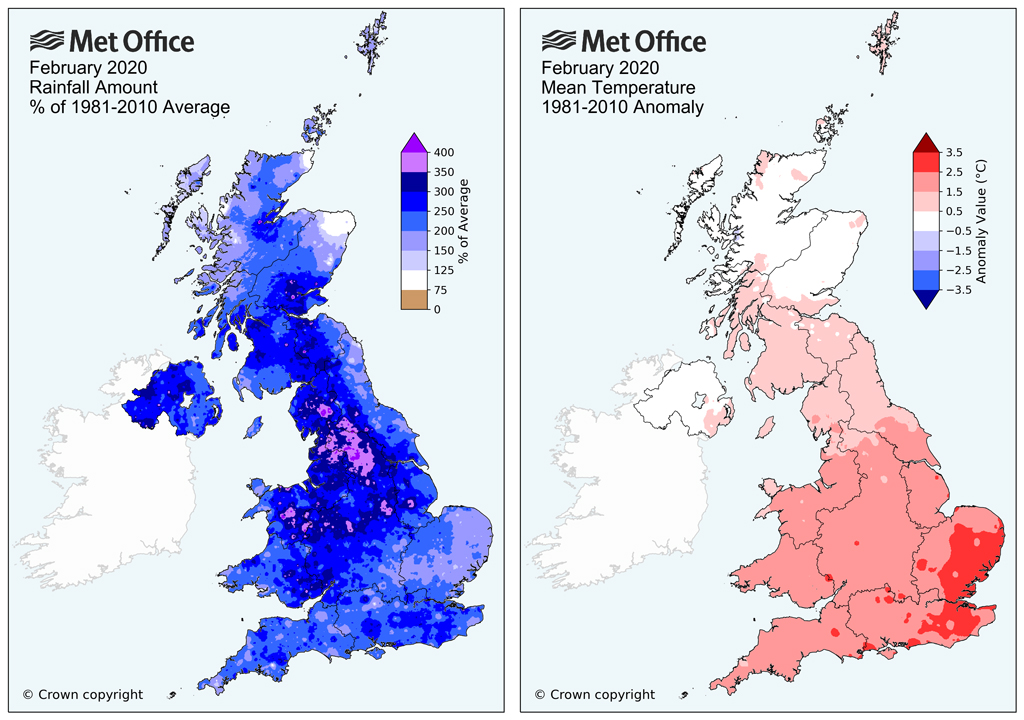
After a relatively dry spell for much of the first week of February, the weather became much more unsettled with persistent and, at times, heavy rain resulting from a succession of low-pressure systems crossing the UK.
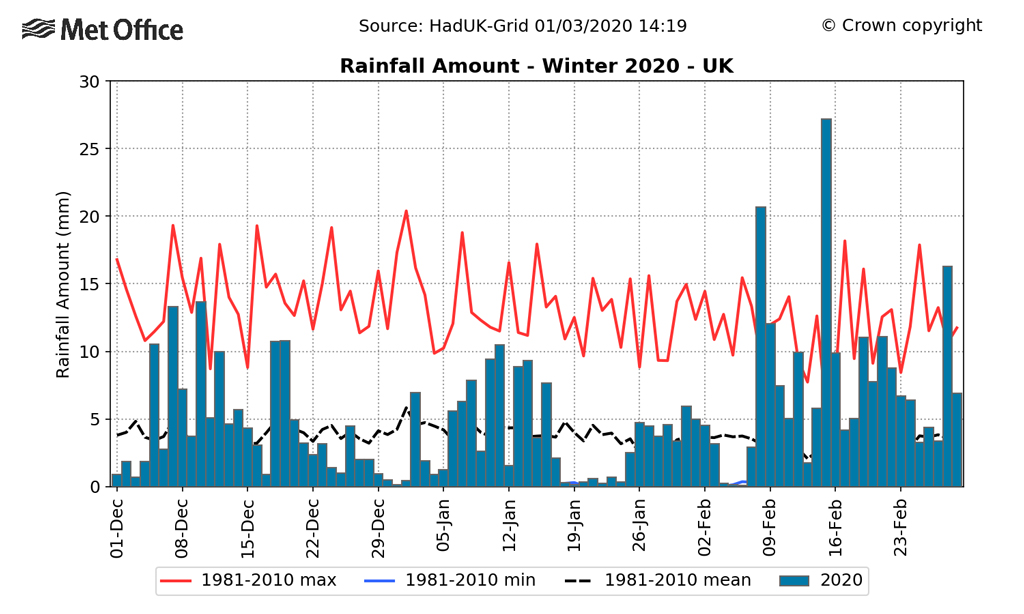
The chart below shows UK daily rainfall totals during winter 2019/2020, which highlights the particularly extreme peaks associated with the named storms Ciara (8-9 February) and Dennis (15-16 February).
An average accumulation of 27mm across the UK on 15th February (Dennis) was the second highest UK daily rainfall total in a Met Office series dating back to 1891, with the 21mm on 8th February (Ciara) was 31st highest (in more than 47,176 days of data).
Having two such widespread extreme rainfall events in the same calendar month is very rare. Storms Ciara, Dennis and Jorge account for just over 44% of the total rainfall during February 2020.
Large-scale circulation
The North Atlantic Oscillation (NAO), which refers to variations in the large-scale surface pressure gradient in the North Atlantic region, has been predominantly “positive” during winter 2019/20. This means that the north-south pressure gradient across the north Atlantic between the “Icelandic low” and the “Azores high” has been stronger than normal, putting the UK in a strong westerly flow regime.
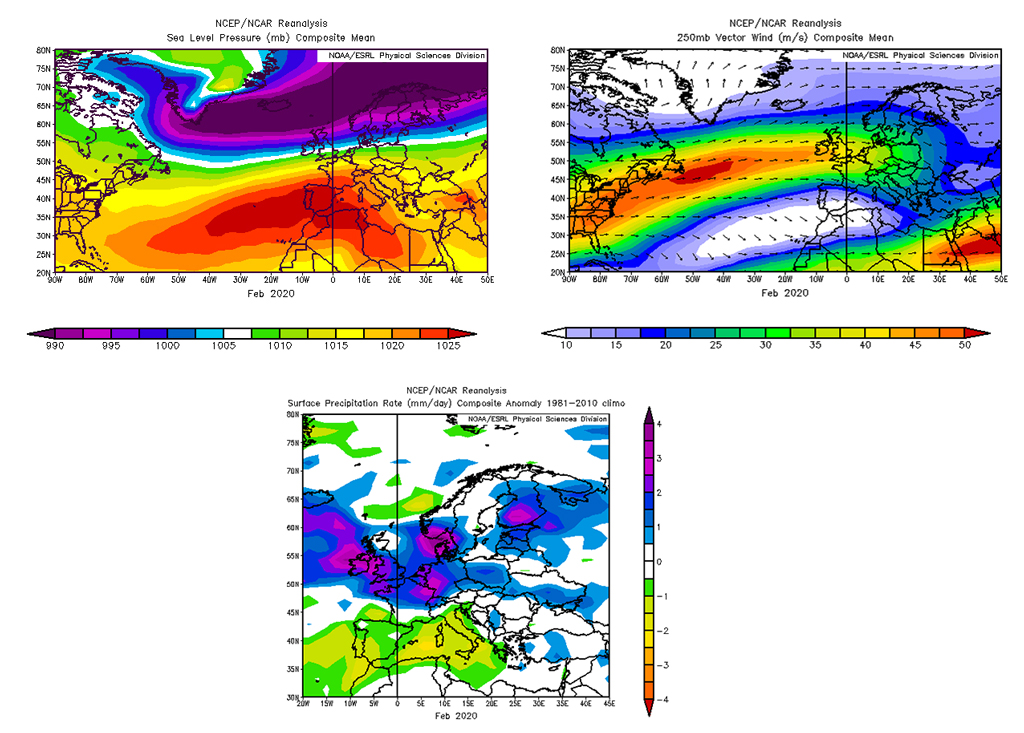
The upper level jet stream has also been much stronger than usual with a more southerly track, directing the north Atlantic storm track towards the UK and northern Europe. Both of these situations are summarised for February 2020 in the three figures below.
A positive NAO during winter is usually associated with wetter-than-normal conditions across northern Europe and drier-than-average conditions for southern Europe and the Mediterranean region, as the reanalysis in the figures below show has been the case for February 2020.
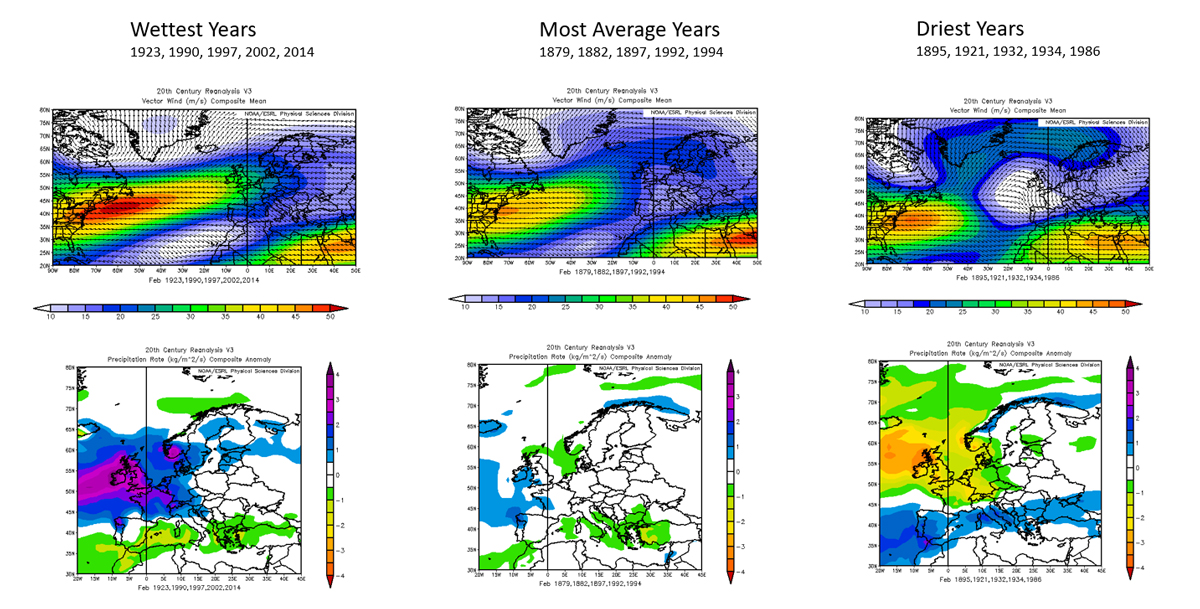
We can understand the context of the situation by looking at composites of past extremely wet and dry years. The figure below shows the north Atlantic jet stream (as 250hPa wind speeds) and European rainfall anomalies for three sets of composite years: the five wettest Februarys for the UK (1923, 1990, 1997, 2002 and 2014); the five driest Februarys (1895, 1921, 1932, 1934 and 1986); and the five years closest to the February rainfall average (1879, 1882, 1897, 1992 and 1994).
The “closest to average” set was used rather than a standard climatology (the formal reference climatology periods are 1961-1990 and 1981-2010), because the ‘closest to average’ provides a like-for-like comparison with the wet and dry composites.
During extremely wet years, the jet stream is stronger and follows a more southerly track across the UK than compared to the “average” composite. In the extreme dry years, the upper level circulation is “blocked” to the west of Europe. The extremely wet years have positive NAO with high rainfall across northern Europe and rainfall deficits in the south.
The figure below shows that the extreme dry years have the opposite spatial pattern for European rainfall. The atmospheric circulation during February 2020 is very similar in pattern and magnitude to other extreme wet February years.
Are UK winters getting wetter or stormier?
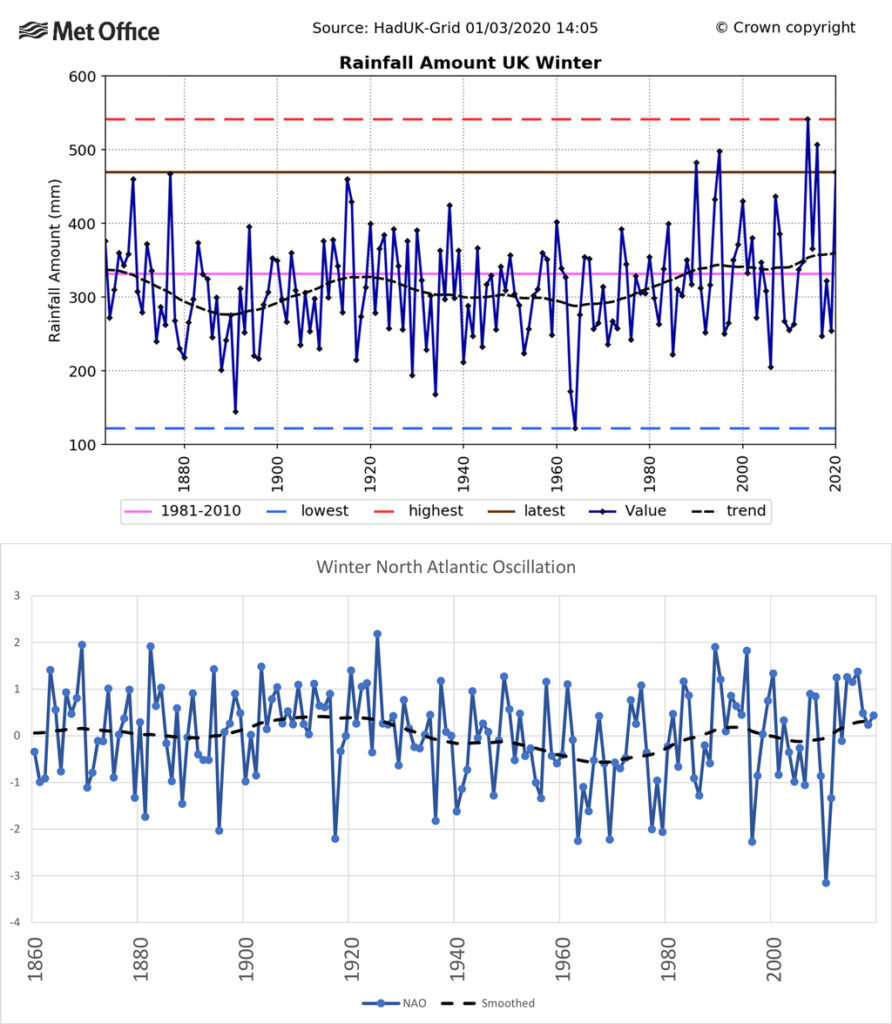
The figure below shows the winter mean rainfall for the UK from 1862 to present. For the most recent decade (2010-2019) winters have been 5% wetter than 1981-2010 and 12% wetter than 1961-1990.
Of the top ten wettest winters, four have occurred since 2007 and seven since 1990.
Associated with these changes we have also observed a 17% increase in the total rainfall from extremely wet days (pdf) and Kendon (2014) showed the 2010s contain more monthly to seasonal UK rainfall records than any other decade in the observational record.
However, rainfall changes are regionally dependent with the most marked increases for both mean and extreme rainfall being across western Scotland and very little or no apparent change for southern England. The upper panel of the figure below also highlights the large inter-annual and decadal variability in UK winter rainfall that can make robust detection of long term trends in UK rainfall challenging.
The character of the UK’s winter climate can be summarised using an index of the North Atlantic Oscillation. Positive values are associated with generally milder, wetter and stormier winters, and negative values with colder, drier and calmer ones. The lower panel of the figure below shows a time series of winter NAO. This shows that some proportion of the decadal variability in UK winter rainfall is associated with decadal variability in the NAO.
A cluster of very significant daily, monthly and seasonal rainfall national scale extremes have occurred in the most recent decade including the extreme wet winters of 2013/14 and 2015/16. The latter included storm Desmond that recorded the highest 24-hour rainfall total on record for the UK of 341.4mm on 5 December 2015 at Honister Pass (Cumbria).
A number of more localised records have also been set with a number of counties including south Yorkshire, Nottinghamshire and Lincolnshire having their wettest autumn on record in 2019.
Present-day risk of extreme rainfall
A study by Thompson et al (2017) used a large ensemble of high-resolution climate simulations to estimate the likelihood of unprecedented rainfall events for the UK – known as the “UNSEEN” method. The initialised set of simulations can be used to create a much larger sample of pseudo-events than available from the historical climate record. These can be used to capture plausible, but not observed, extreme events that are based on realistic meteorological conditions. This analysis concluded:
“There is a 34% probability of an unprecedented winter monthly rainfall total in at least one month in at least one region — it is, therefore, likely that we will see unprecedented winter rainfall within the UK in the next few years.”
This represents a significant natural hazard arising from UK climate, affecting the level of risk exposure to large-scale flooding and the associated impacts. This result is based on an ensemble of initialised simulations, which means that they will include representation of both natural variability and recent climate change within that estimate. Although Thompson et al also note that, because the analysis is based on the historical climate of 1980-2015, it could be underestimating the contribution of climate change on the present day.
The high variability of UK rainfall means that trends in regional rainfall at the scale of the UK resulting directly from anthropogenic climate change are not expected to be detectable in the observational record at this time (Sarojini et al, 2016).
This is also the case for shorter duration extremes (Kendon et al, 2019). However there is a growing body of evidence using a combination of observations and climate models to draw on to estimate how climate change is influencing the likelihood of certain types of extreme events.
Christidis and Stott (2015) analysed extreme winter rainfall predicated on the circulation patterns of the extreme wet winter of 2013/14. They documented a weak shift to increased risk of 10-day rainfall extremes by a factor of about seven in the present-day climate, as a consequence of anthropogenic climate change.
This result is conditional on the synoptic conditions of that winter, so the quantitative result would be expected to differ if the study were repeated for other observed extreme events. But it is reasonable to consider the findings indicative that climate change has increased the risk of winter rainfall extremes. Christidis and Stott also found some evidence for an increasing trend in the frequency of having atmospheric circulation patterns like those in 2013/14.
Otto et al (2018) used observational data, global and regional climate model simulations to estimate the impact of climate change on the likelihood of extreme rainfall events, such as that which affected northern England and Scotland in December 2015. They conclude a best estimate that climate change increases the risk of such extreme rainfall events by approximately 59%. However, this has large uncertainty range spanning 0% to 250% and is strongly dependent on the definition of the “event”.
In all these studies the use of climate models is essential to quantify these probabilities which would not be possible from the observations alone. For attribution of the role of climate change in particular events, the quantitative estimates are very specific to the event studied.
However, these studies contribute to a growing body of evidence that extreme rainfall is a significant risk factor for the UK and that climate change has increased the likelihood of extreme rainfall events.
Future risk
A general increase in winter rainfall and projection of warmer, wetter winters has been a consistent result from past sets of UK climate projections. This is also true for the latest UK Climate Projections (UKCP18; Lowe et al, 2018) for which the probabilistic projections suggest the 10th-90th percentile range of changes in winter rainfall by 2070s for a high emissions scenario are in the range of -1% to +35%.
Climate change could also affect UK winter weather by influencing the NAO and or climatological jet stream. One of the strands of evidence in UKCP18 (Murphy et al, 2018) did show an increased occurrence of NAO positive weather types under climate change, but this was not replicated in other ensembles used within the project and therefore remains an area of some uncertainty.
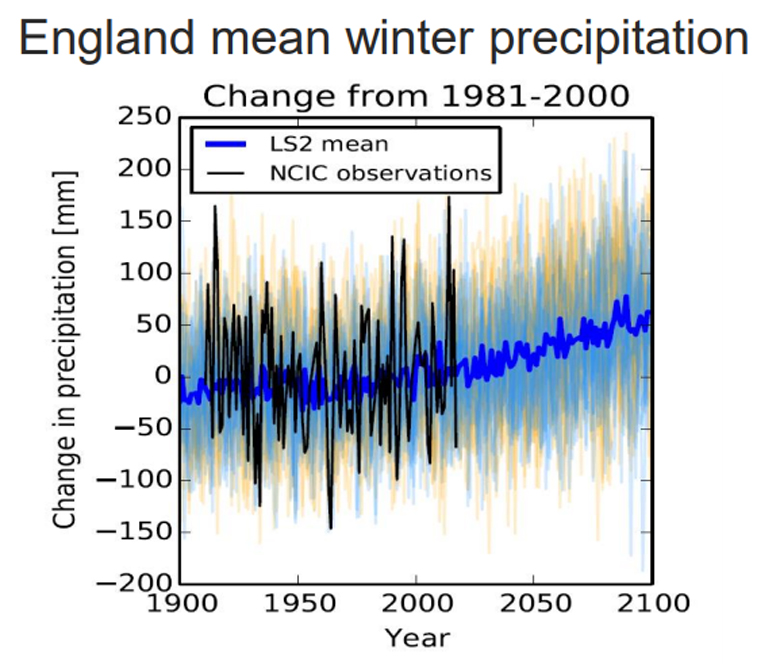
The ensemble of data shown in the figure above demonstrates that variability in UK rainfall is large relative to the projected changes.
However, extreme wet winters are expected to increase in severity in the future. This means that winters comparable to present-day extremes, such as February 2020, are expected to become more common in the future. But dry winters will also still occur and so this means that the UK will need to adapt to a wider range of climate conditions in the future.
Acknowledgements: The author thanks the following Met Office colleagues who contributed to this article either directly or through related discussions (but any errors are the authors own): Nikos Christidis, Paul Davies, Nick Dunstone, Mike Kendon, Albert Klein-Tank, Jason Lowe, Grahame Madge, Carol McSweeney, Nick Rayner, Adam Scaife, David Sexton.
References
Christidis, N. and P.A. Stott, 2015. Extreme rainfall in the United Kingdom during winter 2013/14: The role of atmospheric circulation and climate change, Bulletin of the American Met. Soc. https://doi.org/10.1175/BAMS-D-15-00094.1
Kendon, M. (2014), Has there been a recent increase in UK weather records?. Weather, 69: 327-332. https://doi.org/10.1002/wea.2439
Kendon, M, McCarthy, M, Jevrejeva, S, Matthews, A, Legg, T. State of the UK climate 2018. Int J Climatol. 2019; 39 ( Suppl. 1): 1– 55. https://doi.org/10.1002/joc.6213
Lowe, J. et al. 2018. UKCP18 Science overview report. https://www.metoffice.gov.uk/pub/data/weather/uk/ukcp18/science-reports/UKCP18-Overview-report.pdf
Murphy, J. et al. 2018: UKCP18 Land projections: Science report https://www.metoffice.gov.uk/pub/data/weather/uk/ukcp18/science-reports/UKCP18-Land-report.pdf
Otto, F.E.L et al 2018 Climate change increases the probability of heavy rains in Northern England/Southern Scotland like those of storm Desmond—a real-time event attribution revisited. Environ. Res. Lett. 13 024006 https://iopscience.iop.org/article/10.1088/1748-9326/aa9663/meta
Sarojini, B., Stott, P. & Black, E. Detection and attribution of human influence on regional precipitation. Nature Clim Change 6, 669–675 (2016). https://doi.org/10.1038/nclimate2976
Thompson, V., Dunstone, N.J., Scaife, A.A. et al. High risk of unprecedented UK rainfall in the current climate. Nat Commun 8, 107 (2017). https://doi.org/10.1038/s41467-017-00275-3