New NASA videos show stark ice loss from Earth’s ice sheets
Roz Pidcock
08.27.15The US space agency, NASA, yesterday released brand new images showing the pace of ice loss from Earth’s two vast ice sheets, Greenland and Antarctica.
The amount of ice lost from the frozen expanses at the very north and south of the planet is accelerating, say the scientists, and together have helped raise global sea level by more than 7cm since 1992.
Greenland
The Greenland ice sheet covers approximately 1.7m square kilometres (660,000 square miles), an area almost as big as Alaska. At its thickest point, the ice sitting on top of the land is more than 3km deep.
Since 2004, Greenland has been losing an average of 303bn tonnes of ice every year, according to NASA data, with the rate of loss accelerating by 31bn tonnes per year every year.
In the animation below, red shows areas that have lost ice, blue shows areas that have gained ice.
Change in the mass of the Greenland Ice Sheet between January 2004 and June 2014, as measured by the GRACE satellite. Source: NASA Goddard’s Scientific Visualization Studio.
Some of the ice lost from Greenland is as result of the huge glaciers melting. But most of it is down to warming air overhead directly melting the surface of the ice sheet. A NASA press release accompanying yesterday’s data explains:
“Greenland’s summer melt season now lasts 70 days longer than it did in the early 1970s. Every summer, warmer air temperatures cause melt over about half of the surface of the ice sheet – although recently, 2012 saw an extreme event where 97% of the ice sheet experienced melt at its top layer.”
Greenland officially reaches the end of the summer melt season next week, when scientists will be able to say how 2015 has compared with previous years in terms of the speed of ice loss.
Changing ocean currents and temperatures are also melting the Greenland ice sheet from the bottom up, scientists say. A new three-year NASA project called Oceans Melting Greenland (OMG ) aims to get a better handle on how the rate of ice loss compares to surface melting.
Antarctica
Covering nearly 14m square kilometres (5.4m square miles), Antarctica is more than eight times the area of Greenland. The continent is also losing ice, though less quickly than its northern counterpart. Antarctica has lost, on average, 118bn tonnes of ice per year since 2004, compared to Greenland’s 303bn tonnes.
Change in the mass of the Antarctic Ice Sheet between January 2004 and June 2014, as measured by the GRACE satellite. Source: NASA Goddard’s Scientific Visualization Studio.
The biggest cause of ice loss is warmer water melting the ice shelves that protrude from the ice sheet over the ocean. As the ice shelves erode, they lose their buttressing effect and the glaciers stacked up behind them are free to flow into the ocean.
The Larsen-B ice shelf on the Antarctic Peninsula collapsed in 2002, releasing more than 3,200 square kilometres (1,250 square miles) of ice in the space of a month, say NASA scientists. Recent research suggests the Larsen-C ice shelf is at risk of following suit.
West Antarctica grabbed the headlines last year when scientists discovered glaciers in the Amundsen bay were already collapsing. The process was likely to be unstoppable, said scientists, potentially adding several metres to sea levels over the course of many centuries.
Sea level rising
As ice on land melts, it raises global sea levels. On top of the contribution from melting ice sheets and glaciers, sea water expands as it gets warmer, raising sea levels further still.
NASA scientists have been measuring the height of the surface of the ocean in detail since 1992, first with the Topex/Poseidon satellite and later with its successors, Jason-1 and -2.
Together with the GRACE satellites and the ARGO network of more than 3,000 ocean sensors, scientists now have a good idea of how sea levels are changing.
Globally, sea level has risen by about 19cm since the start of the 20th century, 7.4cm in the last 20 years alone. About a third of that is from warming water, the rest from melting land ice, say the NASA scientists.
But sea level rise doesn’t happen at the same speed everywhere. A third new video from NASA below shows how sea level has changed in different parts of the world since 1992. Red is where sea level has risen, blue is where it has fallen.
How sea level has changed over the last two decades as observed by the Jason series of satellite missions. Source: NASA’s Jet Propulsion Laboratory.
Differences in sea level rise from one place to another are largely down to ocean currents and natural cycles such El Niño and the Pacific Decadal Oscillation, explains Josh Willis, oceanographer at NASA’s Jet Propulsion Laboratory and chief scientist behind the coming Jason-3 satellite mission.
But that looks set to change, he says. Scientists predict meltwater from ice sheets will overtake natural cycles to become the most significant contributor to overall sea level change.
Our Future
So, how much more can we expect sea levels to rise?
Steve Nerem, head of NASA’s sea level team, says what we’ve seen so far from the ice sheets is just the beginning. He says:
“Given what we know now about how the ocean expands as it warms and how ice sheets and glaciers are adding water to the seas, it’s pretty certain we are locked into at least 3 feet [91cm] of sea level rise and probably more.”
The question is whether it will happen over the course of this century or longer, says Nerem.
This is at the upper end of the range of 52-98cm by 2100 put forward in the latest report from the Intergovernmental Panel on Climate Change (IPCC) in 2013, assuming emissions stay very high (RCP8.5). But if the ice sheets collapse altogether, we can expect a lot more than that, says Tom Wagner, scientist at NASA Headquarters in Washington. He says:
“We’ve seen from the paleoclimate record that sea level rise of as much as 10 feet [3m] in a century or two is possible, if the ice sheets fall apart rapidly.”
Scientists have a lot more information about Earth’s ice sheets now than they did a decade or so ago.
As well as the GRACE satellites, the Ice Cloud and land Elevation Satellite (ICESat) ran from 2003 and 2009, using laser pulses to help map changes in the height of the polar ice sheets. ICESat-2 is scheduled for launch in 2017.
The European Space Agency’s Cryosat-2 satellite measures how fast glaciers are moving, as well as height of the ice sheet. NASA’s Operation IceBridge is a series of airborne surveys aimed at better understand ice thickness across the ice sheets. But there’s still more to do, says Wagner:
“We’re seeing evidence that the ice sheets are waking up, but we need to understand them better before we can say we’re in a new era of rapid ice loss.”
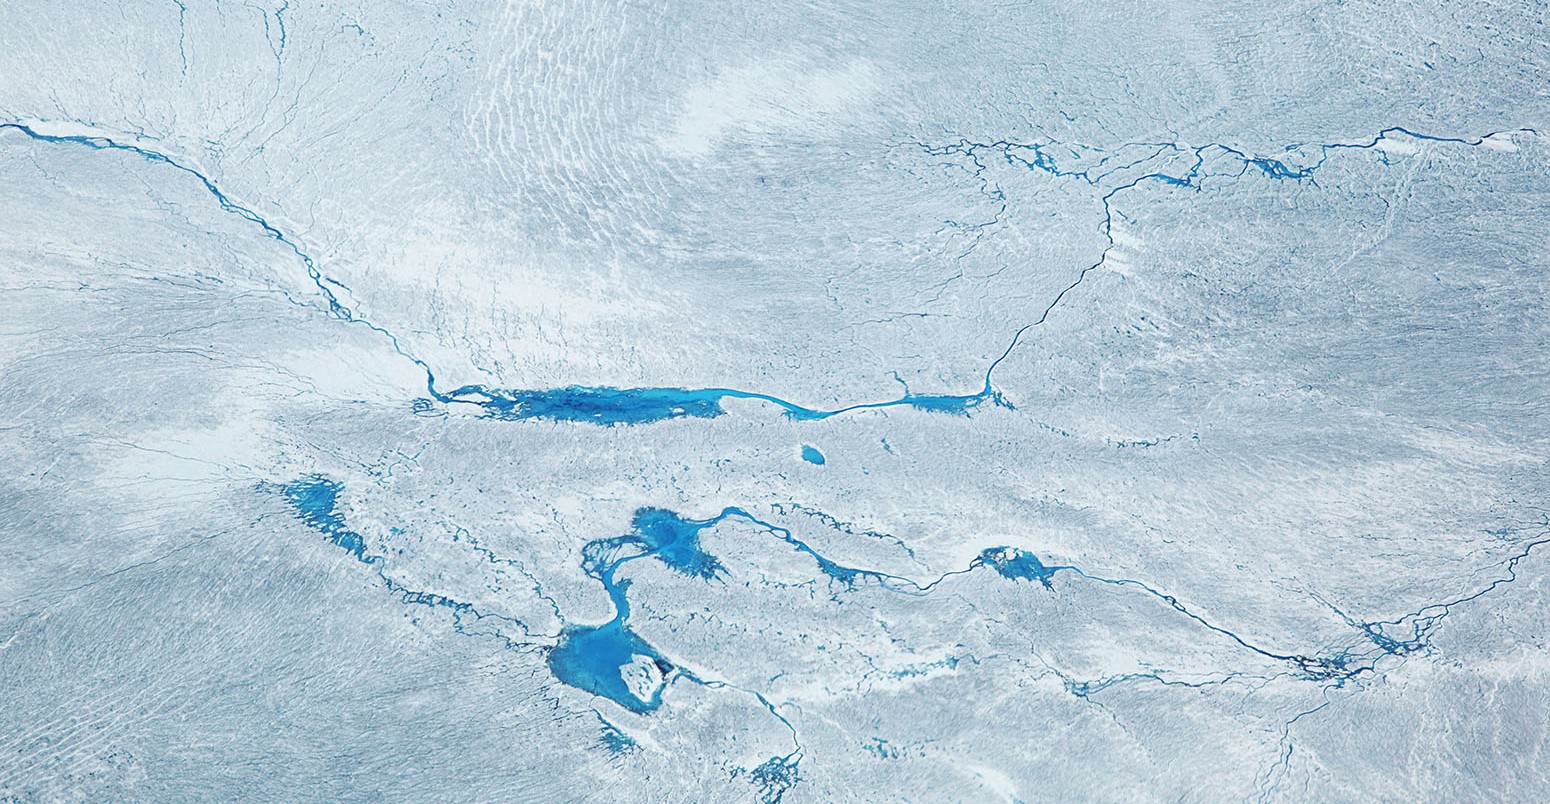
Main image: Glacial lakes over the ice sheet in Greenland.
-
Take a look at these brand new images showing the pace of ice loss from Earth's two vast ice sheets, Greenland and Antarctica - NASA