New satellite maps reveal hidden intricacies of Greenland ice loss and sea level rise
Greenland lost enough ice between 2003 and 2009 to raise sea levels by more than four centimetres, according to new research that maps the vast ice sheet in unprecedented detail.
Scientists have used satellites to measure ice loss at nearly 100,000 locations, concluding that the Greenland ice sheet is far more complicated that it’s often assumed to be. And that means projections of how much we can expect sea levels to rise need updating. Between 2003 and 2009, Greenland lost about 243 billion tonnes of ice a year, adding 0.68 millimetres to sea levels annually, the research finds. Almost half the ice lost came from Southeast Greenland.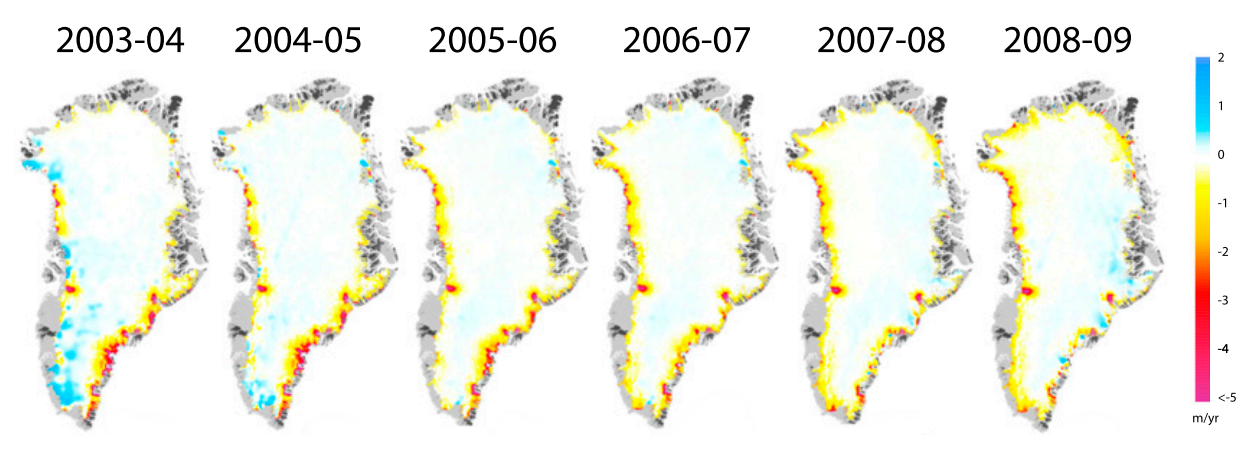
Annual total ice loss from the Greenland ice sheet between 2003 and 2009. Source: Csatho et al., (2014)
Satellite measurementsThe new study uses information collected by lasers mounted on satellites to reconstruct a detailed map of the height of the Greenland ice sheet. It combines data from a series of NASA satellites, including the first stage of Iceat and the ongoing IceBridge mission.
Combining all the different datasets means today’s study is the most detailed reconstruction to date of ice sheet elevation, the paper says. The scientists compared measurements over several years to see how the ice thickness changed.
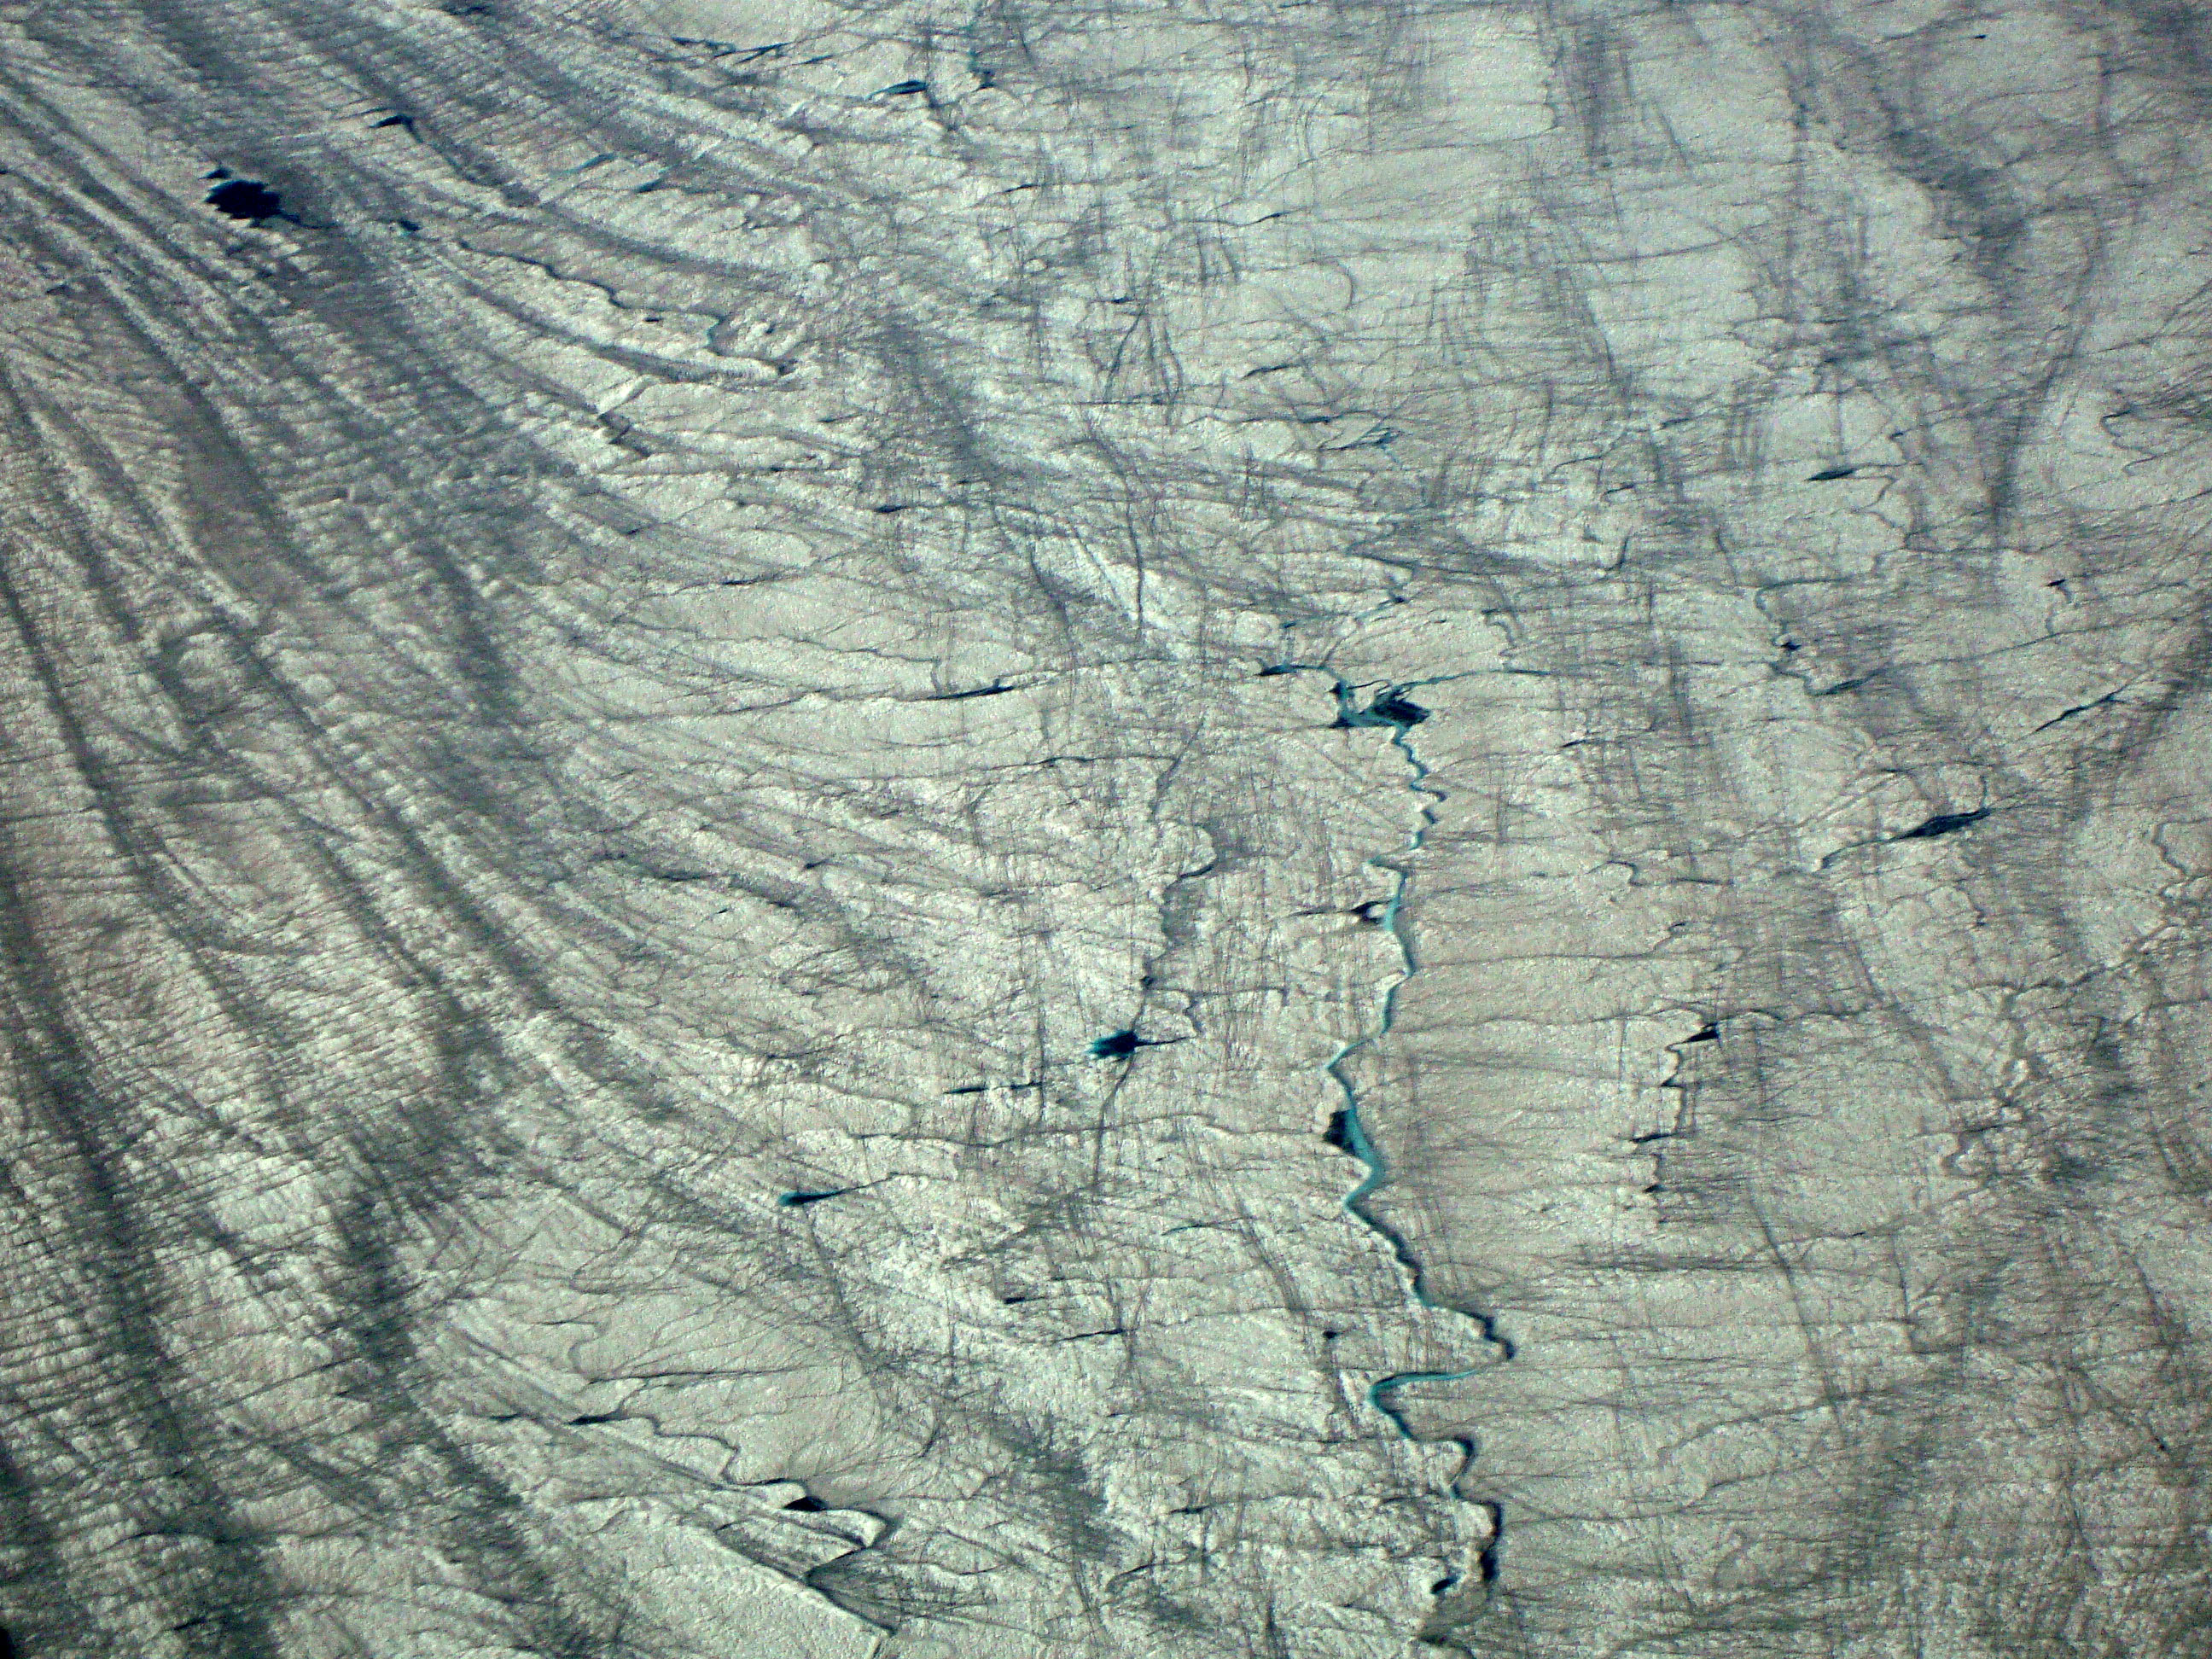
The surface of the Greenland Ice Sheet. Source: Beata Csatho
The researchers found that just under half the total ice lost from the Greenland ice sheet between 2003 and 2009 was through “dynamic” processes like iceberg calving, where large chunks of ice break off the ice sheet into the sea.Most glaciers running off the ice sheet have been losing mass in the last decade, the data shows. But while climate change is partly to blame, how a glacier behaves from one year to the next is mostly determined by local conditions including the shape of the ground underneath the glacier, the paper finds.
By mapping the ice sheet, the researchers found very large differences between individual glaciers – even ones located close together. Some glaciers lost mass overall but experienced periods where the speed of thinning slowed down or reversed, meaning the ice temporarily grew thicker. When South Greenland was losing ice most rapidly (2003 to 2005), the southwest part of the ice sheet was actually getting thicker, for example.
This complicated behaviour has consequences for climate projections, say the researchers.
The latest report from the Intergovernmental Panel on Climate Change (IPCC) projected ice loss from the Greenland ice sheet would contribute 14 to 85 millimeters to sea level rise by 2100. But the report acknowledged that uncertainty over the complex ways in which ice could be lost meant such projections were still at “a fairly early stage”.In fact, the IPCC assessment of how much dynamic processes like calving will be affected by further warming are based on observations at just four major glaciers. Given the big differences the authors of today’s paper found between different glaciers, this might not be an approach that works that well. The paper notes:
“[C]onsidering the complexity of recent behaviour of outlet glaciers it is far from clear how four well-studied glaciers represent all of Greenland’s outlet glaciers and whether their response can be scaled up to the entire ice sheet.”
An uncertain future
There’s little reason to suggest what we’ve seen happen at those four main glaciers will continue into the future, the researchers say.
A separate satellite study using a slightly different approach recently estimated Greenland lost 263 billion tonnes of ice each year between 2005 and 2010, raising sea levels by about 0.73 millimetres per year. The previous estimate agrees well with the new reconstruction. But while those authors also concluded dynamic processes such as calving contributed roughly the same amount to ice loss over the period as surface melting, but that won’t necessarily continue to be the case in the coming century and beyond, today’s paper suggests.Today’s research paints a picture of an extremely complicated system. Sea level rise projections come with a degree of uncertainty because such complexity has long been suspected, if not fully understood. It looks like the most up to date satellite information bears that out, highlighting the need for more detailed observations across more of the ice sheet.
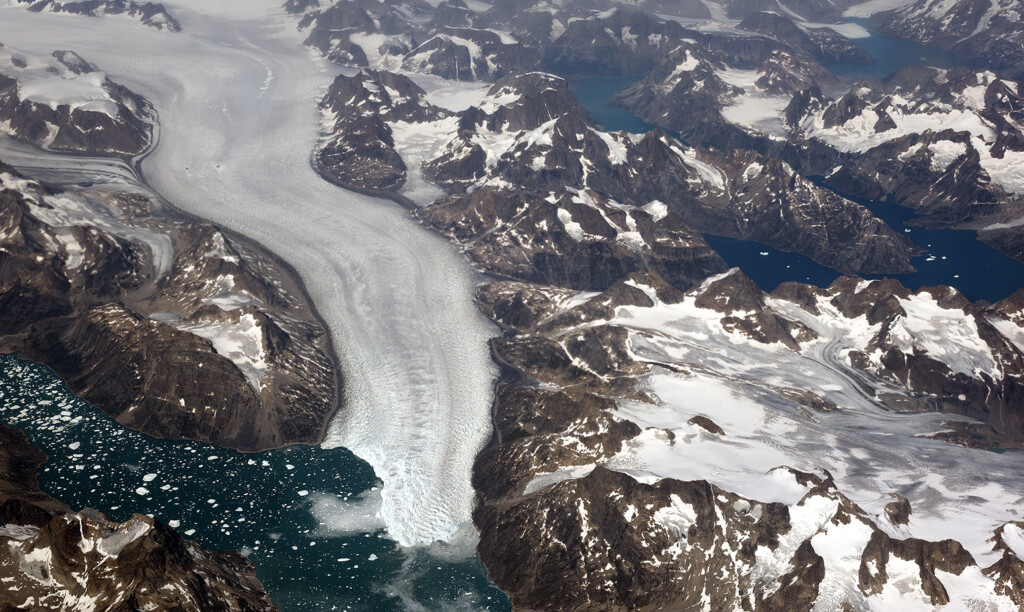
Main image: Aerial view of glacier and snow covered mountains in Greenland. Credit: Josef Hanus/Shutterstock.com.
Article information
Source: Csatho, B. M. et al., (2014) Laser altimetry reveals complex pattern of Greenland Ice Sheet Dynamics. Proceedings of the National Academy of Sciences. Doi:10.1073/pnas.1411680112