State of the climate: 2022 on track for a summer of extreme heat
Zeke Hausfather
07.25.22Zeke Hausfather
25.07.2022 | 4:25pmThe summer of 2022 is shaping up to be a scorcher. June 2022 saw the warmest temperatures on record over the world’s land areas – and record–breaking heatwaves have swept across the northern hemisphere, particularly continental Europe, the UK, China and parts of the US.
Summer warmth notwithstanding, 2022 is still on track to likely be the fifth warmest year on record in most datasets, though it could be as high as the second or as low as the eighth depending on how temperatures develop in the remaining six months of the year.
Global temperatures are being pushed down due to a persistent “double dip” La Niña event that has brought cooler ocean waters to the surface in the tropical Pacific. However, even with 2022 not setting a new record, the world will have experienced its eight warmest years on record in the past eight years.
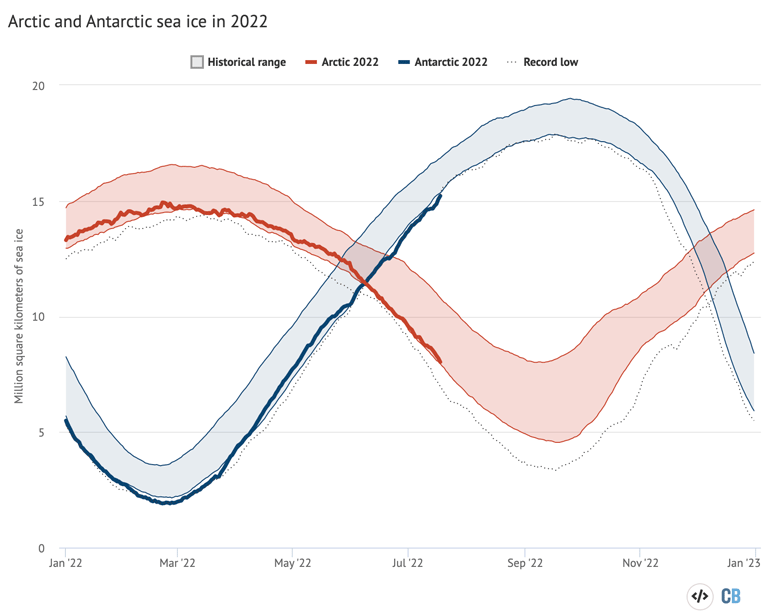
Antarctic sea ice has been at record low levels for the first quarter of the year, as well as nearly all of the month of July, while Arctic sea ice extent has tracked the low end of the historical range.
Exceptional heatwaves
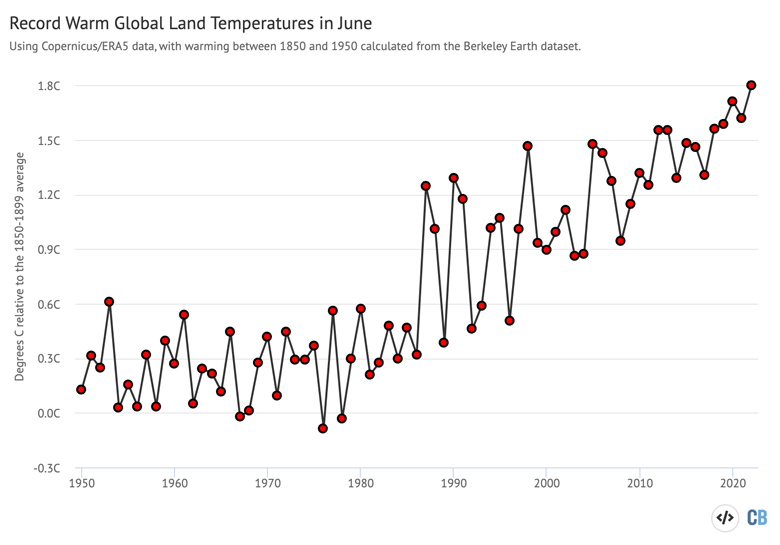
While climate scientists often focus on global average temperature changes, no one lives in the global average. Land temperatures can be more representative of the climate changes most people experience and, on land, June 2022 saw the warmest temperatures since records began in the late 1850s.
The figure below shows global land temperatures for the month of June from 1950 to 2022 in the Copernicus/ECMWF ERA5 dataset. June 2022 was around 1.8C warmer than pre-industrial (1850-1899) temperatures, with the vast majority of that warming occurring over the past few decades. June land temperatures have risen by more than 1.5C since the early 1980s.
While full monthly July 2022 temperatures are not available at time of publication, July has seen exceptional heatwaves in Europe, China, and the US among other regions.
The UK smashed its prior all-time high temperature record by 1.6C, reaching 40.3C. Across most of Europe, temperatures reached between 40C and 43C, with Hamburg in Germany passing 40C for the first time. The figure below shows the locations that broke daily, monthly or all-time record highs across Europe on 19 July.
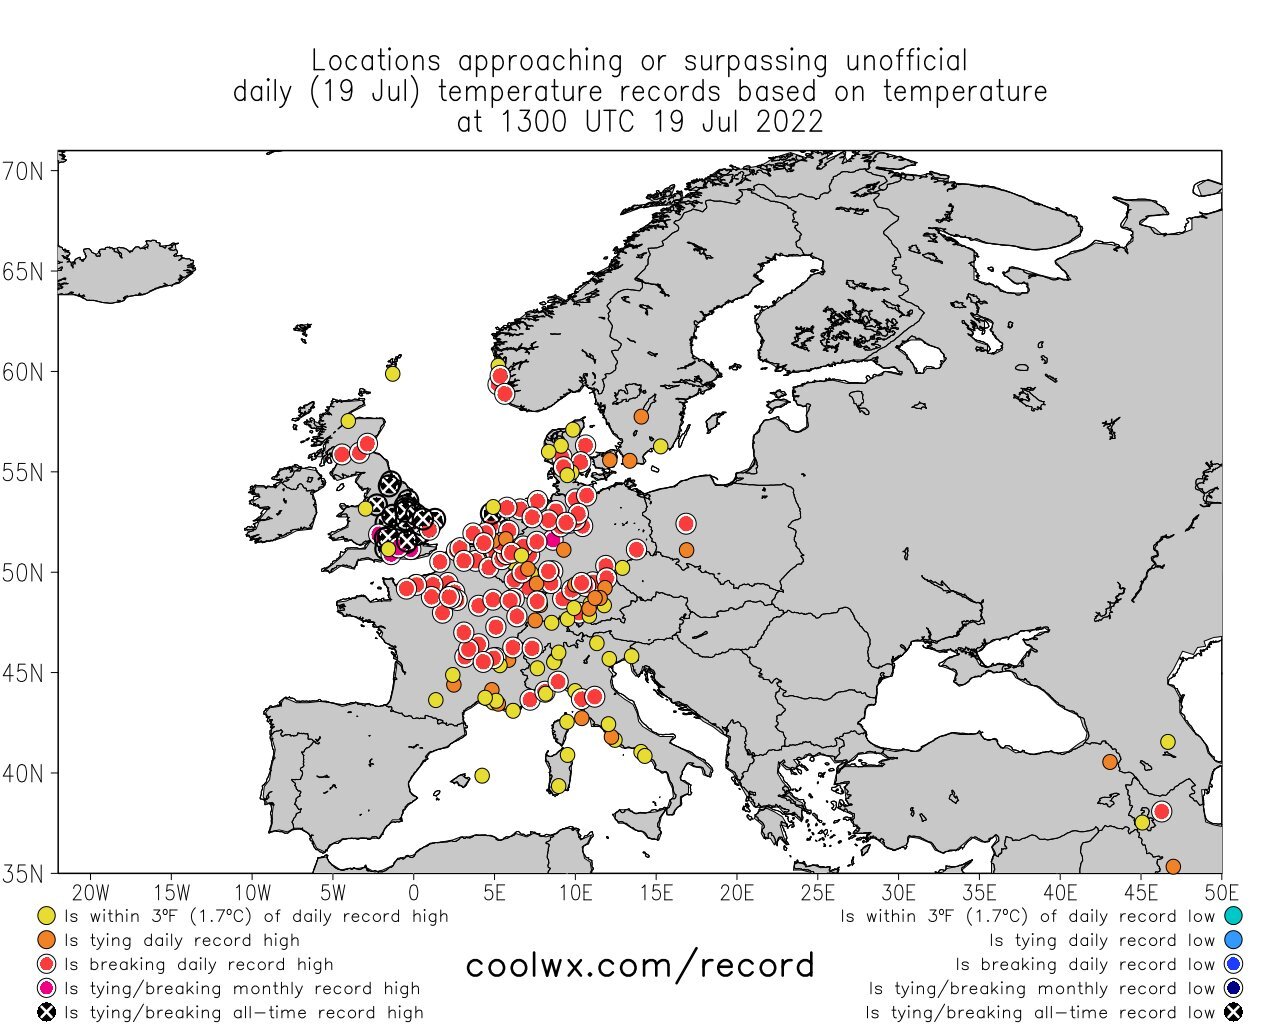
In the UK, the July heat set new record high daily maxima and minima for England, Scotland and Wales. In total, six sites in the UK saw temperatures of 40C or more, and 46 sites provisionally surpassed the previous record of 38.7C.
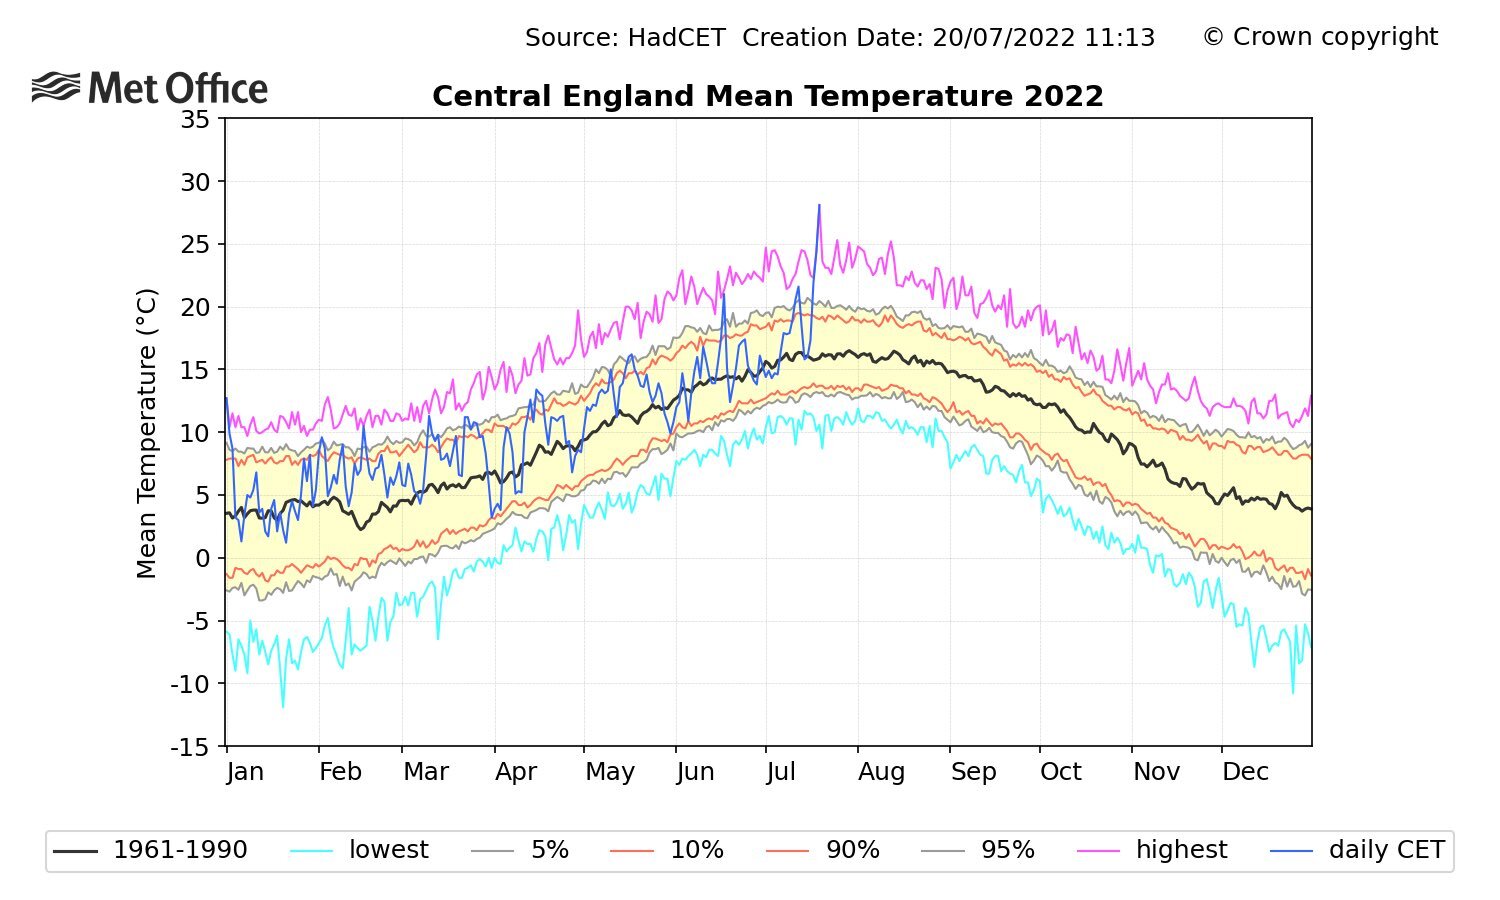
The heatwave also saw the UK have its hottest day ever in terms of daily average temperature. The blue line in the figure below, from Prof Ed Hawkins, shows the temperatures on 19 July spike in temperatures in the context of the world’s longest instrumental temperature record – the Hadley Centre Central England Temperature (HadCET) – which has daily average temperature observations every day back to 1772.
China also saw extreme heat in July, with temperatures over 40C in Shanghai leading to officials issuing a rare “red alert”. Only 17 red alerts have been issued since 1873, with three of those issued so far this summer. China also experienced record electricity demand across the entire country due to high demand from air conditioners.
The US has not escaped the extreme heat; around 60 million Americans in at least 16 states experienced temperatures above 38C (100F) on 21 July, and more than 100 million people were under heat alerts.
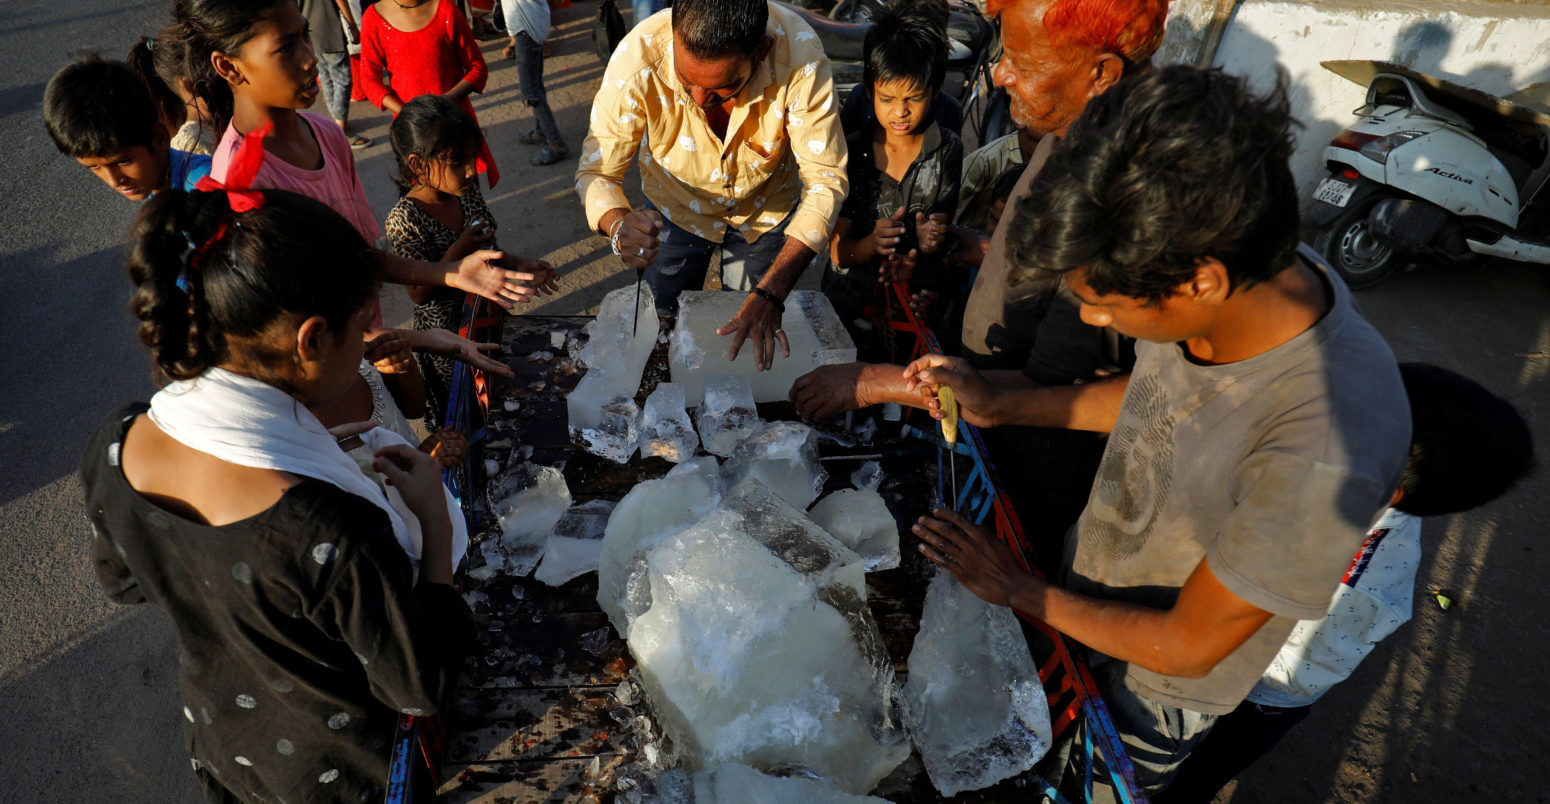
Earlier in the year, India and Pakistan experienced a heatwave remarkable both in its severity and its persistence. High temperatures lasted from March through May and broke many all-time high daily records in both countries. Analysis by researchers at the World Weather Attribution group, published in May, found that the heat wave was made at least 30 times more likely due to climate change.
Likely fifth warmest year on record
Carbon Brief has analysed records from six different research groups that report global surface temperature records: NASA; NOAA; Met Office Hadley Centre/UEA; Berkeley Earth; and Copernicus/ECMWF. The table below shows the ranking of months in 2022 compared to the same month in all prior years since records began.
| HadCRUT5 | NASA | NOAA | Berkeley | ERA5 | |
|---|---|---|---|---|---|
| Jan | 6th | 6th | 6th | 6th | 6th |
| Feb | 9th | 6th | 7th | 8th | 6th |
| Mar | 5th | 5th | 5th | 5th | 5th |
| April | 7th | 7th | 6th | 7th | 6th |
| May | 5th | 6th | 10th | 6th | 6th |
| Jun | 1st (tied) | 6th | 2nd | 3rd |
The first six months of 2022 were generally around the fifth or sixth warmest on record. However, June was notably warmer, tying for the warmest on record globally (not just over land) in the NASA dataset, and coming in as the second and third warmest on record in the Berkeley and ERA5 datasets, respectively. It was only the sixth warmest June in the NOAA record, perhaps reflecting the absence of coverage of parts of the Arctic in that dataset.
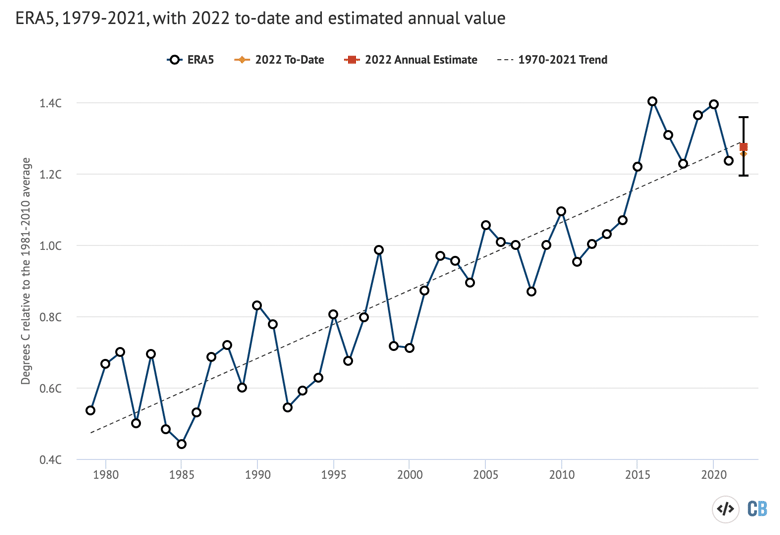
The chart below compares the annual global surface temperatures from these different groups since 1970. The coloured lines show the temperature for each year, while the dots on the right-hand side show the year-to-date estimate for January to June 2022 (or January to May the Hadley/UEA dataset, for which June values were not available at the time this article was published).
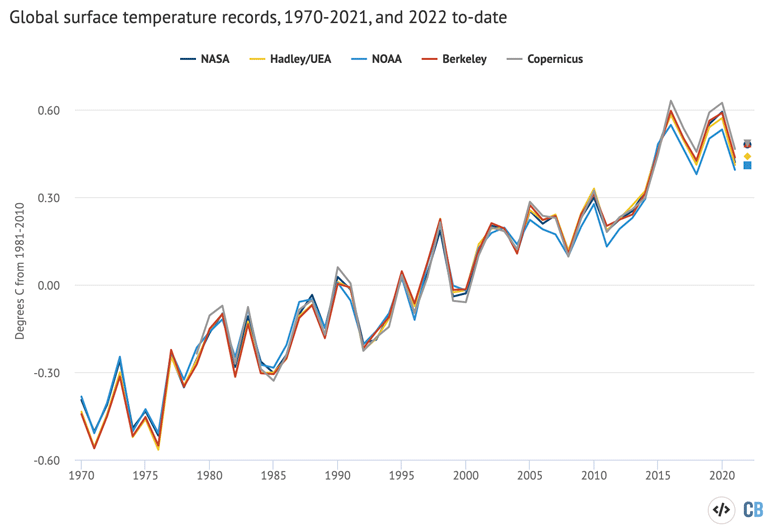
Values are shown relative to a common baseline period – the 1981-2010 average temperature for each series – to more accurately compare them over the past few decades. Surface temperature records have shown around 0.9C warming since the year 1970, a warming rate of between 0.18C and 0.2C per decade, depending on the dataset.
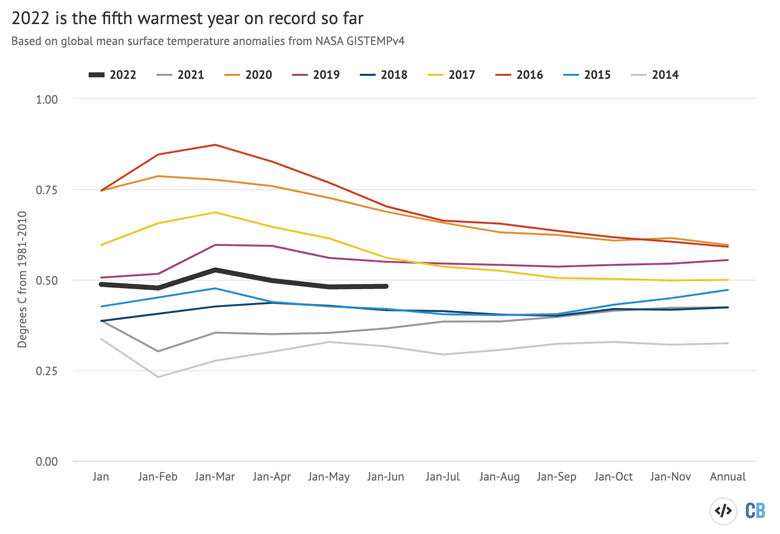
The figure below shows how temperatures so far in 2022 (black line) compare to prior years (grey lines) in the NASA GISTEMP dataset. It shows the temperature of the year-to-date for each month of the year, from January through to the full annual average. In the NASA dataset, 2022 is the fifth warmest year on record so far, cooler than four of the years in the past decade but warmer than any other year since records began.
While human emissions of CO2 and other greenhouse gases are responsible for all of the Earth’s long-term warming, temperatures in any given year are strongly influenced by short-term variations in the Earth’s climate that are typically associated with El Niño and La Niña events (collectively referred to as ENSO). These fluctuations in temperature between the ocean and atmosphere in the tropical Pacific help make some individual years warmer and some cooler.
The first half of 2022 saw a double-dip La Niña, with cool conditions returning to the tropical Pacific after returning to neutral conditions in the second half of 2021. This persistent La Niña contributed to temperatures being a bit lower than they otherwise would be. Predictions from models for the remainder of the year mostly project continuing modest La Niña conditions, with ENSO-neutral conditions only expected by early 2023..
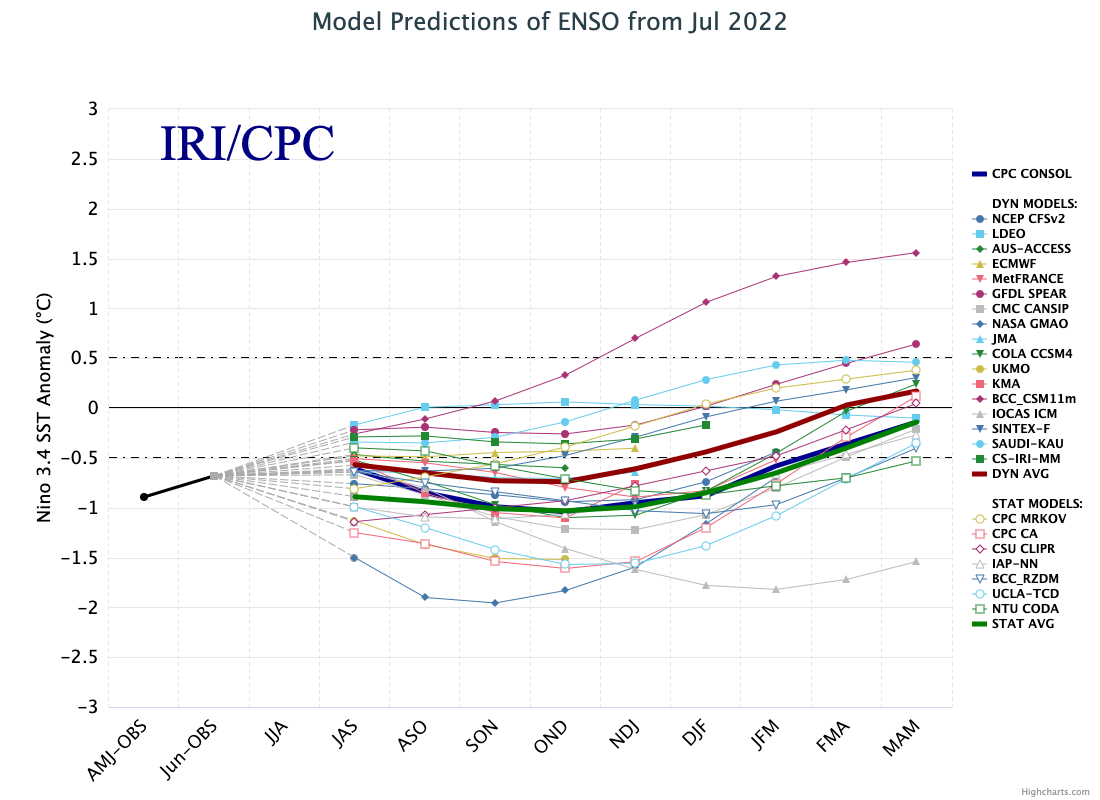
The figure below shows a range of different ENSO forecast models produced by different scientific groups. The values shown are sea surface temperature variations in the tropical Pacific – the El Niño 3.4 region – for three-month periods. The dynamical model average is shown in red, while that for statistical models is shown in green.
Tracking climate model projections
Climate models provide physics-based projections of warming given different assumptions about future emissions, greenhouse gas concentrations and other climate-influencing factors.
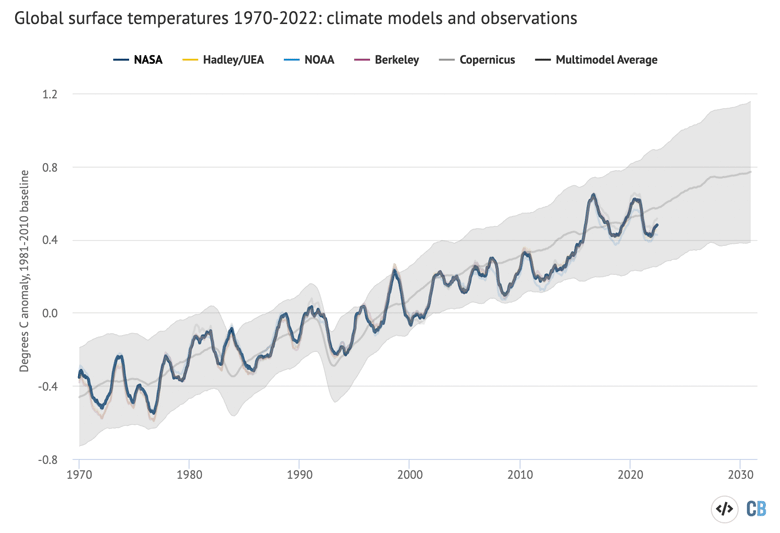
The figure below shows the range of individual models forecasts featured in the Intergovernmental Panel on Climate Change’s (IPCC) fifth assessment report – known collectively as the CMIP5 models – between 1970 and 2020. The black line and grey shading indicate the average projection and spread, respectively, across all the models. Individual observational temperature records are represented by coloured lines.
In these models, estimates of temperatures prior to 2005 are a “hindcast” using known past climate influences, while temperatures projected after 2005 are a “forecast” based on an estimate of how things might change.
The latest generation of models – CMIP6 – are not compared to observations in this state of the climate report. The most recent report from the IPCC’s sixth assessment report (AR6) has changed the way that the ensemble of models is used. Rather than simply taking the average of all the models (and their range) – as was the case in previous IPCC reports – the IPCC decided to use a weighted subset of models that agreed well with historical observations. This also reflected a narrowing of climate sensitivity in the most recent IPCC report – such that a number of new models fall outside the “very likely” sensitivity range.
While the IPCC AR6 provided a new set of future “assessed warming” projections, these start in the year 2015, which makes comparisons with observations over such a short period not very informative. A recent commentary in Nature (led by the author of this article) suggested an alternative approach to assessing CMIP6 models in a way consistent with AR6 assessed warming, and that approach will be employed in future updates.
Record low Antarctic sea ice
Arctic sea ice extent the first half of 2022 has been at the low end of the historical 1979-2010 range, but only came close to setting a new record daily low in early March and mid-June.
Antarctic sea ice, on the other hand, was at or near record lows for all the first third of the year and, more recently, for the month of July. Late February saw the lowest Antarctic sea ice extent since records began, though the degree to which this was driven by climate change remains unclear given the lack of a clear long-term trend in the region – unlike in the Arctic, where sea ice declines are clearly driven by warming.
The figure below shows both Arctic and Antarctic sea ice extent in 2022 (solid red and blue lines), the historical range in the record between 1979 and 2010 (shaded areas) and the record lows (dotted black line). Unlike global temperature records (which only report monthly averages), sea ice data is collected and updated on a daily basis, allowing sea ice extent to be viewed through to the present.
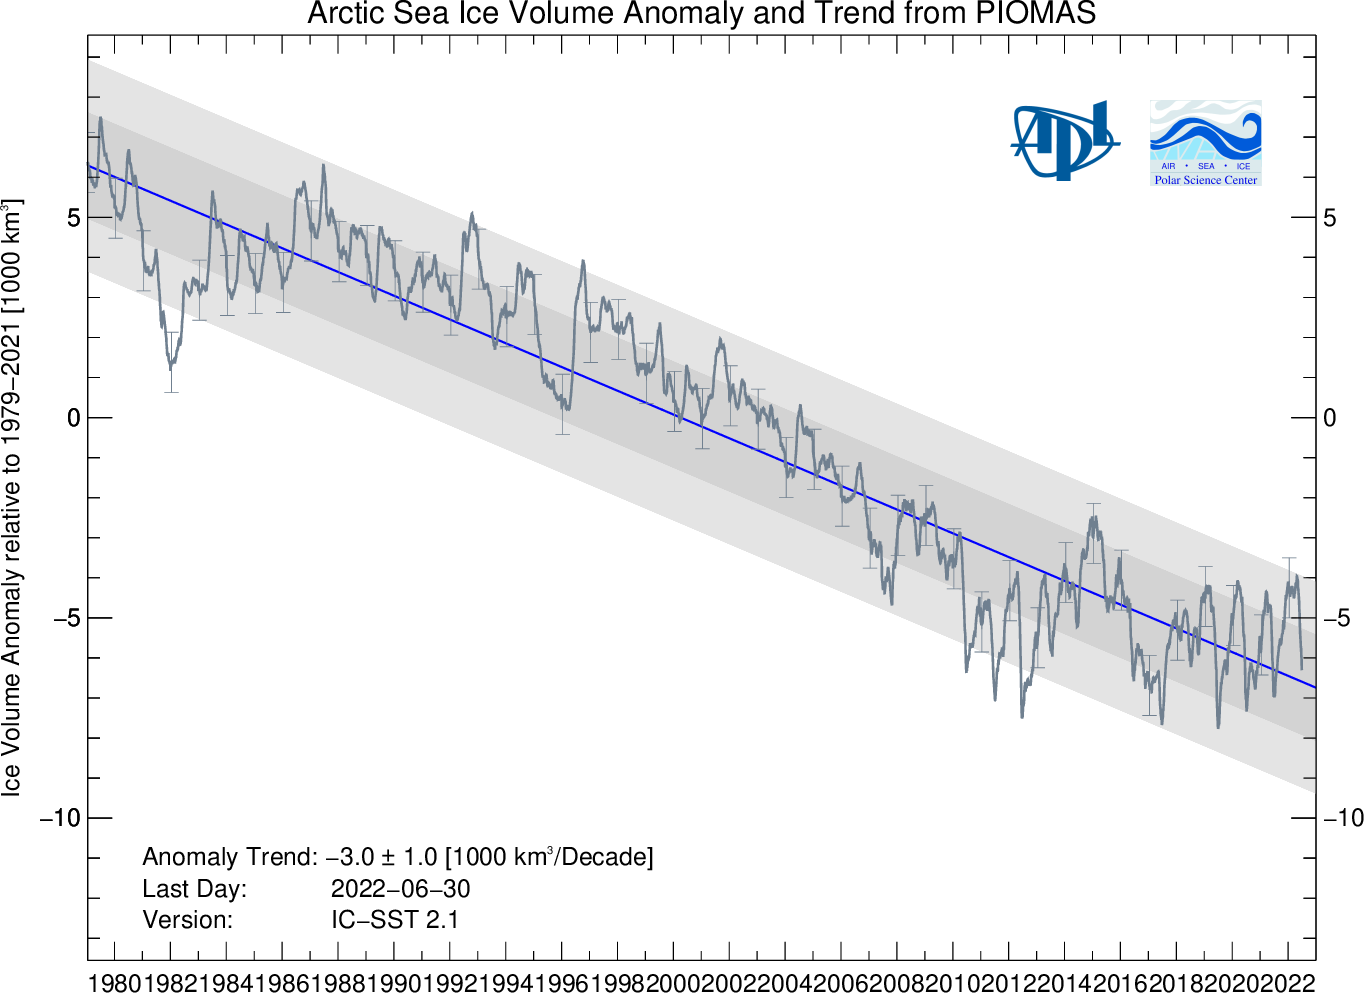
Sea ice extent only tells part of the story. In addition to declining ice extent, the sea ice that remains tends to be younger and thinner than ice that used to cover the region. The figure below, using data from the Pan-Arctic Ice Ocean Modelling and Assimilation System (PIOMAS), shows the Arctic sea ice thickness for every year between 1979 and 2022.
Where will 2022 end up?
The first half of 2022 can give some sense of what to expect for the entire year. By looking at the relationship between the first quarter and the annual temperatures for every year since 1979 – as well as ENSO conditions for the first three months of the year and projected conditions for the remaining months – Carbon Brief has created a projection of what the final global average temperature for 2022 will likely turn out to be.
The analysis includes the estimated uncertainty in 2022 outcomes, given that temperatures from only the first half of the year are available so far.
This estimate is a bit higher than the Carbon Brief assessment after the first three months of the year, reflecting the relatively warm June temperatures. The projection suggests that 2022 has the best chance of ending up as somewhere between the fourth and eighth warmest year on record, with a best estimate of fifth. Annual temperatures are likely to be nearly spot on what would be expected based on the long-term warming trend since 1979 – which is shown by the dashed line in the figure.
Carbon Brief provided a similar estimate of where 2022 temperatures would end up at the start of the year, prior to any 2022 monthly temperature data becoming available. The figure below shows this initial estimate, as well as ones made when each month of the year (January-June) was first available.
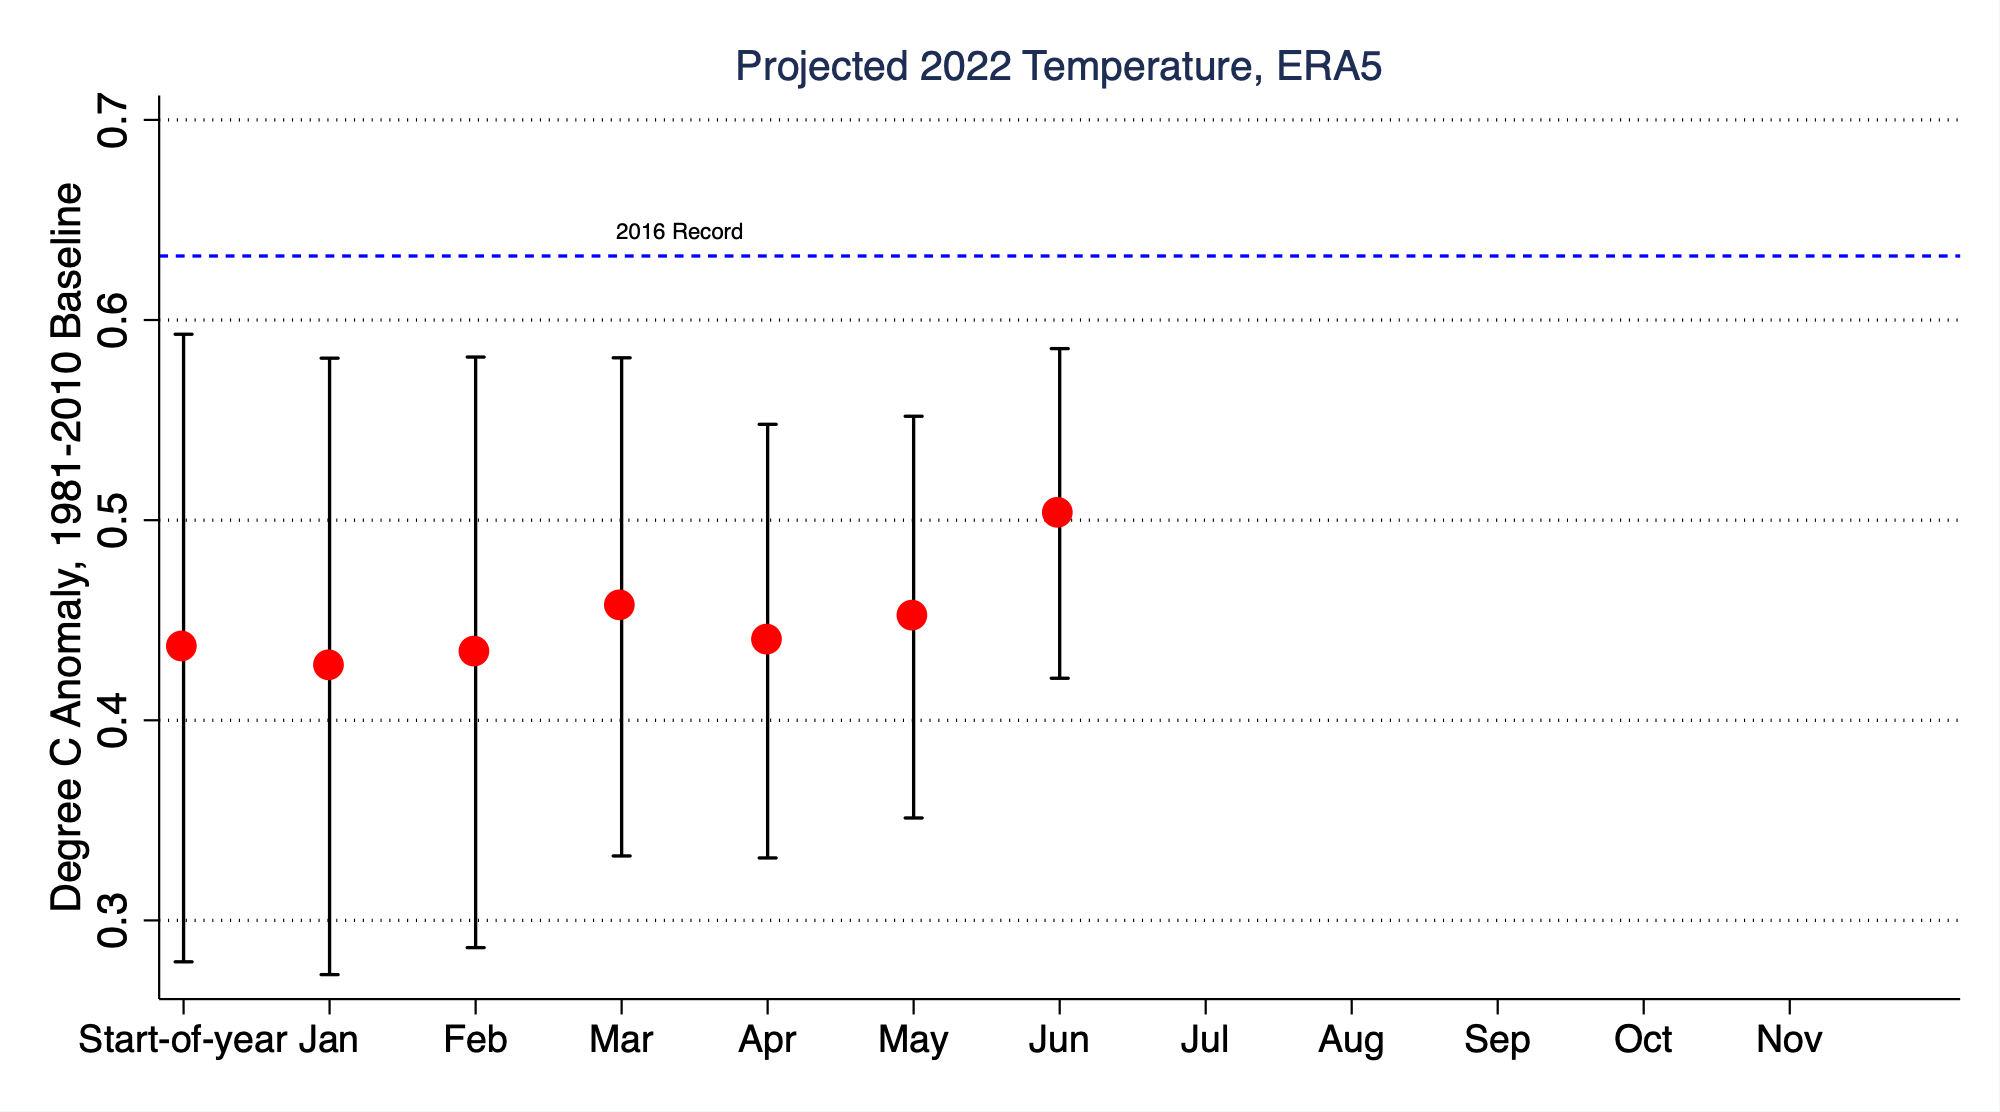
While it seems very unlikely that 2022 will be a record warm year for the world as a whole, it still may have many more regional climate extremes in store. Not every year will set a new record, but the long-term warming over the past few decades is unmistakable and is being driven by human emissions of CO2 and other greenhouse gases.