
State of the climate: Growing El Niño threatens more extreme heat in 2023
Zeke Hausfather
04.28.23Zeke Hausfather
28.04.2023 | 12:40pmThis year is shaping up to be one of top four warmest years on record – and has a modest chance of being the warmest on record.
Exceptionally warm conditions are being driven by the end of a persistent triple-dip La Niña and a rapid transition into warmer El Niño conditions.
Taking the first three months of the year, global surface temperatures so far are tied as the fourth warmest on record, after 2016, 2020 and 2017.
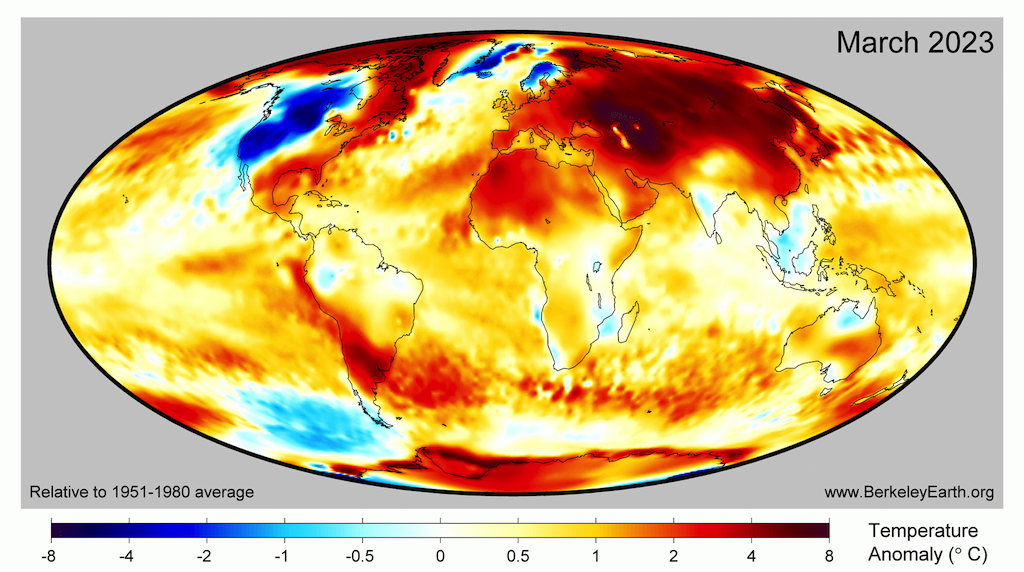
March 2023 was the second warmest since records began in the mid-1800s, with record warm temperatures in parts of central Asia, coastal China, and Japan, as well as South America.
Based on the year-to-date and the current El Niño forecast, Carbon Brief estimates that 2023 is very likely to end up between the warmest year on record and the sixth warmest, with a best estimate of fourth warmest. So early in the year, it is difficult to precisely predict where annual temperatures will end up.
Arctic sea ice extent is currently on the low end of its historical range, while Antarctic sea ice set new all-time low records in the first two months of 2023, with an all-time low summer minimum for the Southern Hemisphere in February 2023.
Fourth warmest start to a year
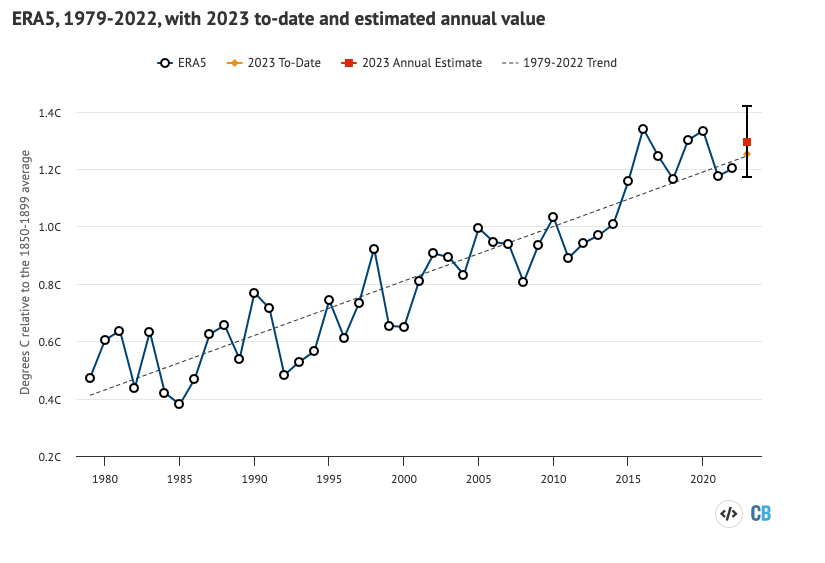
Global surface temperatures are recorded and reported by a number of different international groups, including NASA, NOAA, Met Office Hadley Centre/UEA and Berkeley Earth. Copernicus/ECMWF also produces a surface temperature estimate based on a combination of measurements and a weather model – an approach known as “reanalysis”.
The chart below compares the annual global surface temperatures from these different groups since 1970 – or 1979 in the case of Copernicus/ECMWF. The coloured lines show the temperature for each year, while the dots on the right-hand side show the year-to-date estimate for January to March 2023. Values are shown relative to a common baseline period – the 1981-2010 average temperature for each series. Surface temperature records have shown around 1C warming since the year 1970, a warming rate of about 0.19C per decade.
Year-to-date values are only shown for NASA, NOAA, Berkeley, and Copernicus as data for March is not yet available from Hadley/UAE. The year-to-date values will be updated when the data becomes available.
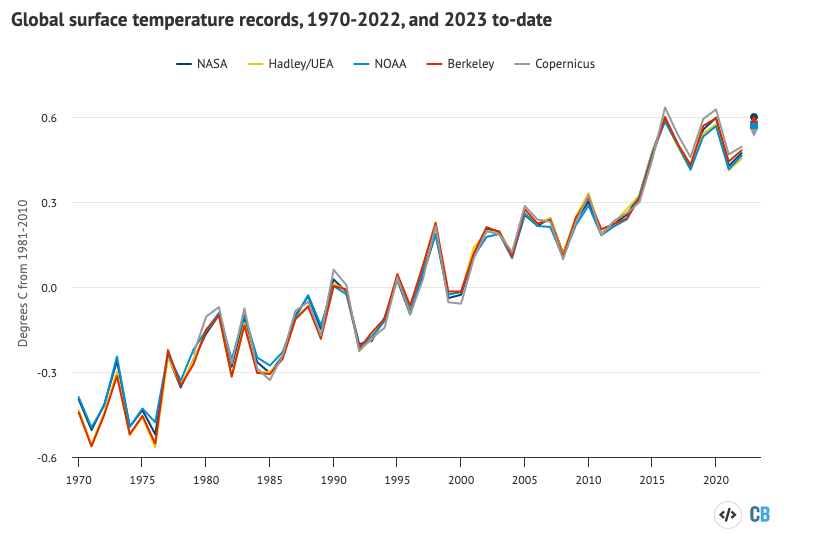
The temperatures in the first three months of 2023 were fairly warm, with year-to-date values in some records (NASA, Berkeley, NOAA) roughly tied with the warmest annual temperature anomaly on record.
However, higher temperature anomalies tend to occur in the early part of the year, so year-to-date temperatures may be somewhat higher than annual temperatures in some of the records.
The figure below shows how temperatures to-date in 2023 compare to prior years in the NASA dataset. It shows the temperature of the year-to-date for each month of the year, from January through to the full annual average.
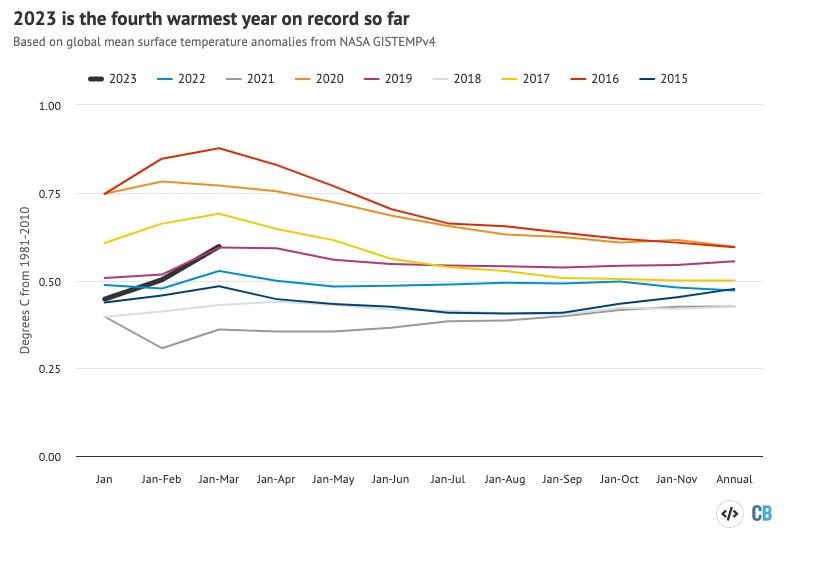
Despite a near-record warm March, 2023 is still running behind 2016, 2020 and 2017 in terms of year-to-date temperatures. The winter months were particularly warm in 2016 – 0.89C above the 1981-2010 average in the NASA GISTEMP dataset. The start of 2016 was boosted substantially by an extremely strong El Niño event, whereas early 2023 saw lingering La Niña conditions that only began dissipating in March.
El Niño and La Niña events – collectively referred to as the El Niño Southern Oscillation, or ENSO – are the main driver of year-to-year variation in global surface temperature on top of the long-term warming trend. ENSO events are characterised by fluctuations in temperature between the ocean and atmosphere in the tropical Pacific, which help to make some years warmer and some cooler.
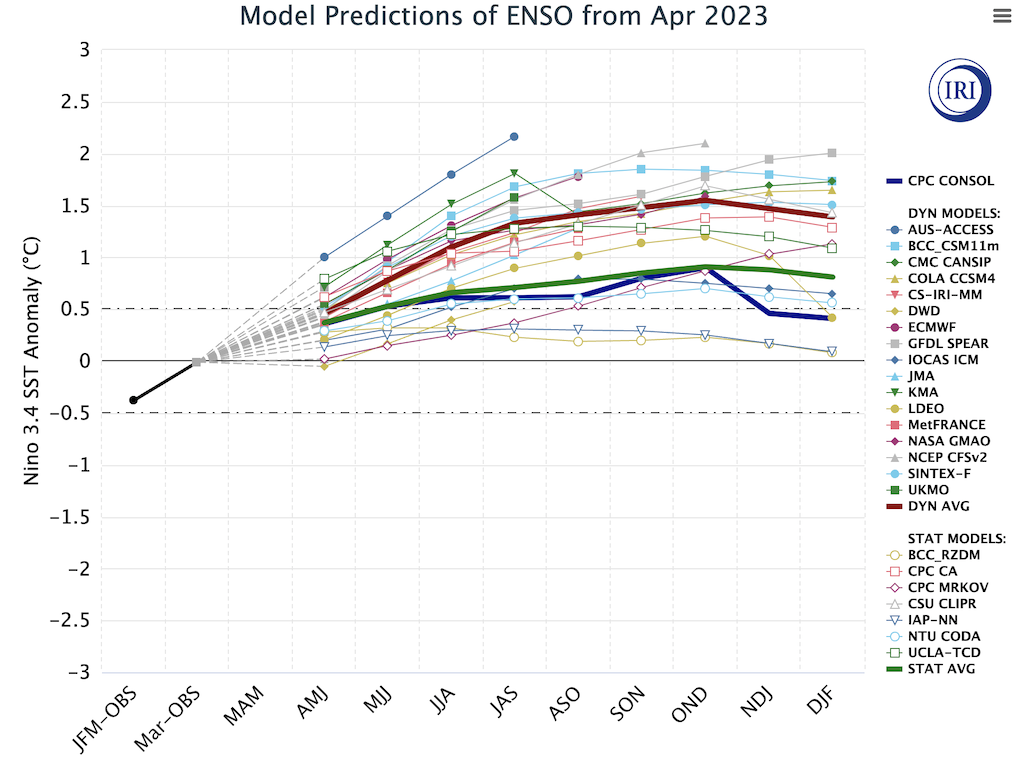
Nearly all forecasts for El Niño/La Niña suggest that El Niño conditions will develop by early summer in 2023, with a number of models projecting strong El Niño conditions (if not quite as strong as the super El Niño events experienced in 1998 and 2016).
The figure below shows a range of ENSO forecast models produced by different scientific groups, with the average for each type of model shown by thick red, blue and green lines. Positive values above 0.5C reflect El Niño conditions, while negative values below -0.5 reflect La Niña conditions.
Patterns of warming in 2023
While global average surface temperature changes are an important indicator of long-term climate change, any month or year will have important regional warm or cool patterns in different parts of the world. The first three months of 2023 saw particularly warm temperatures over eastern Europe and Asia, as well as the eastern US and parts of South America.
The figure below shows the difference between temperatures in the first three months of 2023 and the baseline period of 1951-1980, taken from Berkeley Earth (using their new high-resolution temperature product).
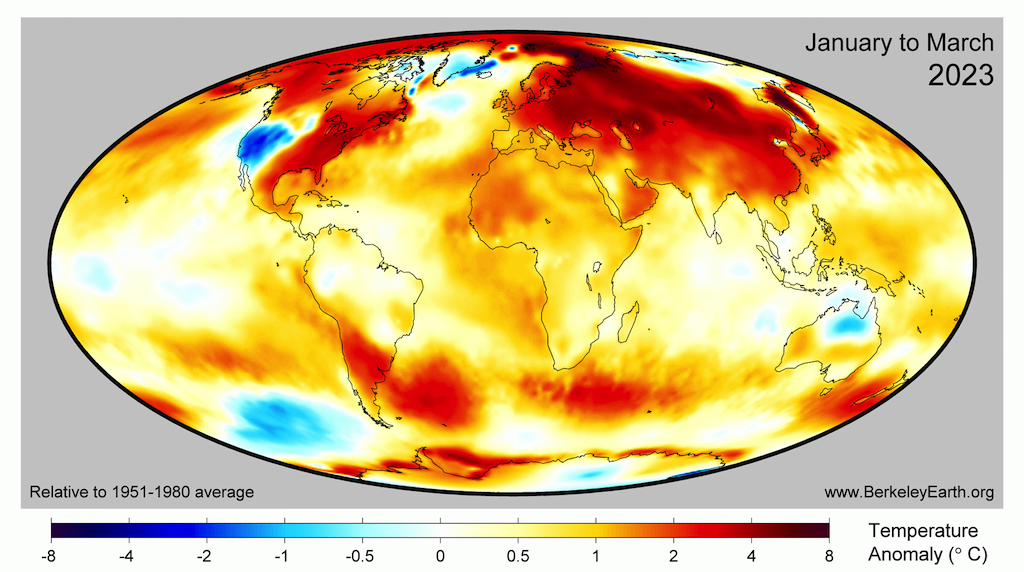
Approximately 4% of the Earth’s surface experienced record high temperatures for the first three months of 2023, while virtually nowhere experienced record cold temperatures.
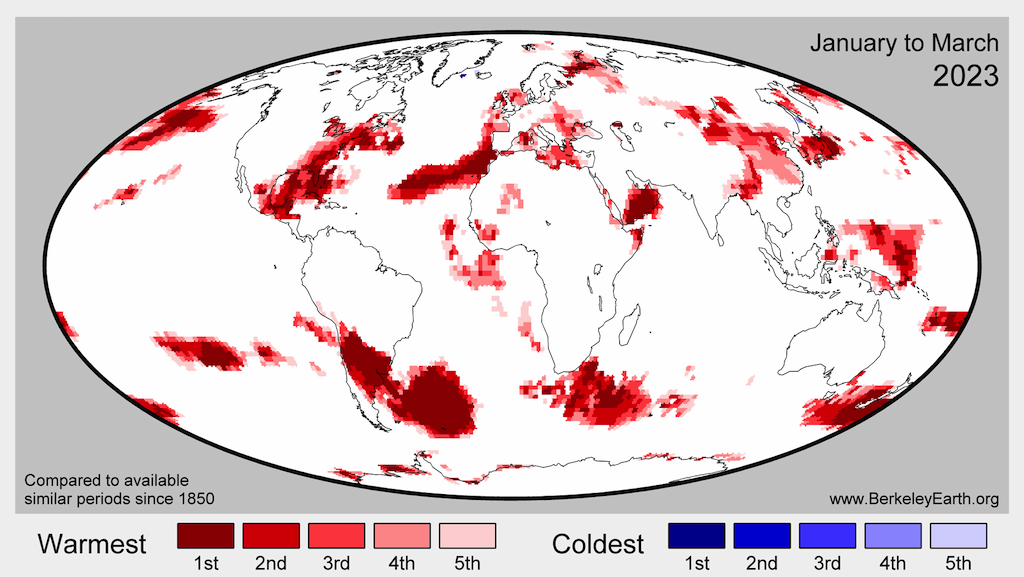
The month of March was particularly warm, clocking in as the second warmest March on record. There were record-breaking warm temperatures in March across parts of central Asia, coastal China, and Japan, as well as South America. Western parts of the US and southwestern Canada saw unusually cold temperatures, with some parts of coastal California even setting an all-time low temperature record.
Predicting global temperature in 2023
The first three months of 2023 can give some sense of what to expect for the entire year.
By looking at the relationship between the first three months and the annual temperatures for every year since 1970 – as well as ENSO conditions for the first three months of the year and the projected development of El Nino conditions for the remaining nine months – Carbon Brief has created a projection of what the final global average temperature for 2023 will likely turn out to be.
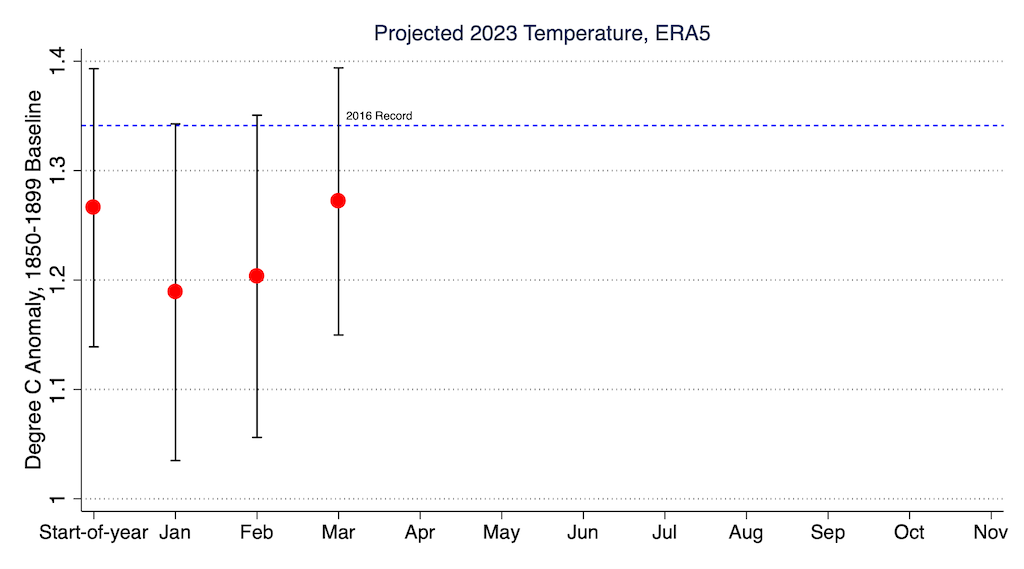
The analysis includes the estimated uncertainty in 2023 outcomes, given that temperatures from only the first quarter of the year are available so far. The chart below shows the expected range of 2023 temperatures using the Copernicus/ECMWF global atmospheric reanalysis product (ERA5) – including a best-estimate (red) and year-to-date value (yellow). Temperatures are shown with respect to the preindustrial baseline period (1850-1899).
Carbon Brief’s projection suggests that 2023 has the best chance of ending up as the fourth warmest year on record – and is very likely to be somewhere between the warmest year and sixth warmest year on record. We estimate that there is currently a modest chance (roughly 22%) that 2023 will end up exceeding 2016 as the warmest year on record (though if El Niño conditions continue to develop it is increasingly likely that 2024 will set a new record).
The figure below shows Carbon Brief’s estimate of 2023 temperatures using ERA5, both at the beginning of the year and once each month’s data has come in. While January and February estimates were a bit lower, the March estimate has increased due to its exceptional warmth and the growing consensus that strong El Niño conditions are likely to emerge in the latter half of 2023.
Antarctic sea ice hits record low summer extent
Arctic sea ice extent spent much of early 2023 at the low end of the historical 1979-2010 range, and set a few new record low values for individual days in February and March. Since northern hemisphere winter conditions remain cold enough to refreeze sea ice, there tends to be less variability in extent year-to-year in the winter than in the summer.
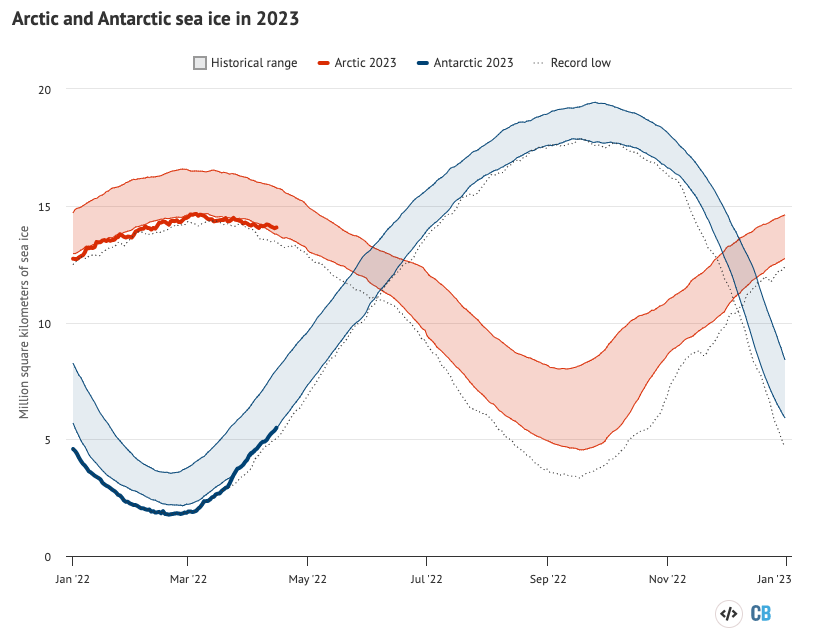
Antarctic sea ice, on the other hand, saw new record low levels for the first two months of the year, as well as the first half of March. Antarctic sea ice set a new all-time southern hemisphere summer minimum of 1.77 million square kilometres on 19 February.
The figure below shows both Arctic and Antarctic sea ice extent in 2023 (solid red and blue lines), the historical range in the record between 1979 and 2010 (shaded areas) and the record lows (dotted black line). Unlike global temperature records (which only report monthly averages), sea ice data is collected and updated on a daily basis, allowing sea ice extent to be viewed up to the present.
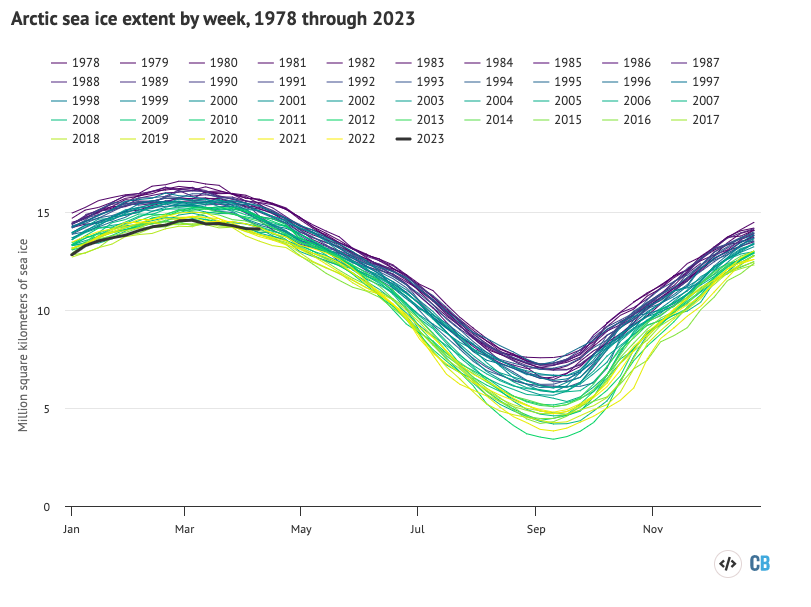
The figure below shows how Arctic sea ice has evolved over time, with each coloured line representing a different year. There is a clear decline over time, with prior decades showing much higher sea ice extent than more recent decades.
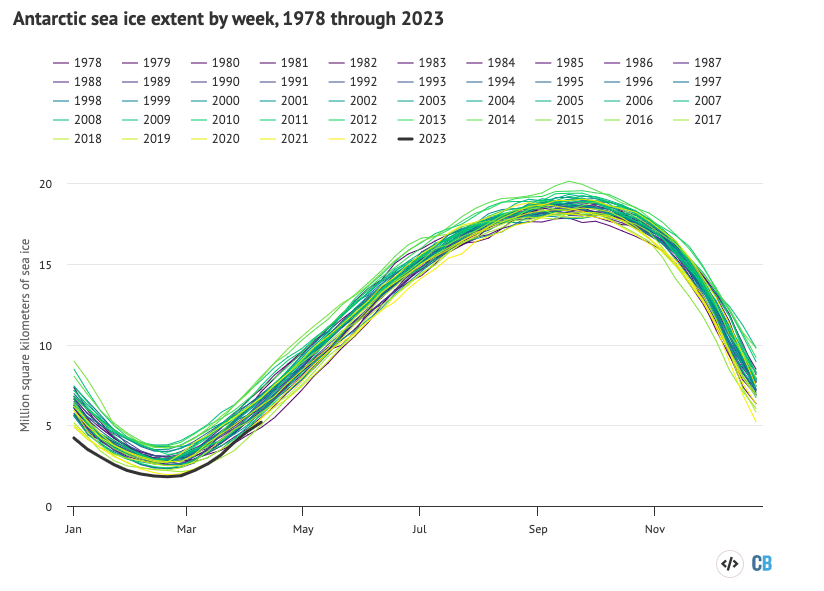
Unlike the Arctic, the long-term trend in sea ice extent in Antarctica is less clear. There is an active debate in the community about the relative role of climate change versus natural variability in the record lows experienced over the past two years, though it is clear that warming is driving at least some of the recent decline.
With the majority of the year still to go, a warm start and an El Niño gearing up in the Pacific look set to put 2023 among the top four hottest years on record, according to Carbon Brief’s analysis.
Depending on how things shape up for the remaining nine months, a new record hot year is not off the table.


-
State of the climate: Growing El Niño threatens more extreme heat in 2023