
Absence of carbon capture and storage is ‘biggest challenge to’ 2C limit
Tracking progress
The Paris Agreement sets out a global aim to limit warming at the Earth’s surface to “well below 2C” above pre-industrial levels, with “efforts” to limit it to 1.5C. With the Agreement now ratified and in force, the next challenge is actually meeting its ambition, says the study’s lead author Dr Glen Peters, senior researcher at the Centre for International Climate and Environmental Research in Oslo (CICERO) and project manager of the Global Carbon Project. He tells Carbon Brief:“The success of the Paris Agreement is built upon emission pledges submitted by countries, but at this stage there is no agreed method to track progress towards them, and ultimately towards the goals of the Paris Agreement.”
What makes this tricky is that countries have structured their emissions pledges in different ways, says Peters. Across almost 200 pledges there is a mix of targets for straight emissions reductions (e.g. 40% by 2030), emissions intensity (CO2 emissions per unit of GDP), technology deployment (e.g. expansion of solar or wind power), and others. The study gets around this problem by using a method known as the “Kaya Identity”, which breaks the rate of CO2 emissions down into the different human factors that affect it. This, as you can see from the diagram below, includes broad influences such as GDP and more specific factors such as how much renewable energy is up and running. The idea is that this can be used to assess progress across all of the different emissions pledges to show whether the world as a whole is on track.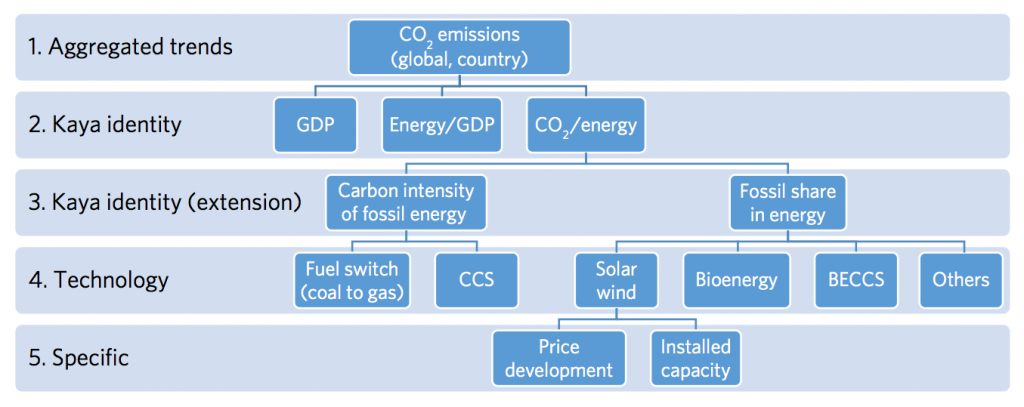
Emissions plateau
Using this approach, the study reveals some insights into how emissions have changed. Globally, the rate of CO2 emissions has broadly been stable over the last three years. This means we’re still adding CO2 to the atmosphere, but we’re not doing it faster than we were a couple of years ago. This plateau in the rate of emissions has come much earlier than expected, Peters says, and the main cause is a drop in how much coal China is burning:“The slowdown in China is primarily driven by economic factors, particularly a softening of construction activity and exports, and this in turn leads to reduced coal consumption. It is likely that policies on air pollution and renewables played a role in the reduced coal consumption, but not a dominant role.”
Elsewhere, the paper picks out several other factors that have contributed to a levelling-off of the rate of global emissions in recent years. These include a shift from coal towards gas in the US, rapid expansion of renewables in the EU, and slower GDP growth in the US, EU and China. While this is good news, says Peters, without locking in this stabilisation with tighter climate policies, there is a risk of a relapse. This is particularly true in China, Peters notes:“Much of the slowdown is due to power stations running less of the time, which means it is easy for emission growth to return if coal demand increases again.”
Overall, the paper says there “appears to be an emerging trend of declining carbon intensity” of energy, which is consistent with scenarios that keep temperature rise to 2C. This means that, on average, the amount of CO2 released per unit of energy we generate is falling – albeit slowly.‘Deep and sustained’ reductions
Looking ahead, the study compares current progress against different emissions scenarios that keep temperatures below the 2C limit. These scenarios are grouped into when they start (2010, 2020 or 2030). The scenarios show that the route to significant cuts in global emissions is through “deep and sustained” reductions in the carbon intensity of energy, the paper says. As you can see in the chart below, to keep up with the 2C scenarios (blue, red and yellow lines), the carbon intensity of energy (black line) needs to drop steeply over the first half of this century. The grey line shows a baseline scenario without climate policies.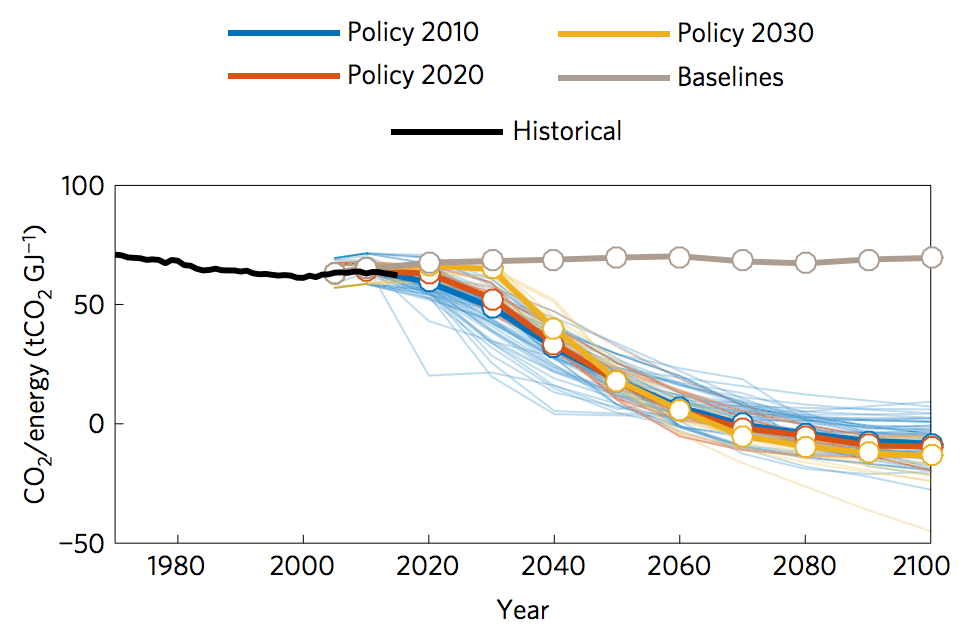

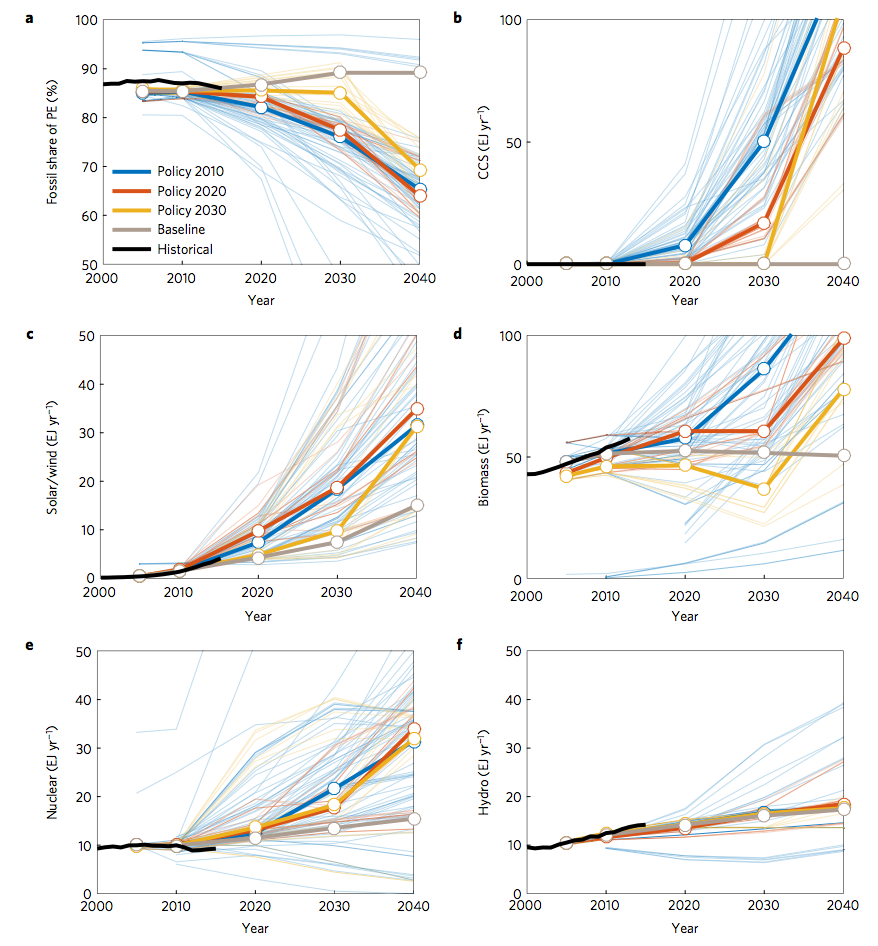
“Nuclear is perhaps unlikely to follow the trends in many 2C scenarios, and this is partly influenced by the recent public resistance to nuclear.”
The findings show how crucial the next decade is for halting emissions growth, says Dr Joeri Rogelj a research scholar at the International Institute for Applied Systems Analysis (IIASA) in Austria, who wasn’t involved in the study. He tells Carbon Brief:“It remains clear that the coming 5 to 10 years will be critical to indicate whether we actually and durably made the turn towards a low-carbon transition or not.”
Carbon capture and storage
Despite the positive findings, there is one area in particular that isn’t close to keeping pace with the 2C scenarios: CCS. The lack of development and deployment of CCS schemes remains the biggest challenge for meeting the 2C limit, Peters says:“There is a clear divergence from current trends and the scenarios. Most scenarios require thousands of CCS facilities by 2030, but there are only tens currently proposed.”
You can see this is chart (b) in the last figure. Without CCS, we either “need to look at alternative pathways to 2C” or “we have to accept that 2C is not possible,” says Peters:“These pathways may include greater improvements in energy efficiency, more wind, solar, nuclear, or other low carbon energy sources, or technological breakthroughs we currently do not know about.”
To address this lack of focus on CCS, the paper says “a globally-coordinated effort is needed to accelerate progress, better understand the technological risks, and address social acceptability.”Article information
Peters, G. P. et al. (2017) Key indicators to track current progress and future ambition of the Paris Agreement, Nature Climate Change, doi:10.1038/nclimate3202