Met Office: World has 10% chance of ‘overshooting’ 1.5C within five years

There is a one-in-10 chance that global average temperatures could “temporarily exceed” 1.5C above pre-industrial levels in at least one year over the next five years, according to new Met Office analysis.
Such a breach would not mean that the world has “missed” the Paris Agreement’s aspirational target of limiting human-caused global warming to 1.5C, scientists tell Carbon Brief.
This is because the Paris target is concerned with stabilising global temperature to 1.5C over longer timescales of up to 30 years. Thus, a potential “overshoot” should be seen as a “fluctuation” – and “does not mean” the Paris target “can be discarded”, a scientist adds.
The forecast expects the average global surface temperature from 2019-23 to reach between 1.03 and 1.57C above pre-industrial levels. If realised, this would make the period from 2014-23 the hottest decade since records began more than 150 years ago.
Heating up
The new analysis is a “decadal” forecast – a set of projections designed to capture fluctuations in climate over the next few years.
To do this, researchers use global climate models that project the impact of human-caused climate change alongside natural factors, such as solar variability and the cooling impact of volcanic eruptions and natural aerosols.
The projections also consider how conditions in the ocean are likely to change over the next few years. This is influenced by natural phenomena, such as El Niño, La Niña and the Atlantic Meridional Overturning Circulation (AMOC).
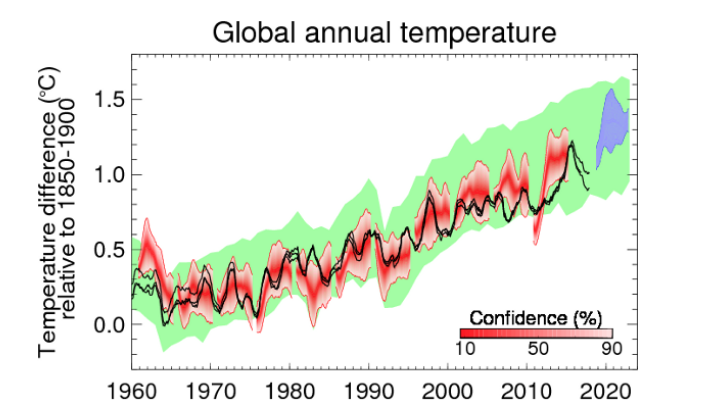
The results find that, over a five-year period from November 2018 to October 2023, the global average temperature rise is likely to be between 1.03C and 1.57C. This is shown on the chart below, where blue shading represents the range of expected temperature rise for this period, when compared to temperatures in the “pre-industrial period” (1850-1900).
This chart also shows actual temperature rise from 1960 to October 2018 in black, the results of previous Met Office decadal forecasts in red (hindcast) and results from the “Coupled Model Intercomparison Project” (CMIP5) in green.
The animated “gif” below shows how the Met Office’s decadal projections have changed from 2013-19. (The Met Office began producing decadal projections in December 2012 – but now releases forecasts starting at the end of the previous year in the following January or February.)
If this year’s forecast is realised, it would mean that the decade from 2014-23 will be the hottest ever recorded, the authors say.
(Analysis released today by the World Meteorological Organisation (WMO) finds that the past four years have been the warmest on record – with 2016 being the hottest year recorded.)
The forecasted heat is a consequence of the world continuing to rapidly release greenhouse gases, the authors say:
“The forecast is for continued global warming largely driven by continued high levels of greenhouse gases. However, other changes in the climate system, including a moderate La Niña in 2018 and longer term shifts in both the Pacific Decadal Oscillation (PDO) and Atlantic Multidecadal Oscillation (AMO), are also contributing.”
(Carbon Brief has previously published articles explaining how the PDO and the AMO can temporarily alter the pace of global warming.)
1.5C still alive?
The analysis also finds that, over the next five years, there is a 10% chance that global average temperature will “temporarily exceed” 1.5C for one year. In a press release, Dr Doug Smith, a Met Office research fellow, says:
“A run of temperatures of 1C or above would increase the risk of a temporary excursion above the threshold of 1.5C above pre-industrial levels. Predictions now suggest around a 10% chance of at least one year between 2019 and 2023 temporarily exceeding 1.5C.”
This temporary breach would not mean that the world has missed the “climatological” target of limiting global temperature rise to 1.5C, explains Dr Joeri Rogelj, a researcher at Imperial College London and a lead author of the Intergovernmental Panel on Climate Change’s (IPCC) special report on 1.5C. He tells Carbon Brief:
“International temperature targets are defined in ‘climatological’ means – that is global temperatures that are typically averaged over a period of 30 years. So exceeding 1.5C in one given year does not mean that the 1.5C goal has been breached and can be discarded. Actually, this is precisely what we expect when approaching a global warming limit of 1.5C.”
Another important thing to consider is that the Paris target is concerned with human-caused global warming – whereas this forecast includes the influence of both human and natural factors, says Prof Piers Forster, director of the Priestley International Centre for Climate at the University of Leeds and another lead author of the IPCC report on 1.5C. He tells Carbon Brief:
“The 1.5C target is firstly a human-induced warming target – natural warming can warm or cool on top of this on many different timescales, but it is this human warming that matters in the long term and what society can act to reduce.”
Global picture
As well as looking at how the average global temperature could change, the forecast also projects regional changes.
The maps below show projected warming from November 2018 to October 2023 across the world, relative to “pre-industrial” temperatures. Map “A” shows the “most likely forecast outcome”, the researchers say.
Meanwhile, maps “B” and “C” show the projected range in forecasted temperatures, they add. “We expect only a 10% chance of temperatures at particular locations being less than those in ‘B’, and only a 10% chance of temperatures being higher than in ‘C’.”
On all the maps, dark blue and green indicates temperature decline whereas yellow, orange and red show temperature increases.
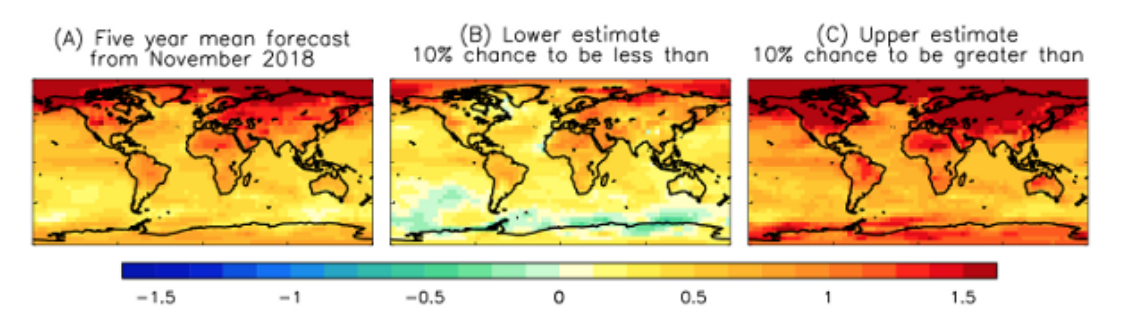
Map A indicates that warming is likely to be highest around the northern mid-latitudes, as well as near to the Arctic.
Previous research shows that temperatures in the Arctic are increasing at a rate that is more than twice as fast as the global average. One driver of this is diminishing Arctic sea ice. This is because, as ice melts, energy from the sun that would have been reflected away is instead absorbed by the ocean.
(Last week, Carbon Brief published a detailed explainer examining how Arctic warming could be affecting extreme weather further afield – including across the US and western Europe.)
‘Alarm bells’
Though the new forecast does not show that we are about to breach the Paris target of limiting warming to 1.5C, it may indicate that we are getting close, Rogelj says:
“Exceeding 1.5C of warming in one specific year would not mean that we have missed the 1.5C target, but it does ring an alarm bell telling us that we are getting very close. In a similar way, if a few colder years would be projected this does not mean that warming has halted and that we can emit much more greenhouse gases. The noise in the annual temperatures should not distract from the long-term trend.”
Missing the 1.5C target would mean breaching a “safe” level of warming – but may not necessarily spark runaway climate change, he adds:
“It is important to note that governments support a 1.5C temperature goal because they consider that to be a level of warming that is acceptable or safe for their citizens and societies. Breaching that level of global warming does indeed mean that we failed to limit warming to that ‘safe’ level, but does not mean that climate change should suddenly go unchecked. The world doesn’t end at 1.5C, but, at the same time, science also shows us that severe impacts are already to be expected at 1.5C of warming.”