
Study: Why troposphere warming differs between models and satellite data

Temperatures from satellites
Much of our historical temperature data comes from weather stations, ships, and buoys on the Earth’s surface. Since 1979 temperature records of the atmosphere are also available from satellite-based microwave sounding units (MSU). These measure the “brightness” of microwave radiation bands in the atmosphere, from which scientists can estimate air temperatures. However, the bands measured by the satellite instruments cannot easily provide the temperature of a specific layer of the atmosphere. Researchers have identified particular sets of bands that correspond to the temperature of the lower troposphere (TLT) spanning roughly 0 to 10 km, the middle troposphere (TMT) spanning around 0 to 20 km and the lower stratosphere (TLS) spanning 10 to 30 km. Unfortunately, these bands tend to overlap a bit. For example, TMT estimates will include part of the lower stratosphere, while TLT estimates will include some surface temperature. These overlaps matter because different parts of the atmosphere are expected to react very differently to climate change. When greenhouse gases trap incoming solar radiation, they tend to increase the temperature of the surface and lower atmosphere, and decrease the temperature of the upper atmosphere as less solar radiation is escaping. We see this in satellite observations and data from weather balloons, where the lower stratosphere is cooling while the underlying troposphere and surface are warming. Because the tropospheric temperature estimates from satellites overlap with part of the stratosphere, they end up combining a bit of stratospheric cooling with tropospheric warming and can underestimate the true rate of warming. To avoid this issue, the new study applies a correction to remove some of the stratospheric cooling from the TMT series. The approach they use for this is described in a previous paper published in the Journal of Climate.Correcting errors in the data
Dealing with stratospheric contamination is not the only challenge when working with satellite data. Unlike on the surface where there are tens of thousands of individual observation stations, there are only around two to three MSU satellites taking measurements at any given time, and the satellites only last about five-to-ten years before they need to be replaced. While the satellites are designed to pass over the same part of the earth at the same time every day, that changes as their orbits decay. A satellite that once took the temperature over London at 2pm ten years ago, for example, might now be taking it at 8pm. Changing the observation times has a big effect on the temperatures measured, and researchers need to correct their measurements for this. Similarly, a replacement satellite might measure temperatures slightly differently from its predecessor. Around the year 2000, for example, the instrument in the satellites was changed to an upgraded version of the sensor. All of these can potentially introduce bias into measurements that need to be addressed. There are two main groups that process the same underlying MSU data to estimate atmospheric temperatures: the University of Alabama, Huntsville (UAH) and Remote Sensing Systems (RSS). Each group has a different set of assumptions to correct for various issues in the data, and they end up with fairly different results. You can see how the UAH (yellow line) and RSS (blue) figures differ in the chart below – particularly after the year 2000. Annual global mean middle tropospheric temperatures from RSS and UAH from 1979 through 2016, covering from 82.5 N–82.5 S. No stratospheric adjustments are included as an adjusted UAH dataset is not available. Chart by Carbon Brief using Highcharts. While RSS generally agrees with the rate of warming seen globally in surface temperature records, UAH shows much less warming – including a more pronounced slowdown in temperature rise after 1998. The differences between satellite records are much larger than those between different surface temperature estimates. Co-author Dr Carl Mears, the co-founder of RSS, suggests that:“In general, I think that the surface datasets are likely to be more accurate than the satellite datasets. The between-research spreads are much larger than for the surface data, suggesting larger structural uncertainty.”
These large uncertainties between satellite datasets somewhat complicate any comparison of tropospheric temperatures with climate models, as it makes it unclear if the disagreement is due to issues in the models or in the observations, and leaves open the possibility that additional corrections to the data may happen in the future.Comparisons with climate models
In their paper, the researchers employed a number of different statistical tests to compare climate models and observations of TMT. They corrected both models and observations for stratospheric cooling influence, and compared the two over the period from 1979 through 2016 as shown in the figure below. The upper chart shows the model output and the lower chart shows the observations from RSS.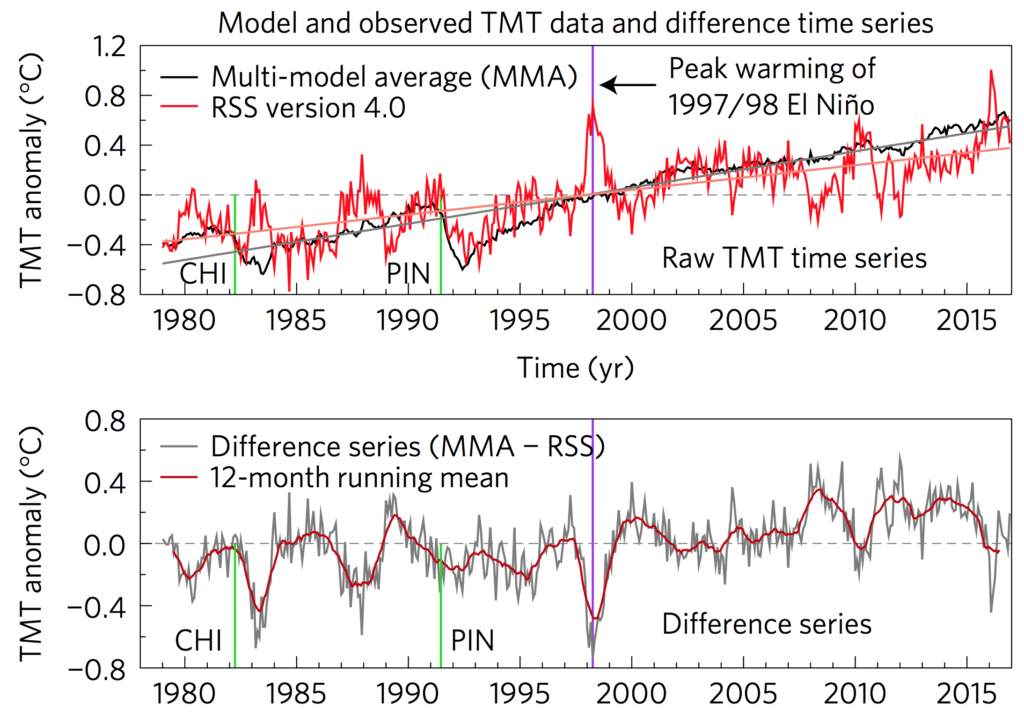
Article information
Santer, B. D. et al. (2017) Causes of differences in model and satellite tropospheric warming rates, Nature Geoscience, doi:10.1038/ngeo2973