Why land-use emissions have fallen by a third this century – in six charts
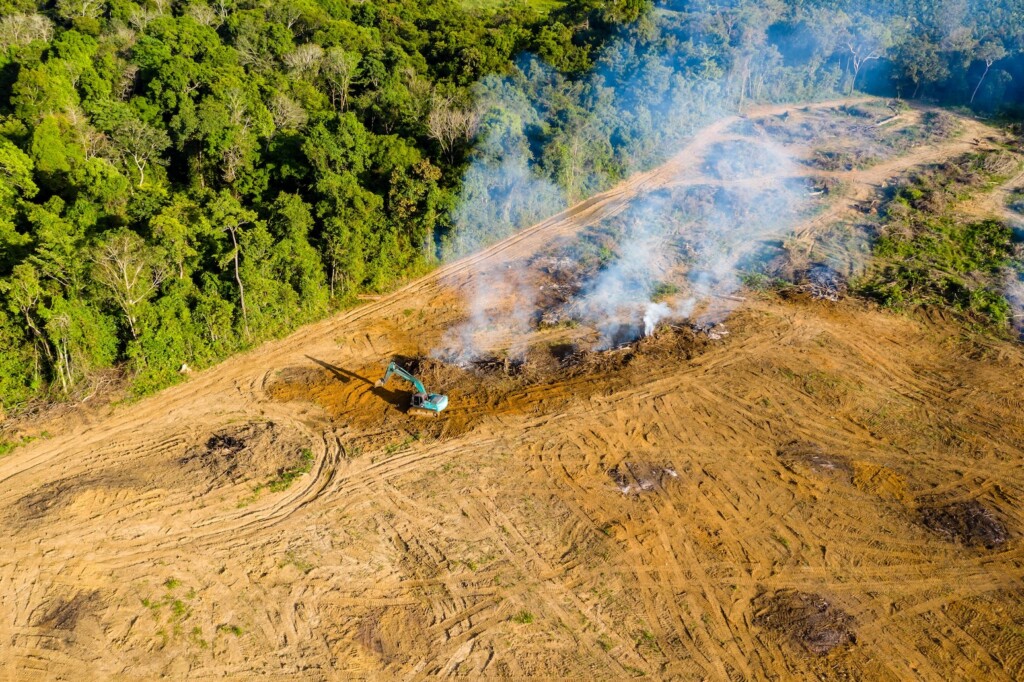
Emissions from land-use change – including deforestation, loss of peatland and forest degradation – have been falling over the course of the 21st century.
The latest Global Carbon Budget report, formally published in May in the journal Earth System Science Data, notes a “statistically significant decrease” in land-use change emissions since the late 1990s.
The 21st-century decline in land-use emissions has accelerated in recent years, with the report highlighting a “steep drop” after 2015.
Writing for Carbon Brief in November 2025, climate scientists Dr Zeke Hausfather and Prof Pierre Friedlingstein noted that land-use emissions in 2025 had decreased by “around 32% compared to their average in the 2000s”.
Via six charts, Carbon Brief explores how – and why – land-use emissions have fallen over the past quarter of a century as fossil-fuel emissions have continued to climb.
How have land-use emissions changed?
Deforestation, forest degradation, loss of peatlands and harvesting trees for wood all release carbon into the atmosphere.
Collectively, these emissions are known as land-use, land-use change and forestry (LULUCF) emissions, referred to here as land-use emissions.
Each year, global land-use emission trends are analysed in the Global Carbon Budget report. The report, produced by dozens of scientists, documents how human-caused greenhouse gas emissions are changing over time.
Key findings from the annual report are released each year in the autumn, before being published formally in an academic journal the following year following a peer-review process.
(For more on the findings of the 2025 report, read Carbon Brief’s summary.)
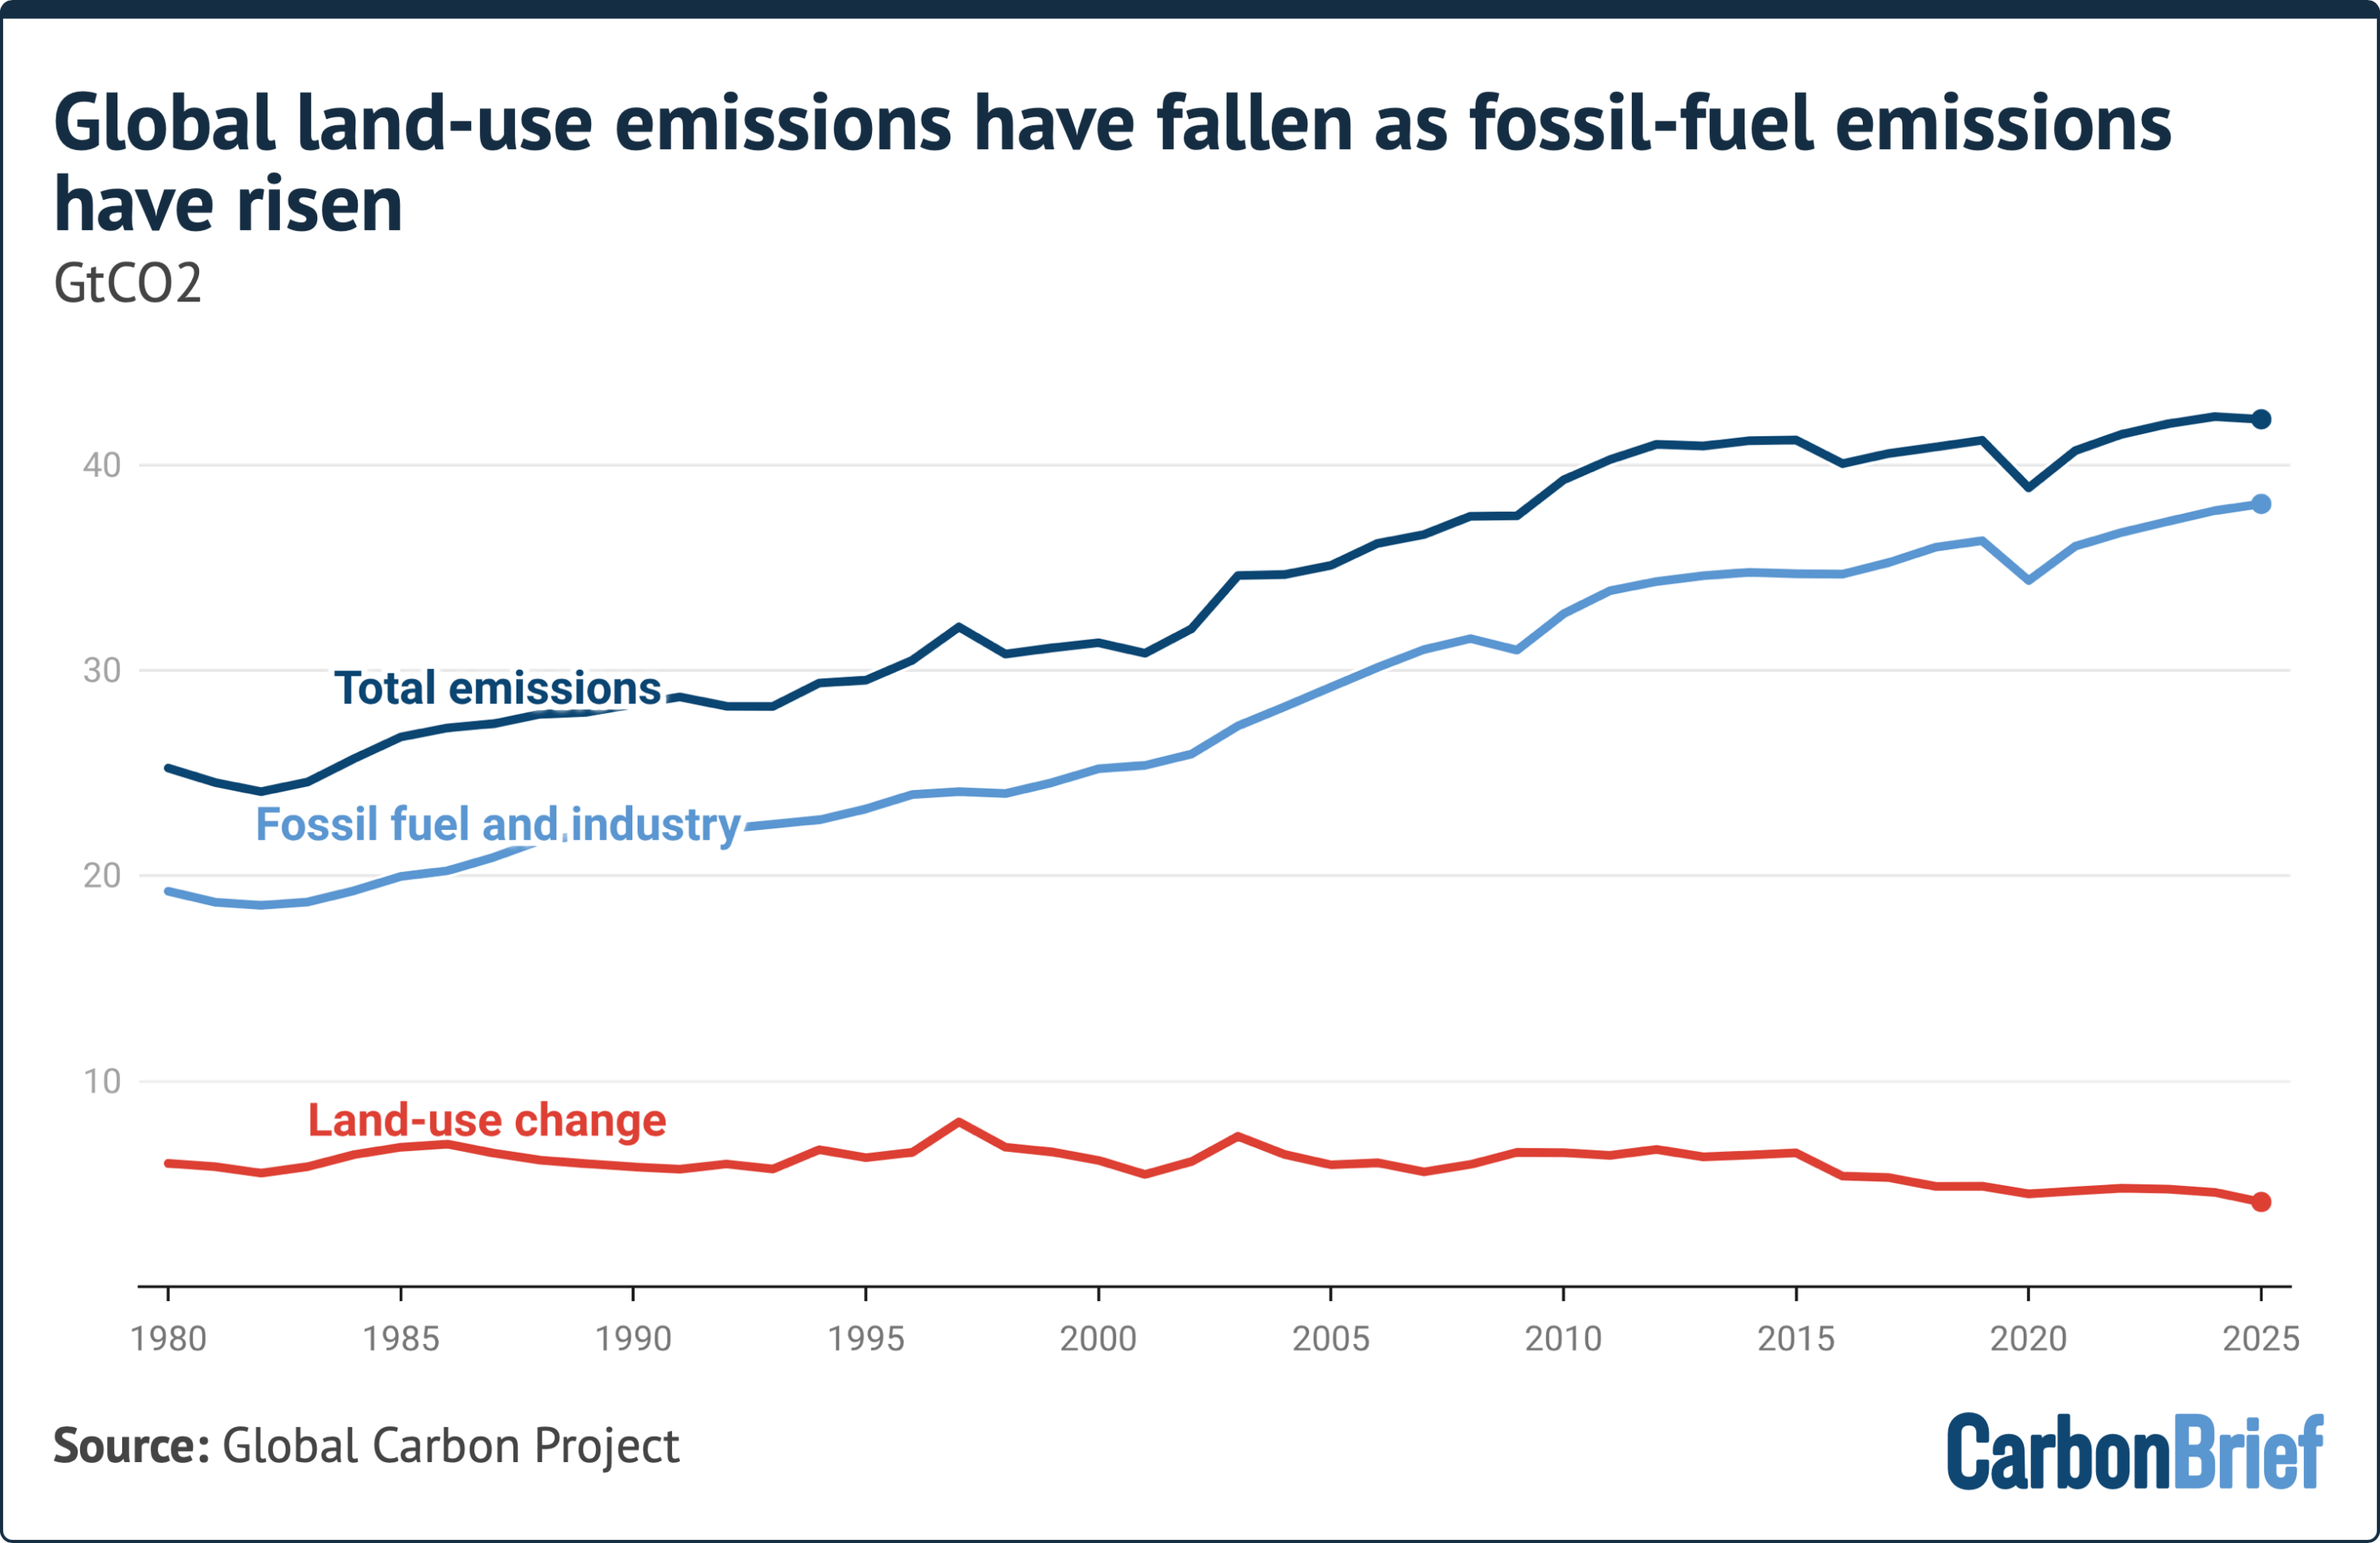
The latest edition of the Global Carbon Budget report notes that, in the four decades to 1999, net CO2 emissions from land-use change remained “relatively constant”, sitting at around 6.6bn tonnes of carbon dioxide (GtCO2) per year.
However, since the late 1990s, global land-use emissions have been falling.
The 2025 report estimates that land-use emissions over 2015-24 averaged at 5GtCO2 a year. This is around 23% lower than the average over 1995-2004 and 19% lower than 2005-14, it says.
In contrast, global emissions from fossil fuels and cement have increased every decade since 1959, rising from an average of 11GtCO2 in the 1960s to 35.9GtCO2 over 2015-24, it says.
“Preliminary data” included in the report suggests that land-use emissions in 2025 clocked in lower than their 2014-25 average, at 4.1GtCO2, as fossil-fuel and cement emissions reached a new high of 38.1GtCO2.
(For more on how land-use emissions are calculated, see: Why are estimates of land-use emissions uncertain?)
The chart below shows how land-use emissions have been falling in the 21st century and have helped to temper the overall rise of human-caused emissions.
Why have land-use emissions fallen?
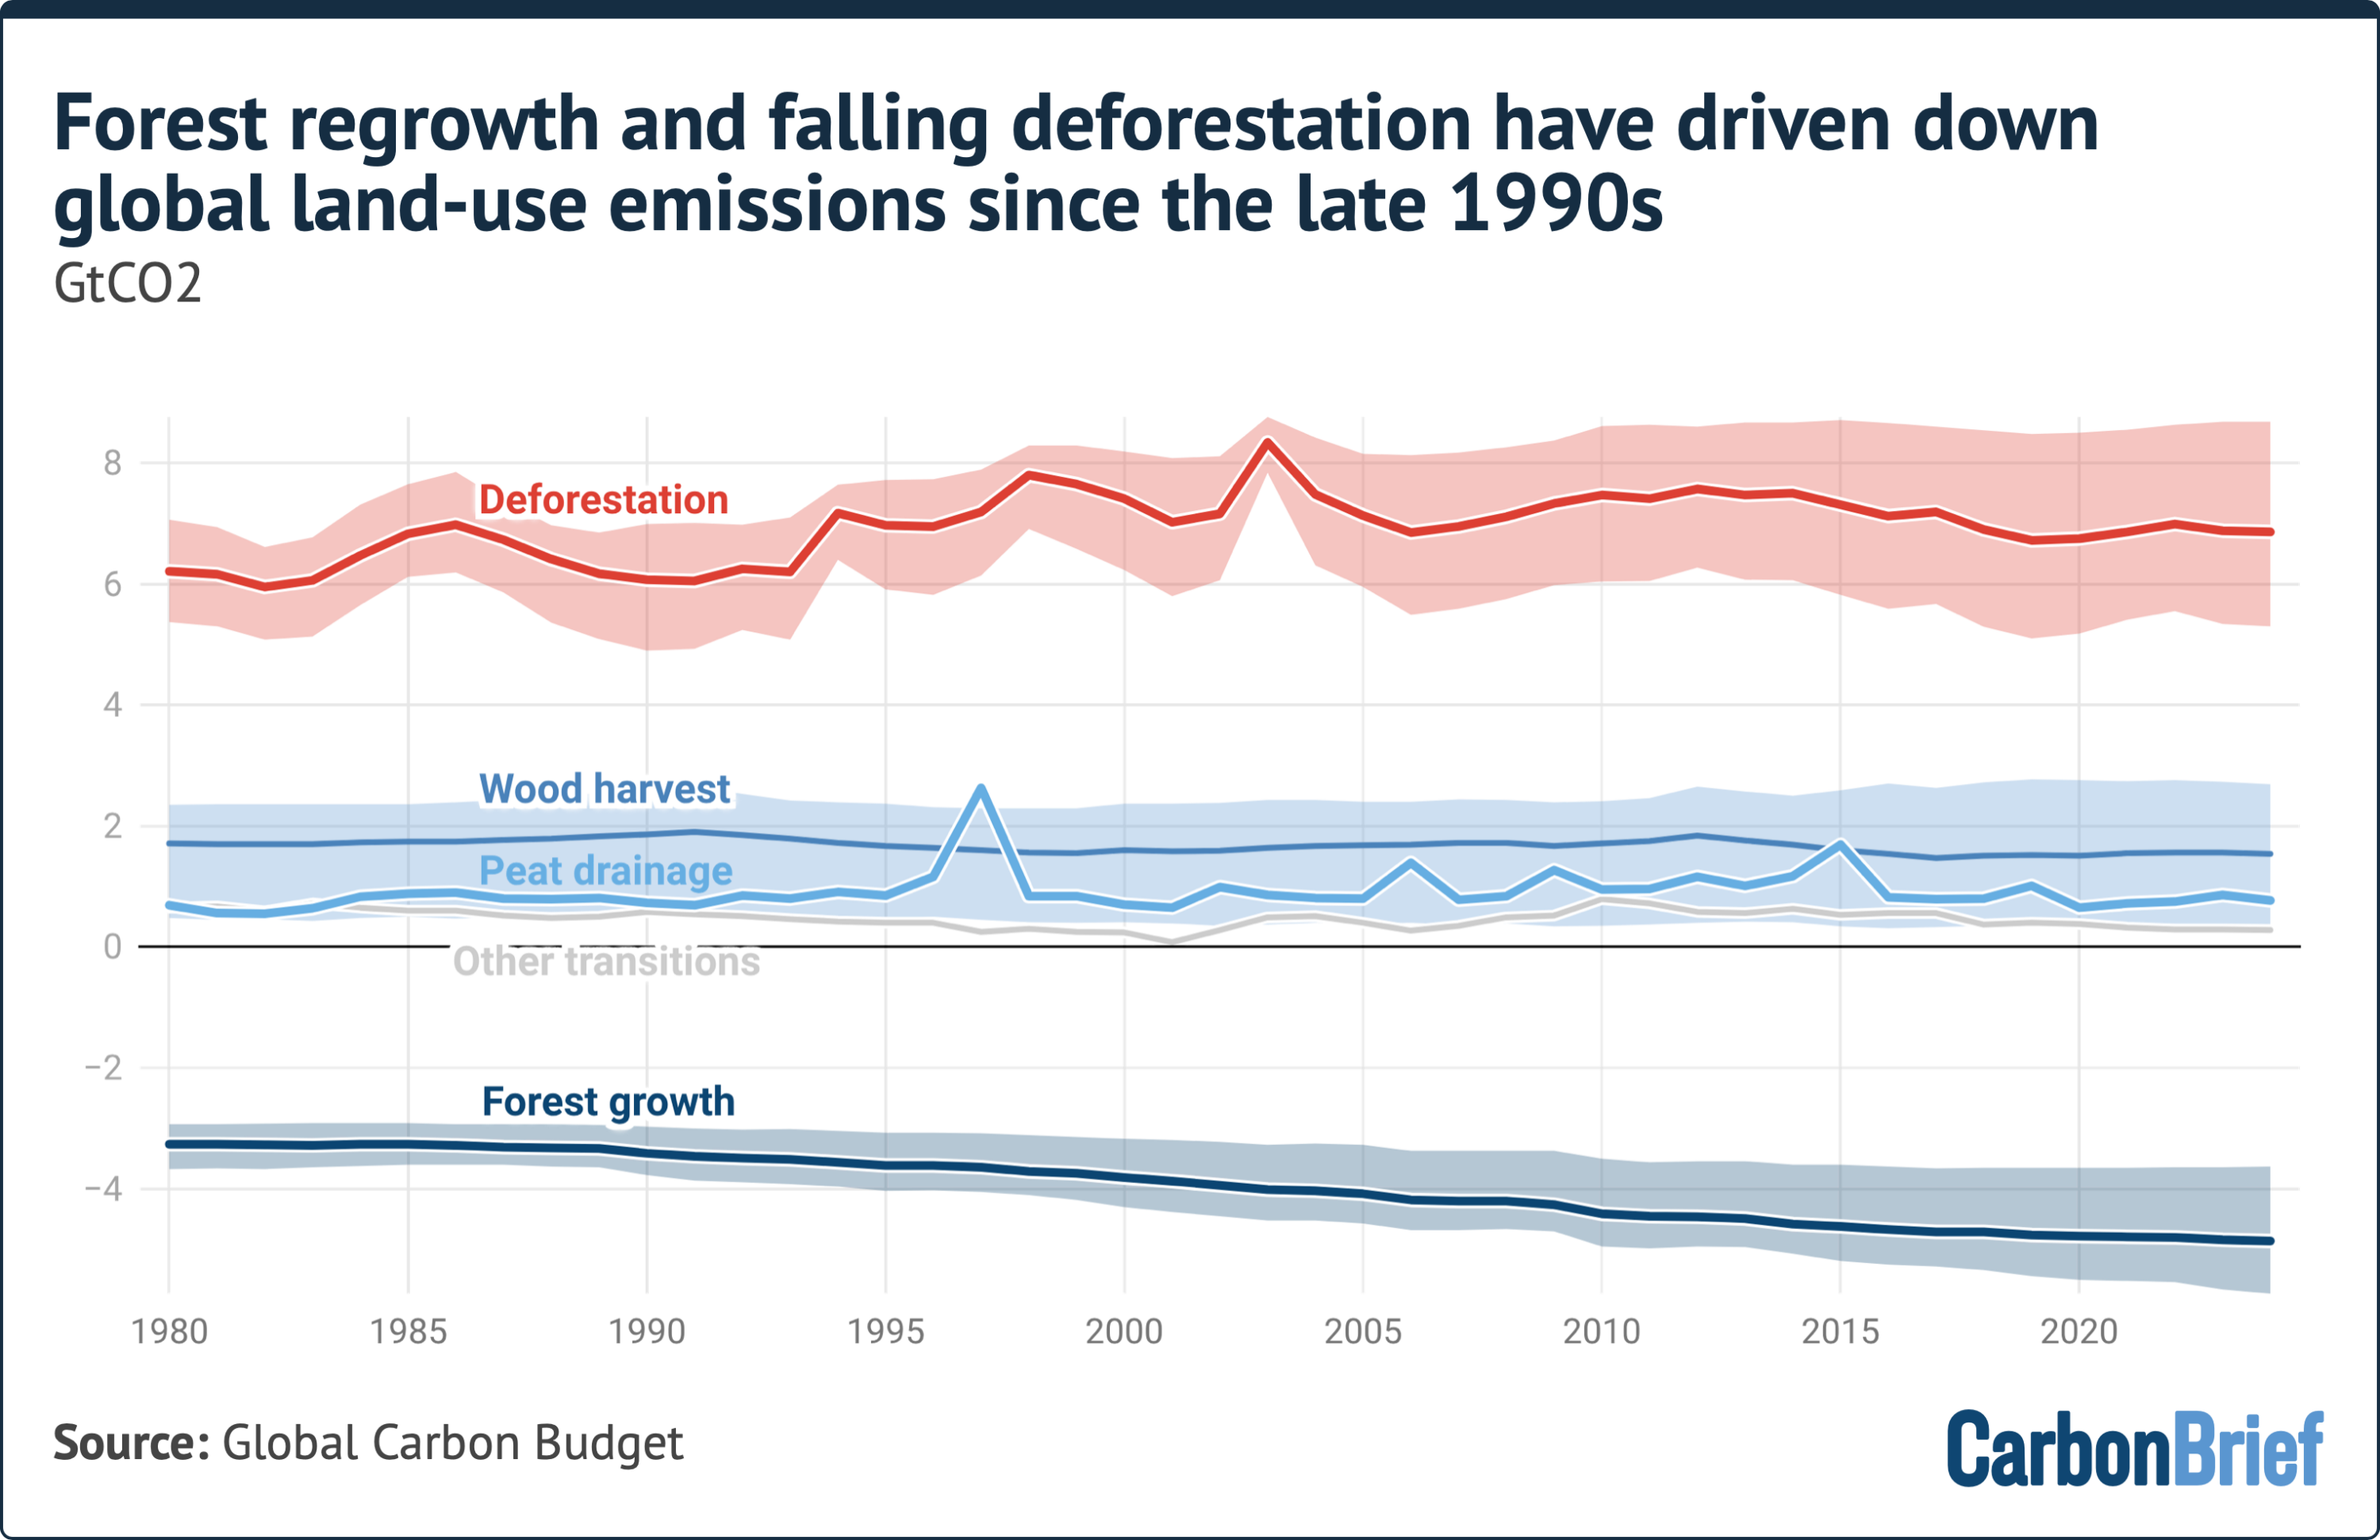
The Global Carbon Budget attributes falling land-use emissions since the late 1990s to decreasing emissions from deforestation, in particular “permanent deforestation”.
Permanent deforestation refers to the complete removal of trees for the conversion of forest to another land use, such as agriculture, mining or the construction of towns and cities. This sets it apart from other forms of deforestation, such as logging and rotational farming, where the canopy is removed on a more temporary basis.
The Global Carbon Budget also points to “increasing [CO2] removals” from forest regrowth as a reason for falling land-use emissions since the turn of the century.
(For more on the countries and policies that have driven these changes, see: Which countries are behind falling land-use emissions? and: Which countries are leading on forest regrowth?)
Looking at more recent trends, the report attributes a “steep drop” in land-use emissions in the decade since 2015 to the “combined effect” of a “peak” in peat fire emissions in 2015, as well as a “long-term decline” in deforestation emissions in many countries over 2010-20.
The chart below shows how deforestation and forest growth have been responsible for the bulk of change to land-use emissions over the 21st century.
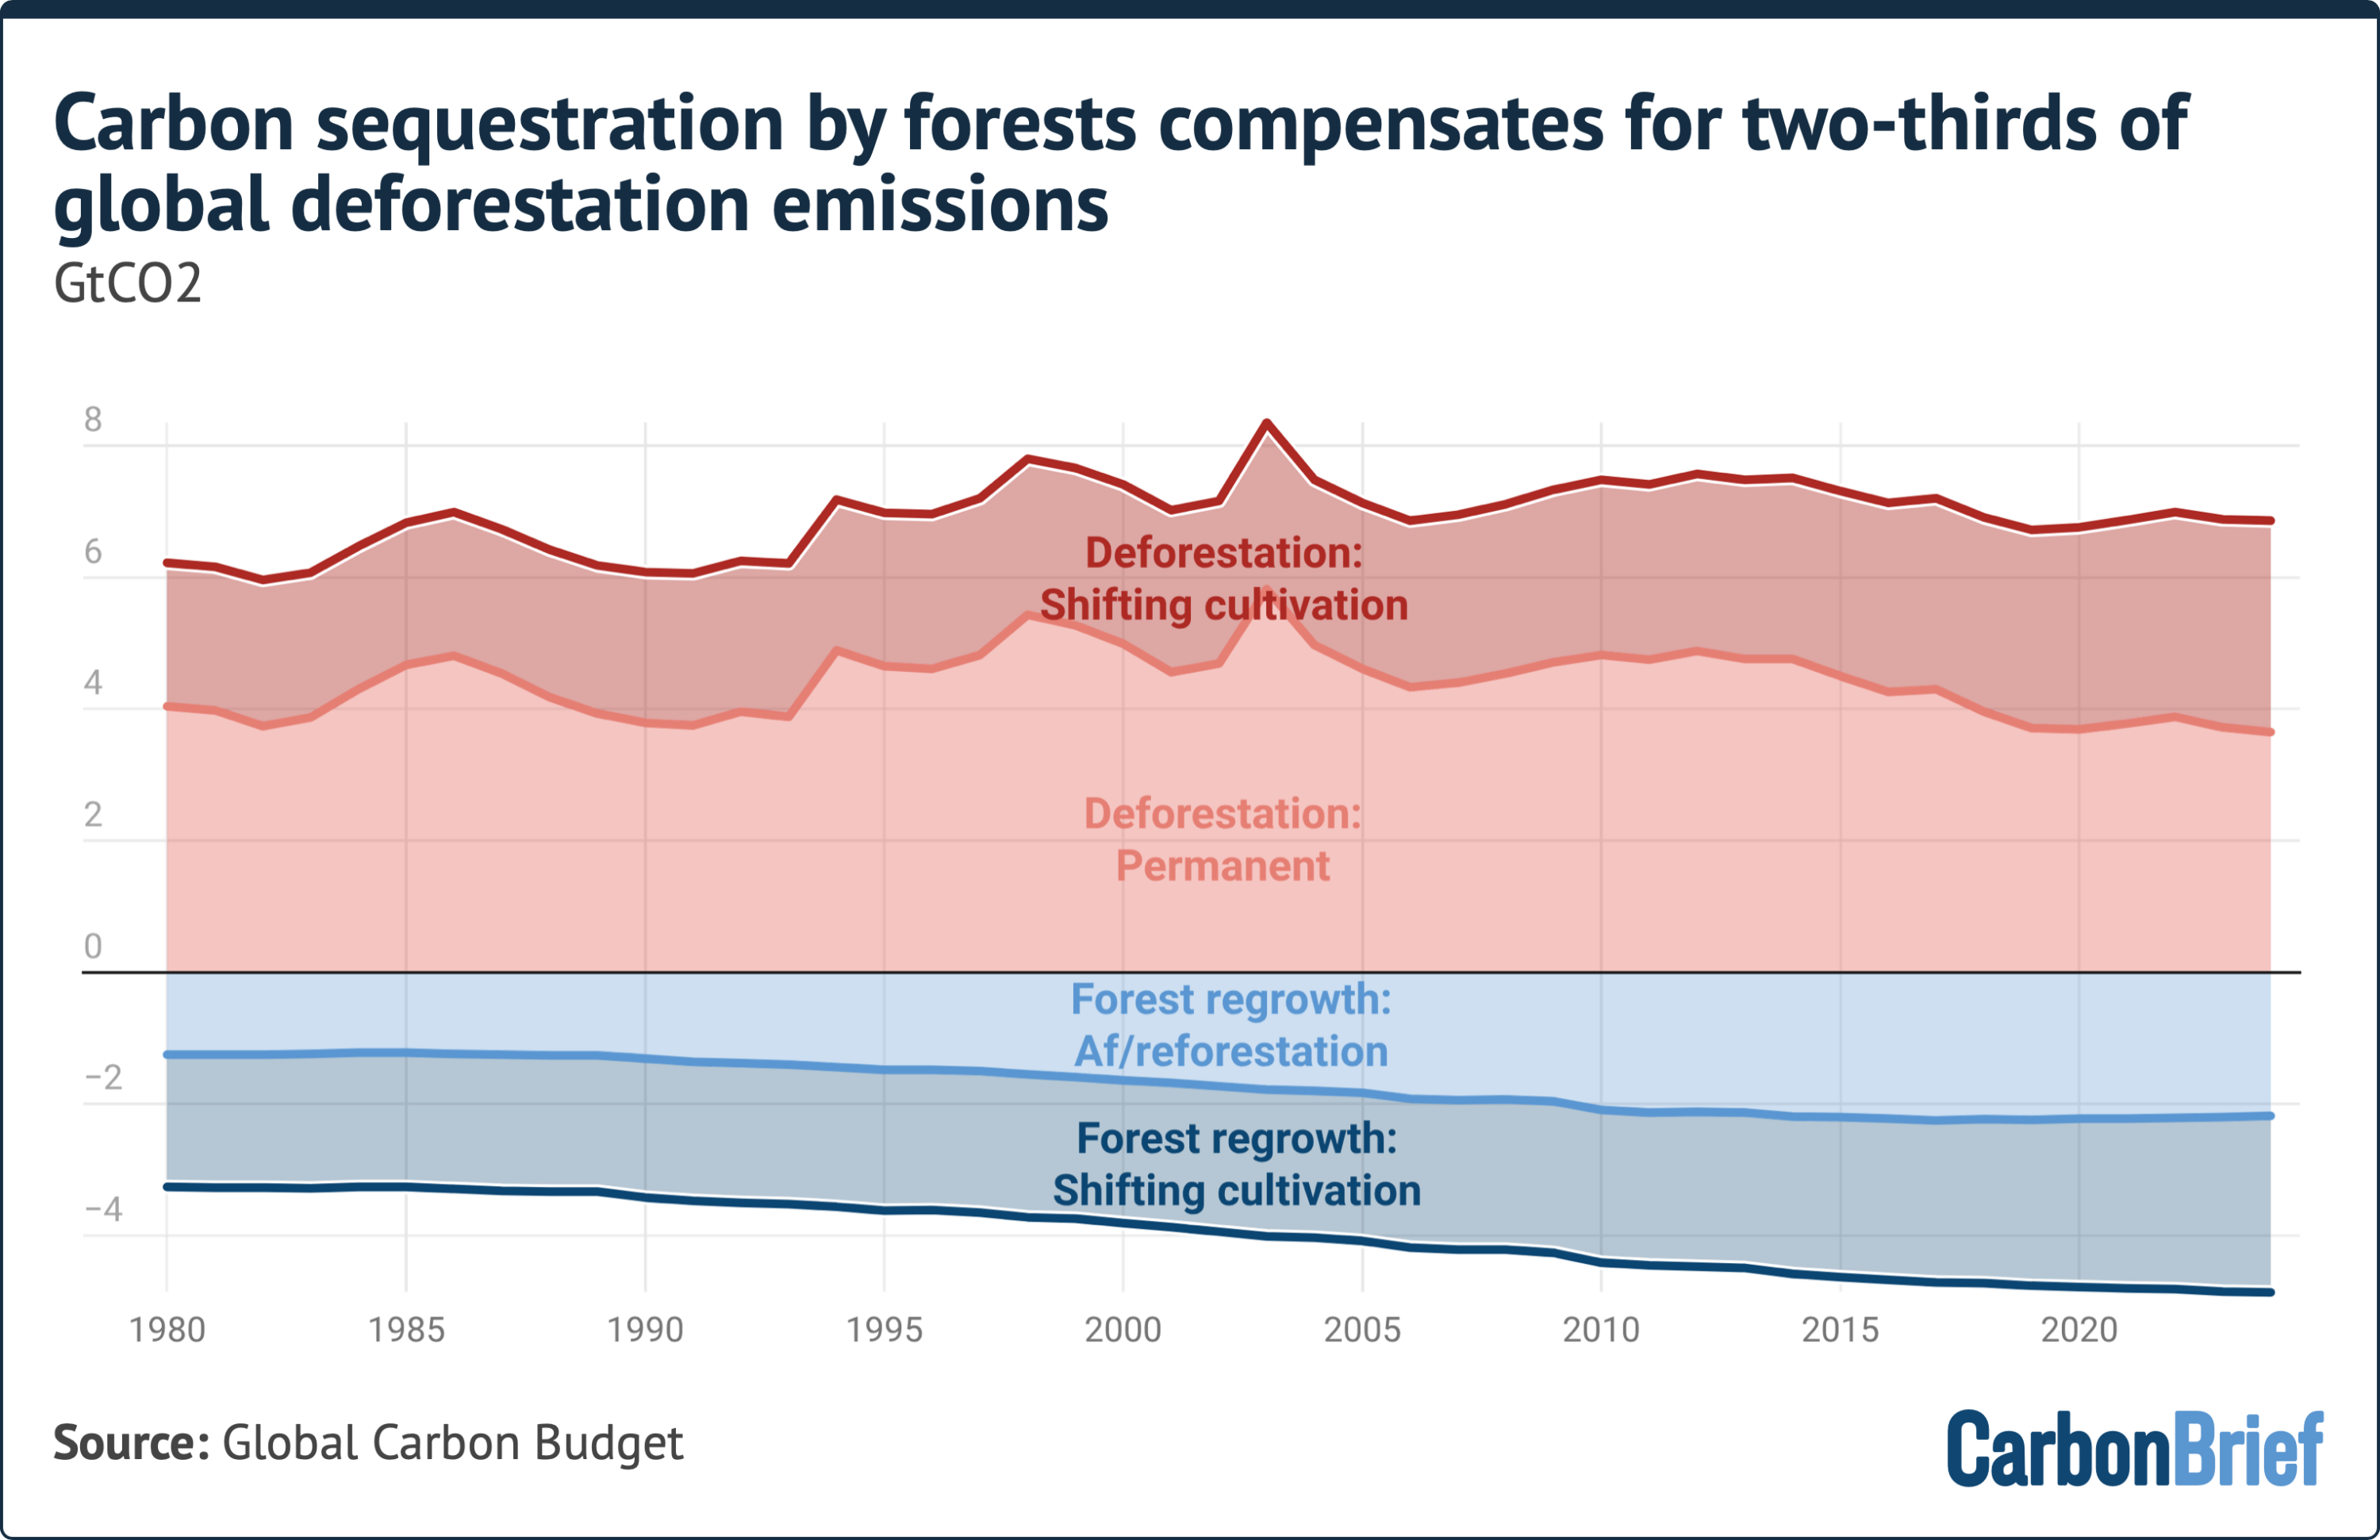
Over 2015-24, the sequestration of CO2 through reforestation and afforestation efforts offset two-thirds of deforestation emissions, according to the Global Carbon Budget report.
Specifically, it notes that deforestation was responsible for an average of 6.96GtCO2 of emissions each year over 2015-24. Forest growth, on the other hand, removed 4.76GtCO2 a year.
Just under half – 2.2GtCO2 – of carbon removals over 2015-24 was from afforestation and reforestation efforts and the remaining 2.56GtCO2 were driven by forest regrowth from shifting cultivation cycles, it says.
Forest regrowth from shifting cultivation refers to the recovery of a forest after a plot has been farmed for a short period and then abandoned.
This is shown in the chart below below, which shows how carbon removals from forest regrowth have offset emissions from deforestation.
In the near-term, the Global Carbon Budget attributes its projection of a drop in land-use emissions between 2024 and 2025 to the “end of El Niño conditions”.
(The naturally occurring weather phenomenon typically leads to the drying out of peatlands in the tropics and causes more planned deforestation fires to burn out of control.)
Prof Pierre Friedlingstein, director of the Global Carbon Budget office and a professor at the University of Exeter, tells Carbon Brief there is “no indication” of what might happen in the future, but adds that land-use emissions trends over the 21st century are “going in the right direction”. He says:
“If you are optimistic, you hope the trend will not reverse and start increasing again. But we don’t know for sure. The assumption, given current land policies across the world, is that deforestation should continue to decline.”
Which countries are behind falling land-use emissions?
The countries that contributed the most to land-use emissions over 2015-24 were Brazil, the Democratic Republic of the Congo (DRC) and Indonesia, according to the Global Carbon Budget.
It notes that these three countries together contributed more than half – 57% – of global land-use emissions.
Over the first quarter of the 21st century, falling land-use emissions in Brazil and Indonesia have combined with increased afforestation and reforestation in China to drive down overall land-use emissions, according to the Global Carbon Budget.
This is illustrated in the chart below, which shows how China’s land-use emissions have dropped below zero, as Brazil and Indonesia’s emissions have declined.
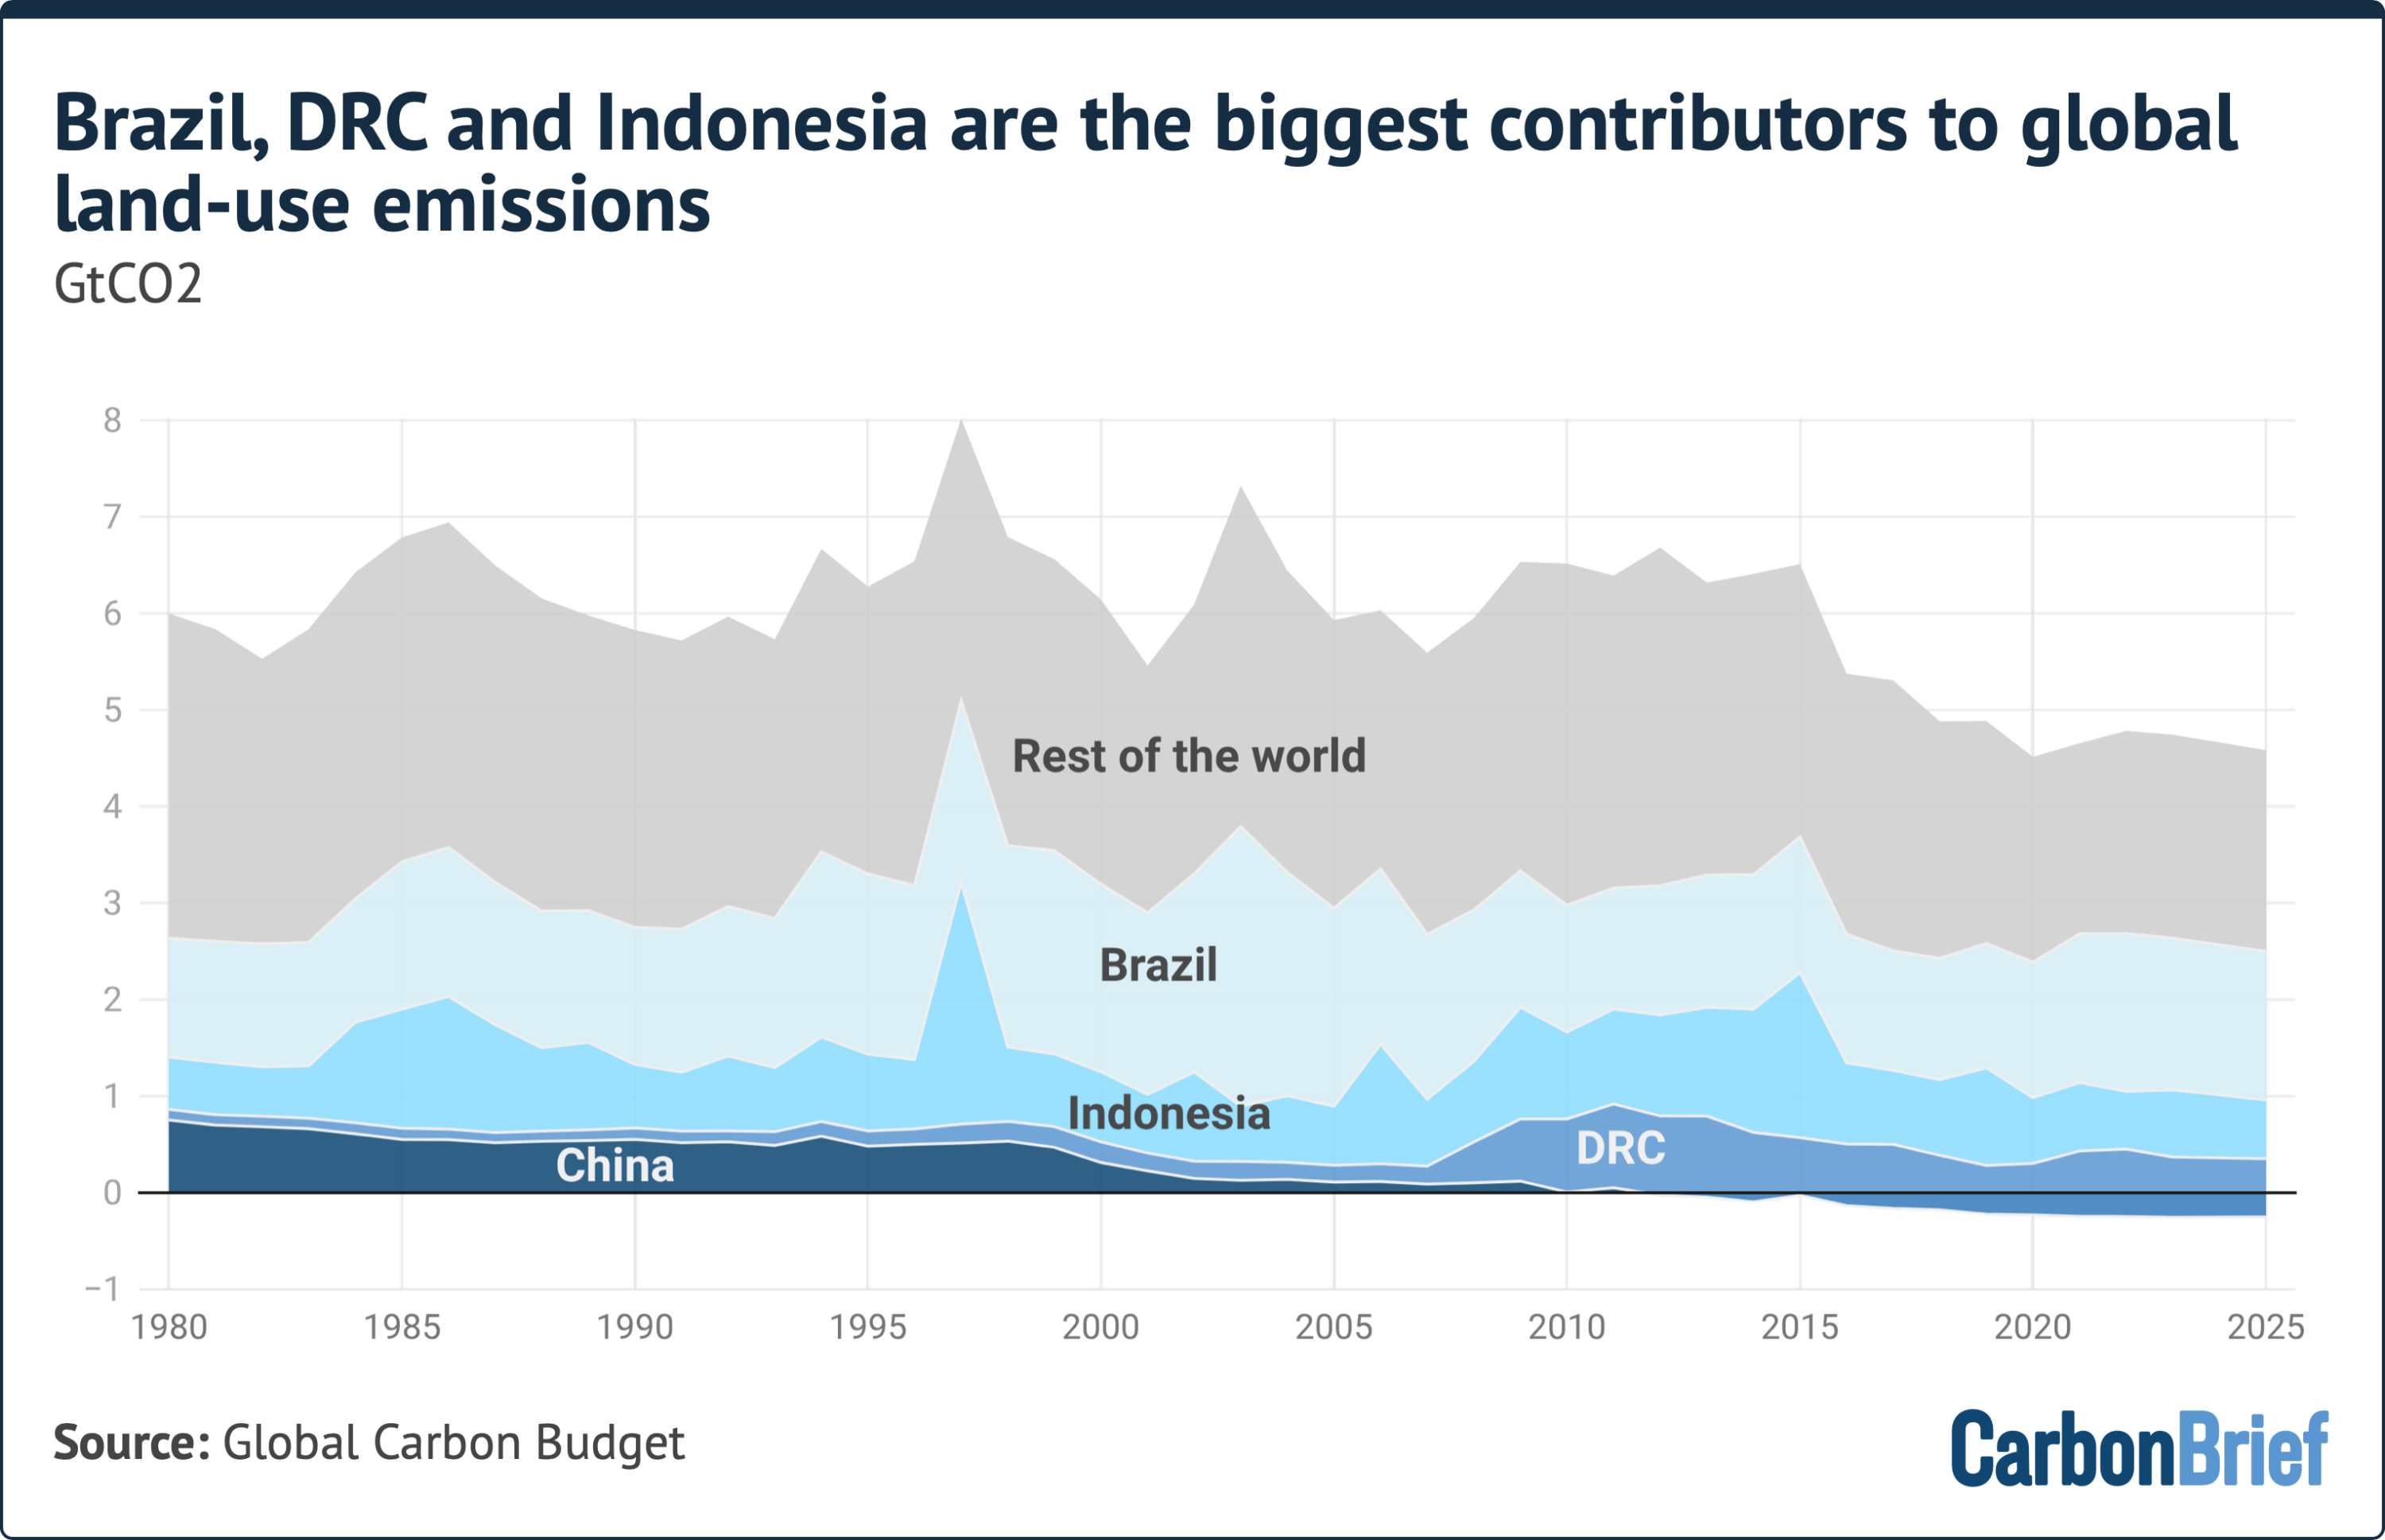
Friedlingstein says that the decline in land-use emissions since the 2000s has been “primarily driven by a decline in deforestation in Brazil”.
He tells Carbon Brief that tree clearance in the South American country rose in the 1990s then started to fall after a peak in the 2000s:
“There was a bit of up and down – mainly due to politics and who was in charge in Brazil – [whether the president] was [Luiz Inácio] Lula [da Silva] or [Jair] Bolsonaro. But the long-term trend in Brazil is a decline in deforestation due to forest protection policies.”
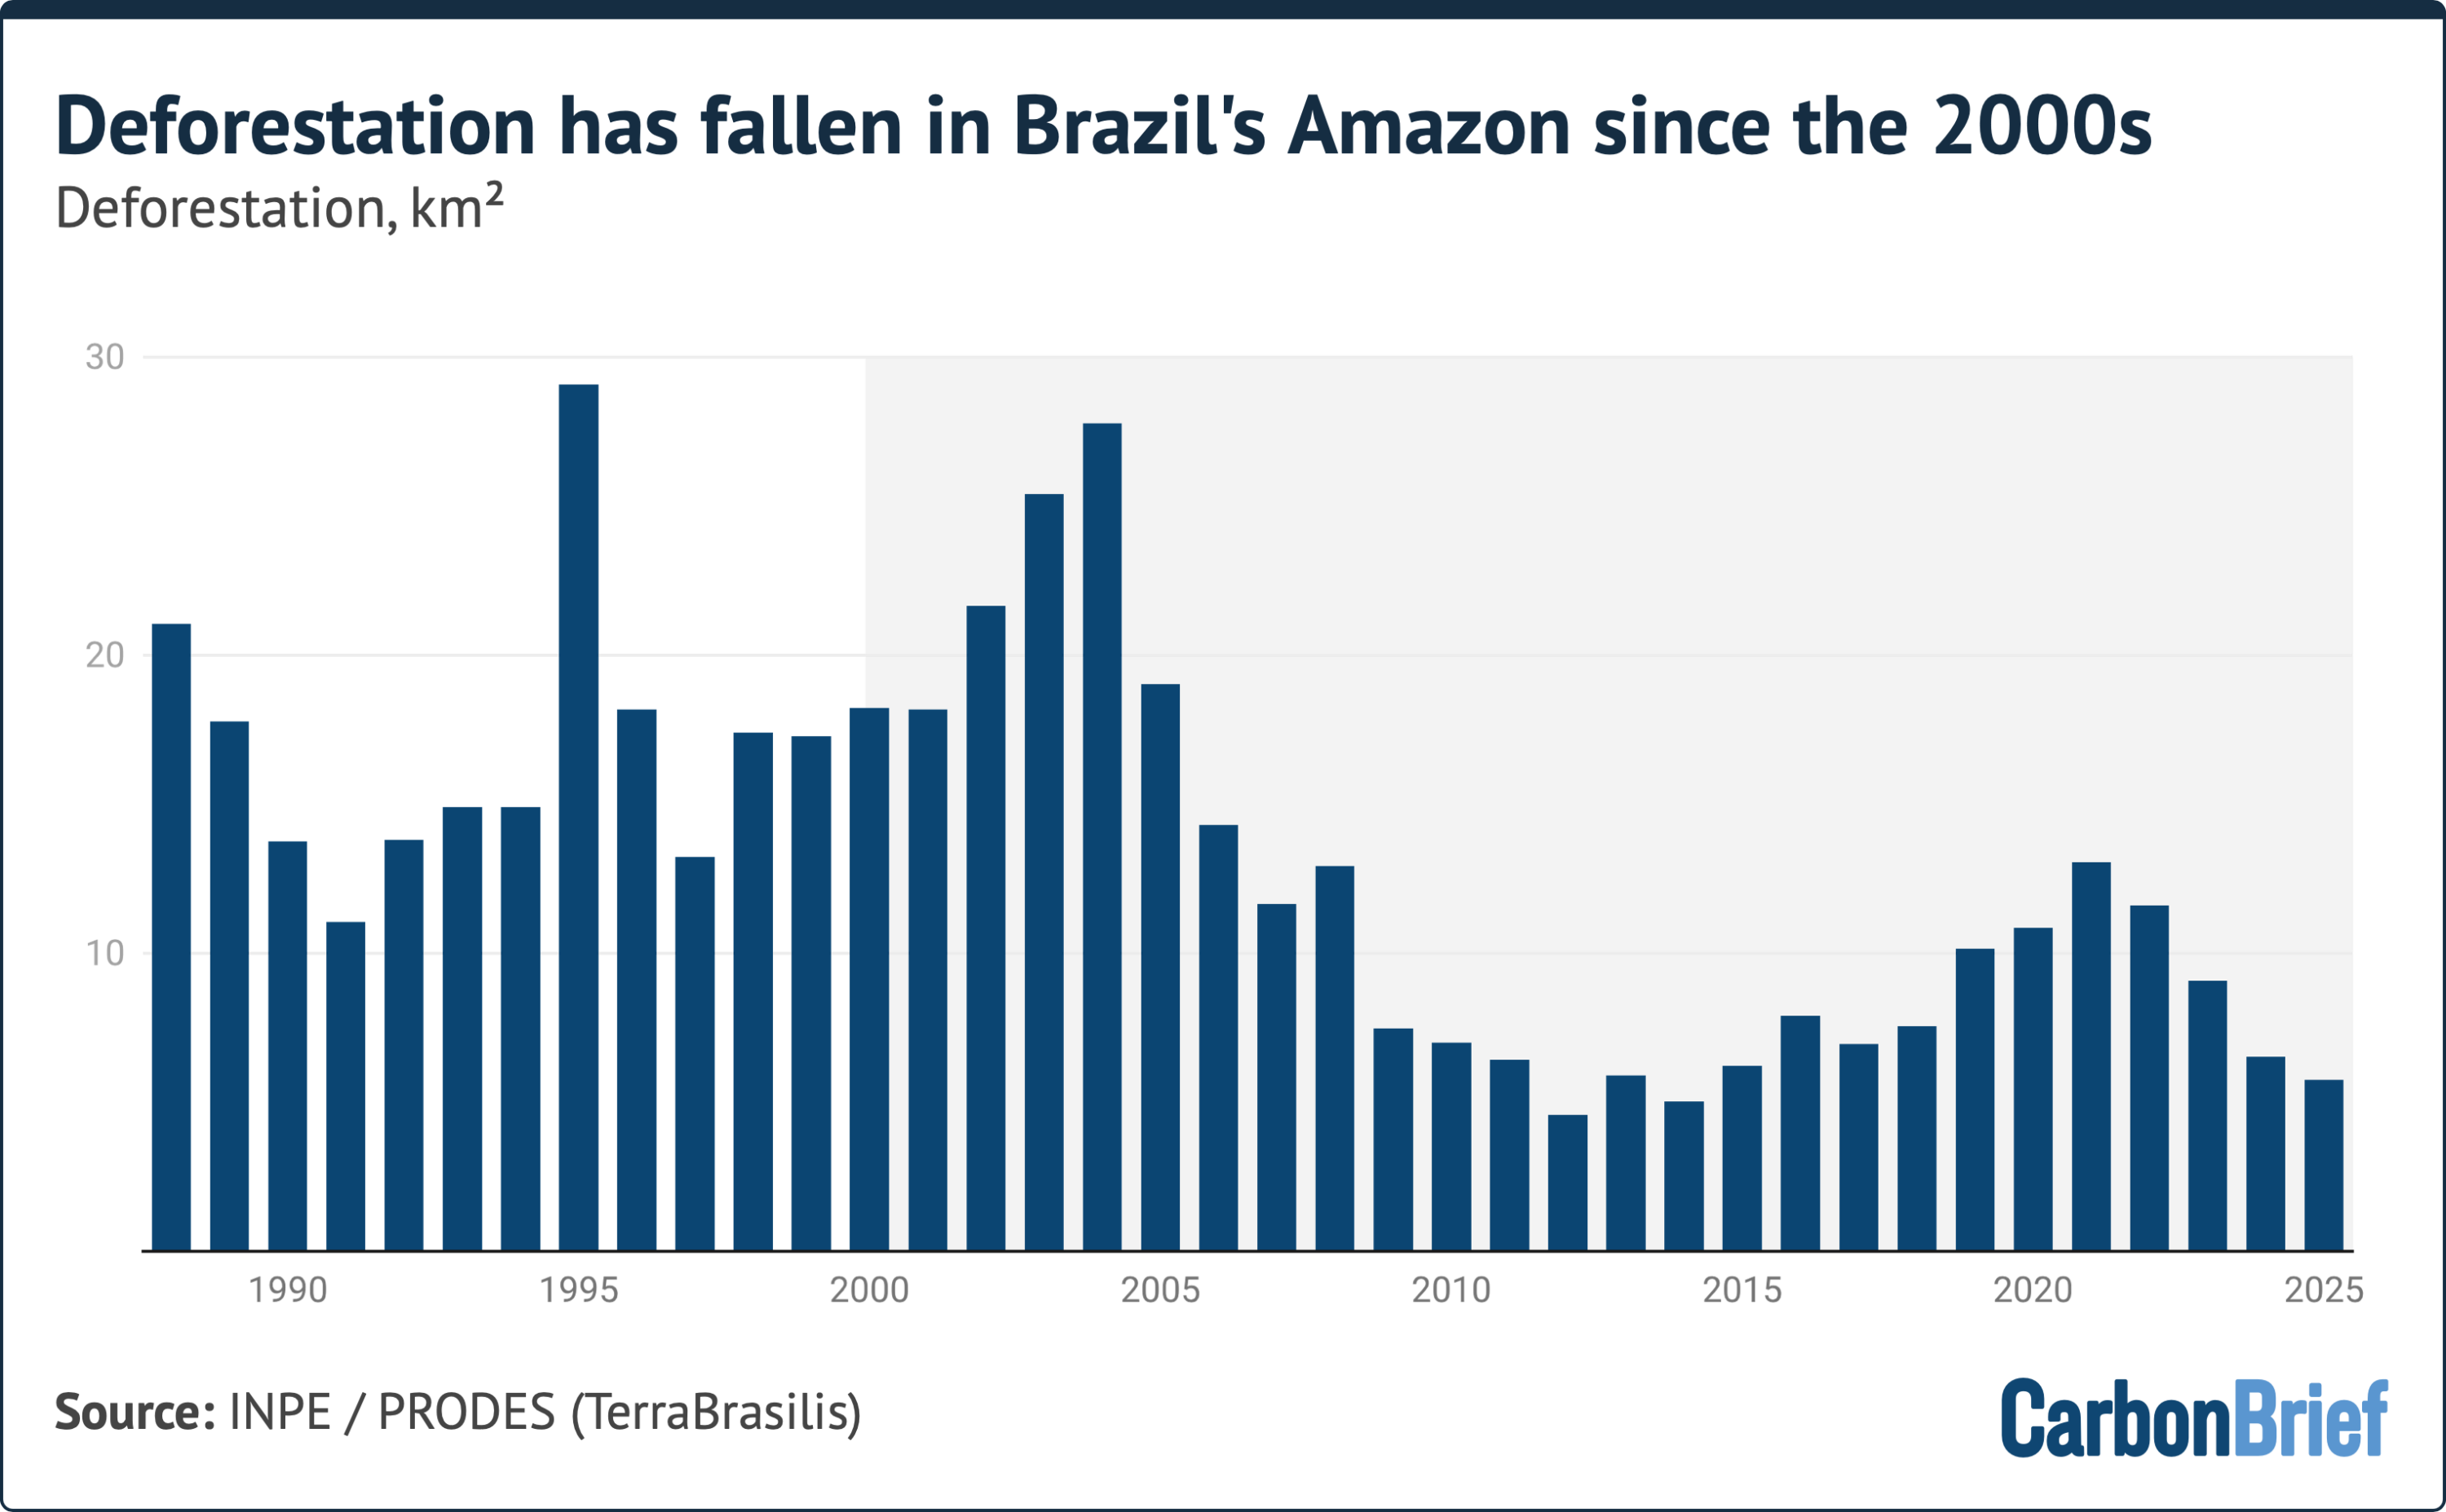
These policies included a 2004 “action plan” for the prevention and control of deforestation in the Amazon, a 2006 soy moratorium, which banned the purchasing and financing of soya produced in deforested areas of the Amazon, as well as the expansion of protected areas across Brazil during the second half of the 2000s.
Prof Julia Pongratz, a professor of physical geography and land-use systems at the University of Munich and contributor to the Global Carbon Budget, says Brazil is the “single most important contributor to the early-2000s global land-use change emissions peak and subsequent decline”.
She says that the largest contributor to an “acceleration” in the decline of global land-use emissions in the past decade has been Indonesia, which she notes has “rewetted more peatland area since 2017 alone than Europe in its entire history”.
Around the world, peatlands are exploited and damaged by humans for a range of purposes, including converting the land for agriculture and peat extraction for horticulture and fuel. Peatland wetting refers to the process of restoring water levels in drained peatlands in order to return them to their natural, waterlogged conditions, which allows for peat formation and carbon storage.
Another reason for Indonesia’s downward trend in land-use emissions is that there have been fewer spikes in emissions caused by fires related to human land-use activities over the last decade, says Pongratz.
Emissions from ecosystem fires are not always counted towards national and regional land-use emissions budgets, which estimate the sum of human-caused emissions. Deforestation fires and those related to peatland drainage are included, whereas fires caused by droughts and heatwaves are not.
Pongratz says it is “hard to separate natural and land-use drivers completely”, given that deforestation and peatland fires often “get out of control and cause spikes in emissions” during dry El Niño conditions.
(For more on uncertainties in land-use emissions data, see: Why are estimates of land-use emissions uncertain?)
Pongratz notes that international trade regulations that have helped to drive down land-use emissions in Brazil and Indonesia have had a lesser effect in the DRC, where the root drivers of deforestation are different:
“Emissions in the DRC have increased, then stayed high in the last two decades. This is partly related to population growth and expanding smallholder and subsistence farming.
“The picture is different in Brazil and Indonesia, which are much more driven by export; international regulations aiming at curbing deforestation thus have larger effects in these countries.”
Which countries are leading on forest regrowth?
Reforestation and afforestation schemes that draw down carbon from the atmosphere have helped to reduce the overall emissions from land-use change over the course of the 21st century.
As noted above, the 2025 Global Carbon Budget report highlights how the removal of carbon from forests offset two-thirds of deforestation emissions over 2015-24.
The report says that China, the EU and US account for the highest levels of carbon sequestration from reforestation and afforestation, collectively drawing 1.1GtCO2 per year over the 2015-24 period.
This, it says, is “partly related to expanding forest area as a consequence of the forest transition in the 19th and 20th centuries and subsequent regrowth of forest”.
The chart below, which draws from the latest edition of the “state of carbon dioxide removal” report, shows how carbon uptake by forests has increased over the last 20 years in a number of countries, most notably in China.
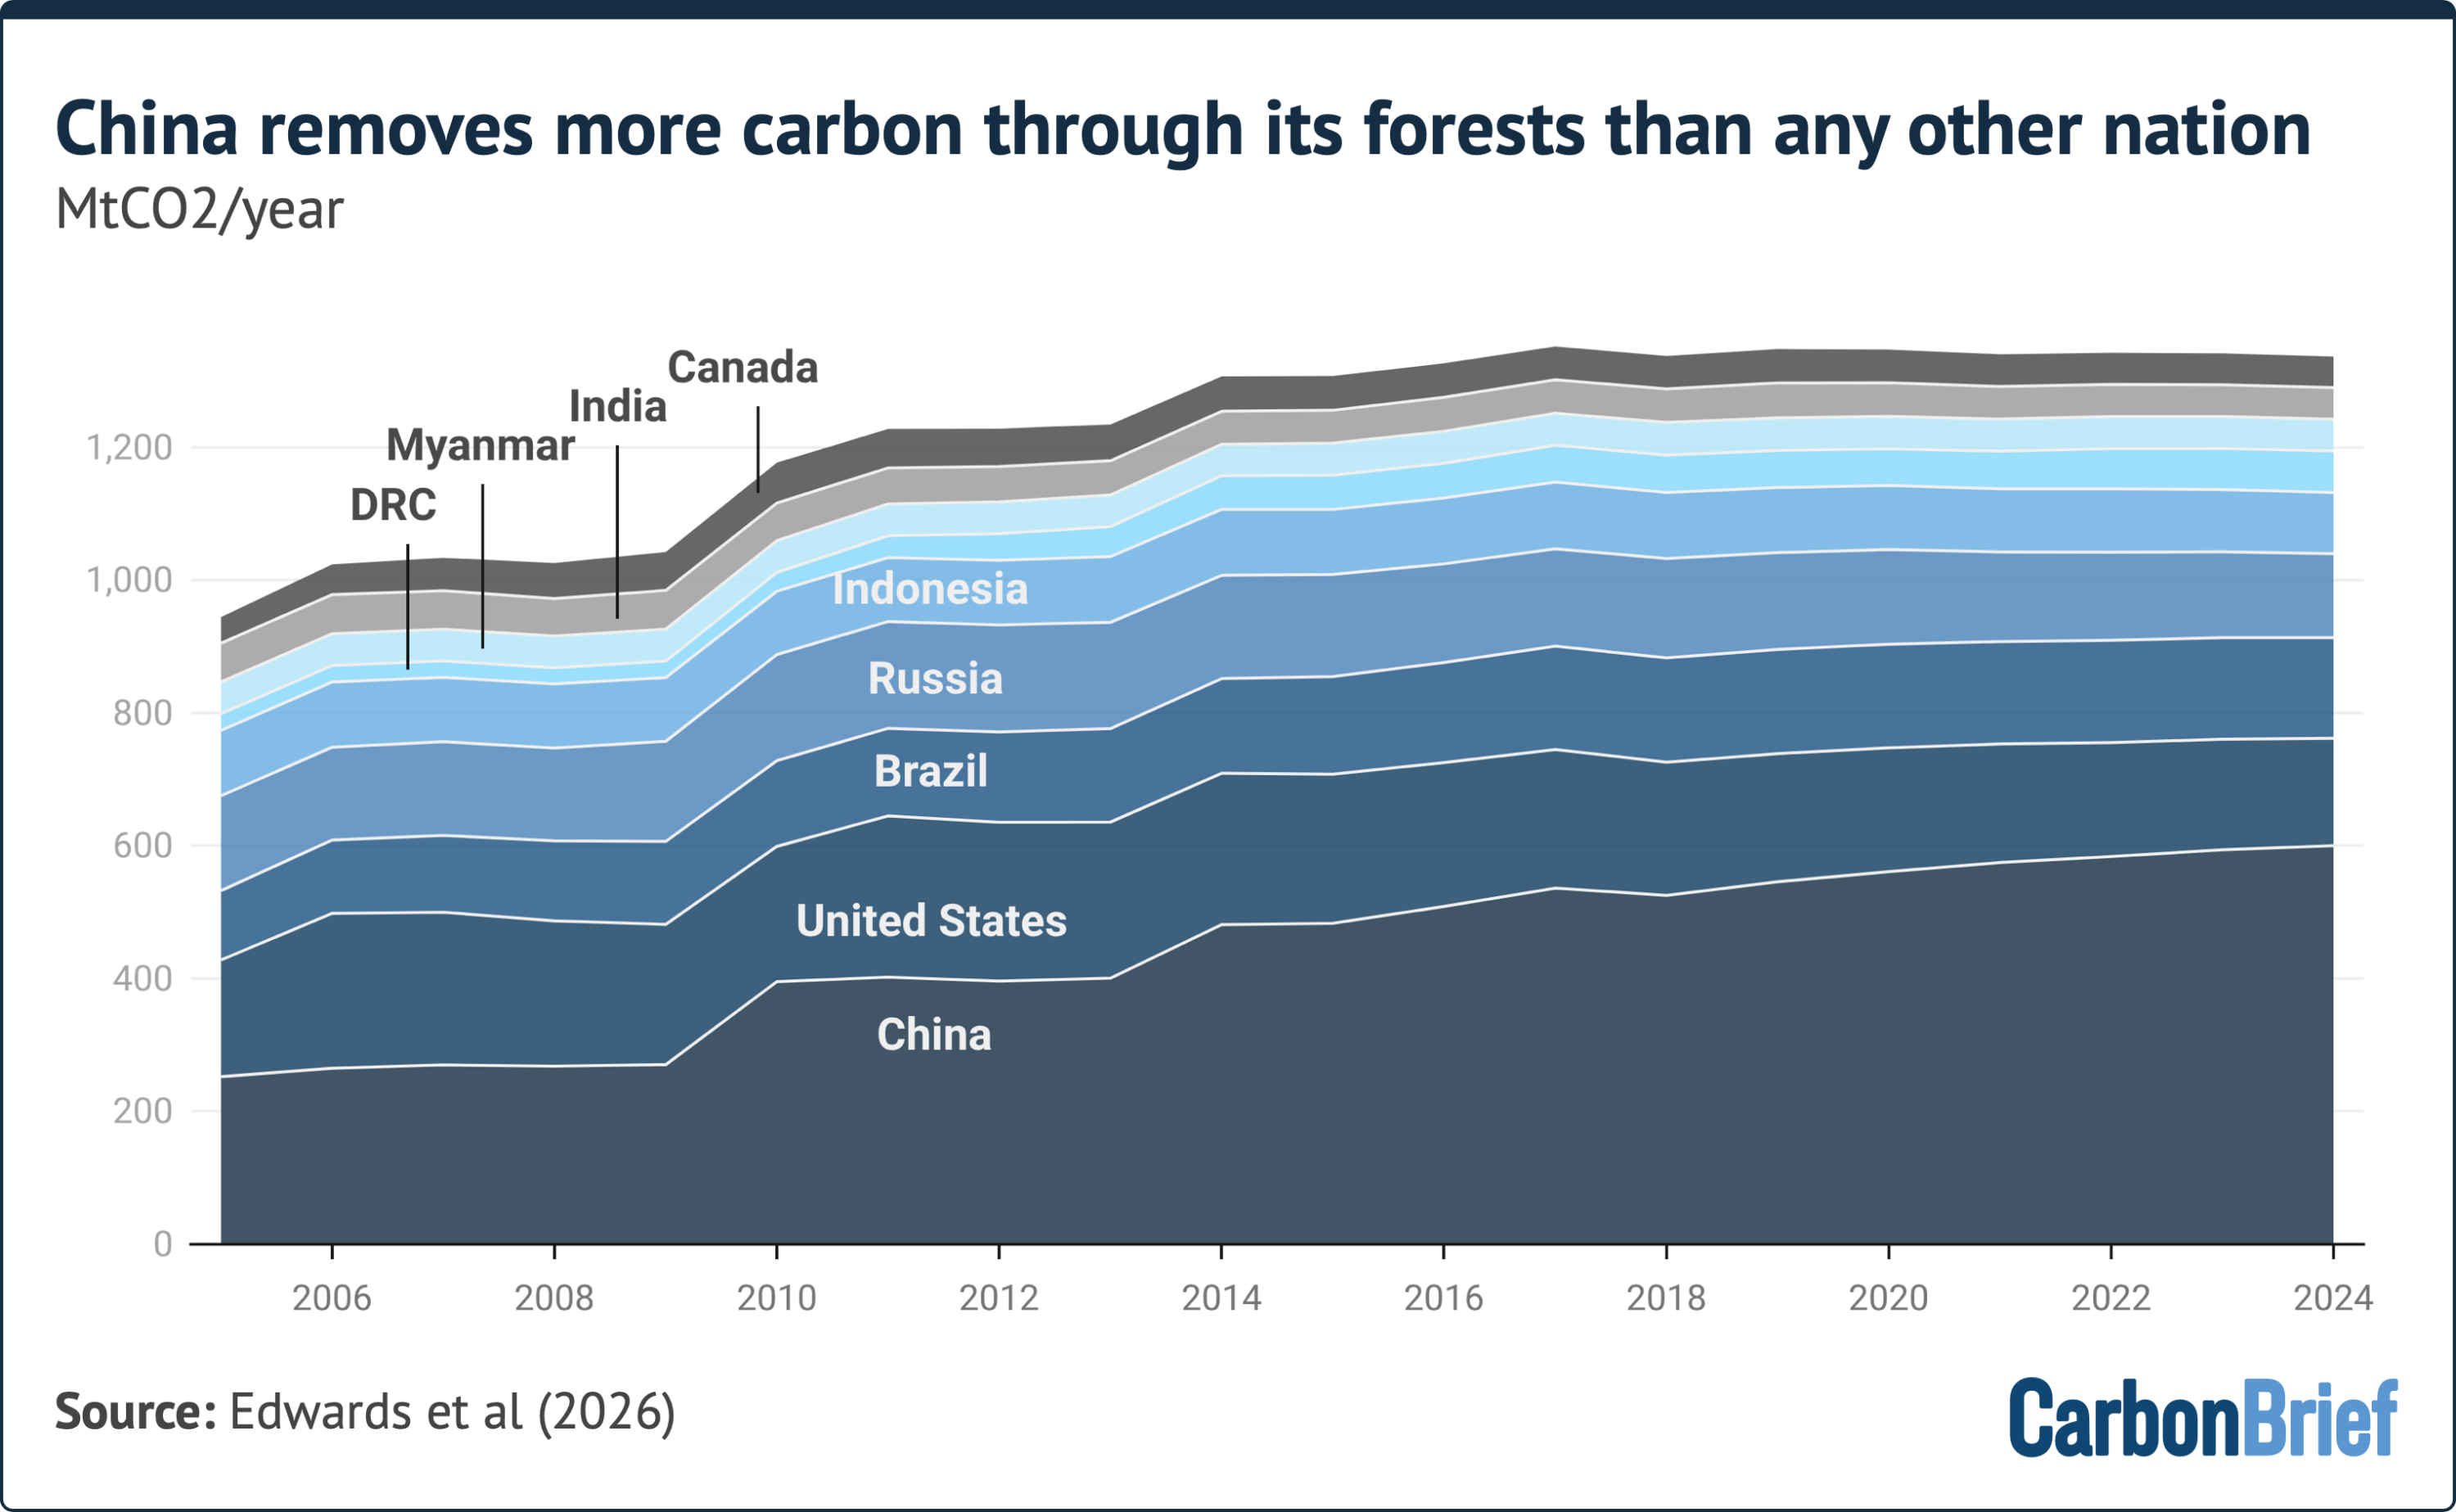
by country, 2005-24. Data from 3rd “state of carbon dioxide removal” report (2026). Chart by Carbon Brief.
In China, a raft of reforestation and improved land management policies were introduced in the 1990s which have led to the rehabilitation of tens of millions of hectares of forests. Research has shown the schemes have significantly increased the country’s uptake of carbon and switched its land from a carbon source to a carbon sink.
The Global Carbon Budget highlights that substantial carbon removal from reforestation and afforestation occurred in other regions, such as Brazil, Russia and Indonesia. However, in these regions, emissions from deforestation and other land-use changes “dominate”, it says.
Why are estimates of land-use emissions uncertain?
Tallying the world’s emissions from land-use change is complex.
The Global Carbon Budget estimates an uncertainty range of 2.6GtCO2 per year for its average annual global land-use emissions figure for 2015-24 – more than half the overall figure of 5GtCO2.
To calculate overall land-use emissions for the annual Global Carbon Budget report, researchers create an average from three land-use models: BLUE, OSCAR and LUCE.
These models combine satellite and statistical information on land cover and land-use changes from global and regional datasets.
Pongratz, who is involved in the LUCE model, explains that scientists can measure the exchange of CO2 between land and atmosphere, but are not able to determine whether CO2 is being released or sequestered from a managed area as a result of human activities or other climate or environmental factors. She continues:
“For this, you need to turn to modelling, where you can isolate drivers – and, again, models are uncertain and the land-use input imperfect. This is why we use all available model estimates – three at the moment.”
The Global Carbon Budget highlights that its three different models treat different components of the land-use emissions “budget” differently.
While models agree “relatively well” about emissions from permanent deforestation, they take different approaches in their approach to shifting cultivation patterns, which increases both emissions and removals, as well as wood harvesting, it says.
Moreover, it notes that land-use emissions and removals occur on different timelines. While carbon removals generated by forest growth and soil recovery are “slow”, there is an “instantaneous component” to emissions from deforestation, it says.
(For more on the challenges in analysing changes to the global carbon cycle, see Carbon Brief’s recent in-depth interview with Prof Philippe Ciais, one of the world’s leading experts on land-use emissions.)
The Global Carbon Budget notes that its confidence in its 2025 projection for overall land-use emissions remains “low” given that the figure is based on deforestation, degradation and peat fire emissions, which are “only a proxy” for land-use change.
The report notes that 2023 is the final year in which it calculates land-use emissions directly from land-use statistics across all three bookkeeping models. For more recent years, full statistics are not yet available across the models and scientists instead turn to short-term proxies.
related

Analysis: Lula presidency saved at least 20,000km2 of Brazilian Amazon since 2022
Factcheck: No, Europe is not having its ‘quietest’ year for wildfires

World falling short on 22 of 23 nature targets for 2030, says draft UN report