Skip to content
Six charts show how clean power was world’s largest source of new energy in 2025
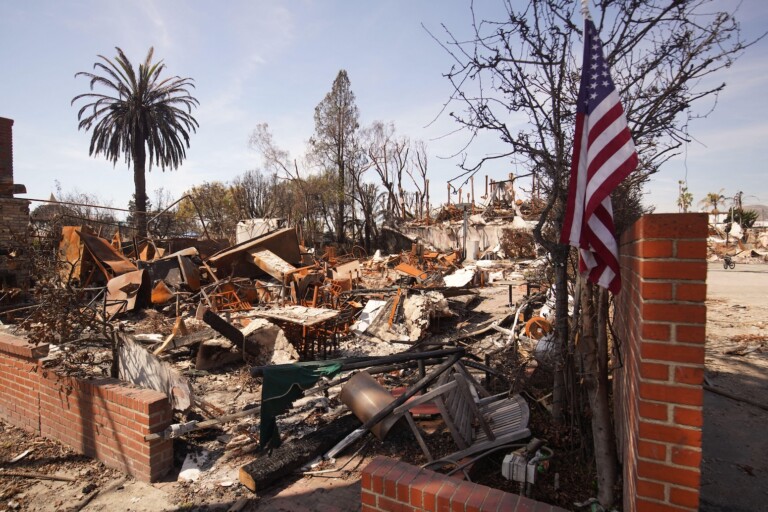
How wildfires and storms drove insurance losses in 2025 – in three charts
State of the climate: 2025 in top-three hottest years on record as ocean heat surges
Analysis: Seven charts showing how the $100bn climate-finance goal was met
UN report: Five charts which explain the ‘gap’ in finance for climate adaptation
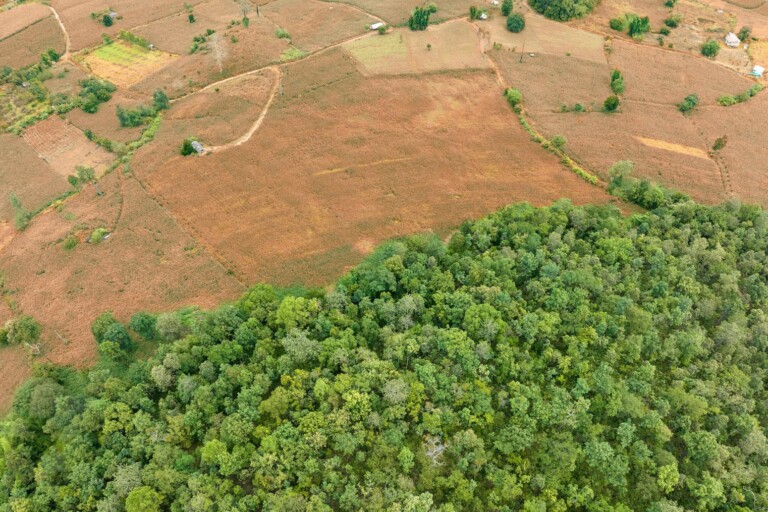
UN report: Five charts showing how global deforestation is declining
AI: Five charts that put data-centre energy use – and emissions – into context
State of the climate: 2025 on track to be second or third warmest year on record
UN report: Five charts explaining the rise of global food insecurity
Chart: Trump’s ‘big beautiful bill’ blows US emissions goal by 7bn tonnes
Chart: UK misses tree-planting targets by forest the ‘size of Isle of Wight’
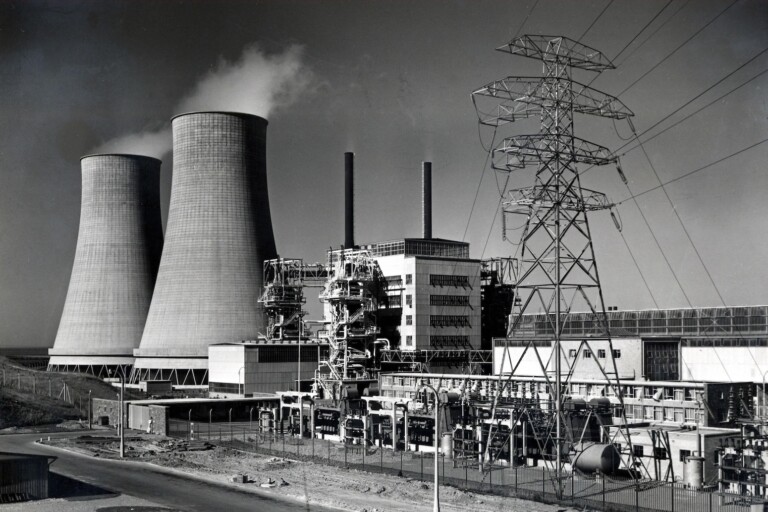
Chart: The rise, fall and rise of UK nuclear power over eight decades
State of the climate: 2025 close behind 2024 as the hottest start to a year
State of the climate: 2024 sets a new record as the first year above 1.5C
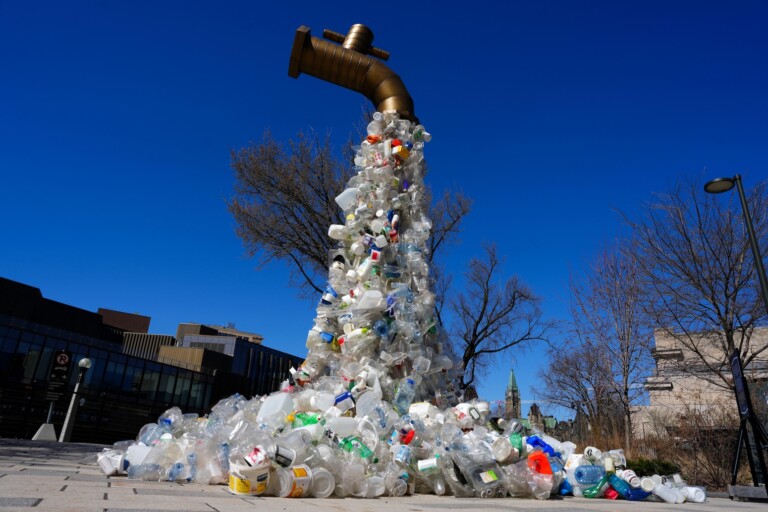
Five charts: Why a UN plastics treaty matters for climate change