Chart: The rise, fall and rise of UK nuclear power over eight decades
Multiple Authors
06.13.25Multiple Authors
13.06.2025 | 1:12pmThe UK’s chancellor Rachel Reeves gave the green light this week to the Sizewell C new nuclear plant in Suffolk, along with funding for “small modular reactors” (SMRs) and nuclear fusion.
In her spending review of government funding across the rest of this parliament, Reeves pledged £14.2bn for Sizewell C, £2.5bn for Rolls-Royce SMRs and £2.5bn for fusion research.
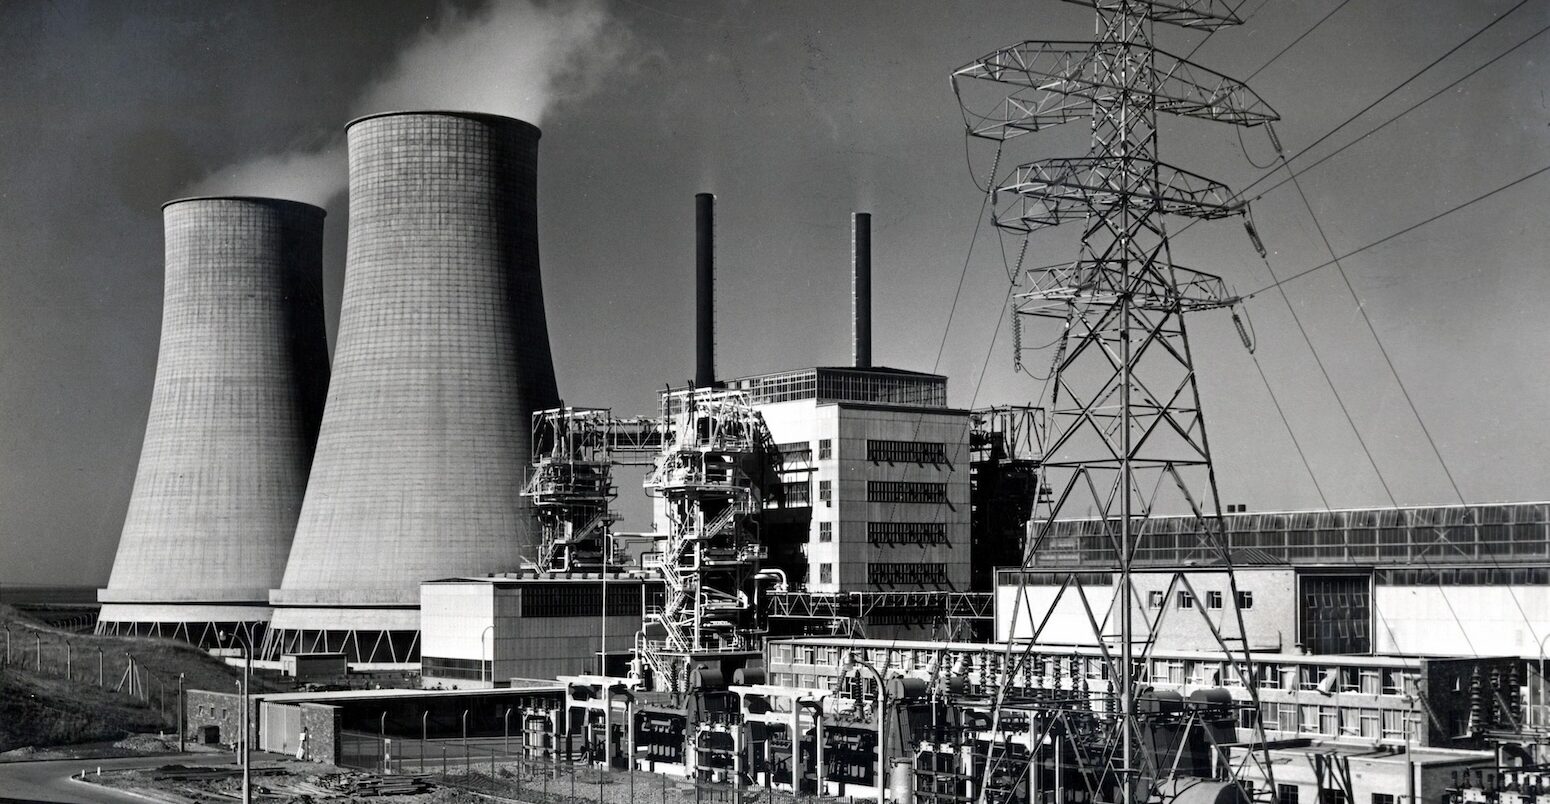
The UK was a pioneer in civilian nuclear power – opening the world’s first commercial reactor at Calder Hall in Cumbria in 1956 – which, ultimately, helped to squeeze out coal generation.
Over the decades that followed, the UK’s nuclear capacity climbed to a peak of 12.2 gigawatts (GW) in 1995, while electricity output from the fleet of reactors peaked in 1998.
The chart below shows the contribution of each of the UK’s nuclear plants to the country’s overall capacity, according to when they started and stopped operating.
The reactors are dotted around the UK’s coastline, where they can take advantage of cooling seawater, and many sites include multiple units coded with numbers or letters.
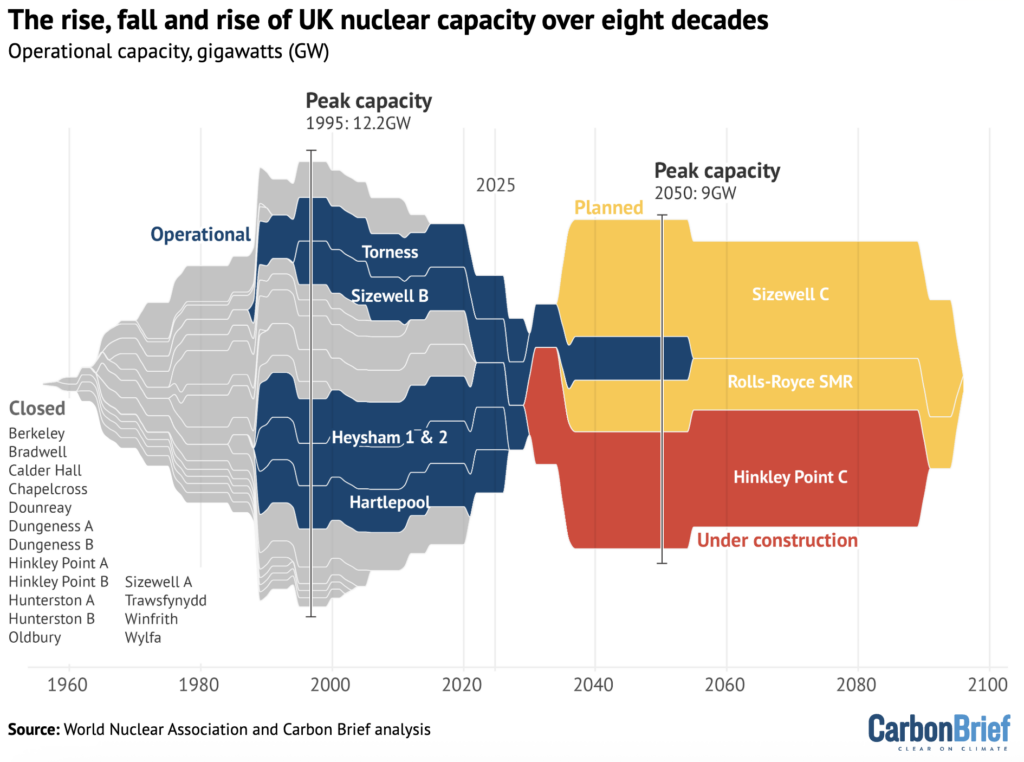
Since Sizewell B was completed in 1995, however, no new nuclear plants have been built – and, as the chart above shows, capacity has ebbed away as older reactors have gone out of service.
After a lengthy hiatus, the Hinkley C new nuclear plant in Somerset was signed off in 2016. It is now under construction and expected to start operating by 2030 at the earliest.
(Efforts to secure further new nuclear schemes at Moorside in Cumbria failed in 2017, while projects led by Hitachi at Wylfa on Anglesey and Oldbury in Gloucestershire collapsed in 2019.)
The additional schemes just given the go-ahead in Reeves’s spending review would – if successful – somewhat revive the UK’s nuclear capacity, after decades of decline.
However, with the closure of all but one of the UK’s existing reactors due by 2030, nuclear-power capacity would remain below its 1995 peak, unless further projects are built.
Moreover, with the UK’s electricity demand set to double over the next few decades, as transport, heat and industry are increasingly electrified, nuclear power is unlikely to match the 29% share of generation that it reached during the late 1990s.
There is an aspirational goal – set under former Conservative prime minister Boris Johnson – for nuclear to supply “up to” a quarter of the UK’s electricity in 2050, with “up to” 24GW of capacity.
Assuming Sizewell B continues to operate until 2055 and that Hinkley C, Sizewell C and at least three Rolls-Royce SMRs are all built, this would take UK capacity back up to 9.0GW.
Methodology
The chart is based on data from the World Nuclear Association, with known start dates for operating and retired reactors, as well as planned closure dates announced by operator EDF.
The timeline for new reactors to start operating – and assumed 60-year lifetime – is illustrative, based on published information from EDF, Rolls-Royce, the UK government and media reports.


This article was written by Simon Evans. Data analysis was carried out by Ho Woo Nam. Visuals by Tom Prater.