UK homes are using less energy than they used to. Demand for energy had been rising inexorably for decades, but has fallen about 11 per cent over the last ten years. So what changed? And will the trend continue?
At a conference last week energy secretary Ed Davey spoke of his desire to create an “energy saving society”. Homes are using around a fifth less energy than they were in 2004, he said, and still more could be done.
A minor quibble with Davey’s figure is that overall household energy demand in 2013 – the latest year available – was only 11 per cent below 2004 levels. Only in the particularly warm year in 2011 was demand 20 per cent down.
Still, demand really is falling. This is particularly impressive as the number of households is 6 per cent higher than it was in 2004.
Falling demand
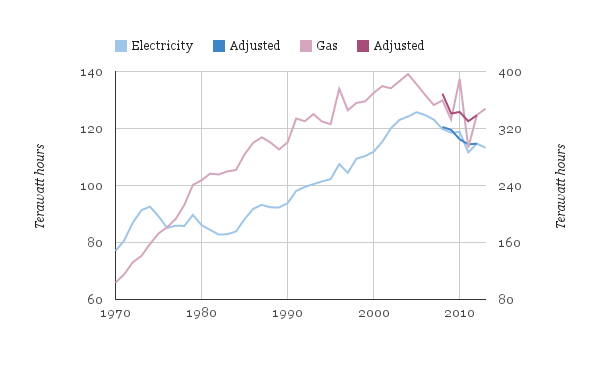
The chart below shows that UK household electricity use peaked in 2005 (blue lines). UK household gas use (pink lines) peaked a year earlier, in 2004. DECC now produces adjusted figures that account for higher energy needs in cold weather. These adjustments (darker lines) smooth out temperature effects.
It’s worth noting that UK homes use about three times more energy from gas (right axis) than from electricity (left axis). So falling gas demand has had a much bigger overall impact.
High-level head-scratching
The drop in demand is causing some high-level head-scratching. There are plenty of ideas about what the reasons might be, but much less clarity about which is most important.
“The short answer is that no-one knows,” says Guy Newey, head of energy and environment for centre-right thinktank Policy Exchange. He looked into the question last year but did not find good data.
The head of energy regulator Ofgem Dermot Nolan says “energy usage is falling but it’s not well understood how or why.” Energy efficiency improvements are part of the reason, he suggests.
The Committee on Climate Change tells Carbon Brief:
“We know that falling demand is combination of economic weakness, energy efficiency policy, higher energy prices and, possibly, non-price behaviour change – but questions remain around the relative contributions of those.”
To try and assess the different factors, we’ve taken a look into this treasure trove of data from DECC, and identified a number of things that are cutting energy use.
Energy-efficient appliances
This chart shows the energy rating of installed home refrigerators from A++ down to G. The growing number of more efficient A-rated appliances (blue wedges) replacing old, unrated models (grey area) means that the nation’s fridges are getting more efficient.
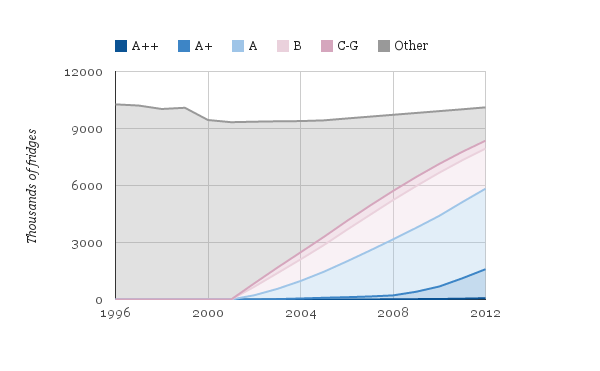
A similar pattern can be seen for many other white goods such as ovens, dishwashers and washing machines.
A lot of the change is down to manufacturers building more efficient models. Cost and desirability tend to trump energy efficiency when consumers make a purchase, according to National Grid head of energy strategy and policy Richard Smith.
Still, some consumers will be making use of EU-mandated energy labelling rules to buy greener models in the expectation that they will use less power and so be cheaper to run. Last year John Lewis started labelling goods with their lifetime running costs to make this point more forcefully.
Bye-bye incandescent lightbulbs
Lighting efficiency has improved particularly rapidly over the past decade because of EU rules that banned inefficient incandescent bulbs, forcing a shift to compact fluorescents. Halogen lamps will be next to be phased out, while super-efficient LEDs are becoming cheaper and more popular.
The amount of energy used by home lighting fell by 4,000 gigawatt hours (22 per cent) between 2000 and 2012 according to Oxford University energy expert Dr Brenda Boardman. As LEDs grab more market share this could fall another 90 per cent, she says.
For all that extra efficiency there are some countervailing pressures. Electricity demand for home electronics and computers was up 17 and 45 per cent respectively between 2004 and 2012, for instance.
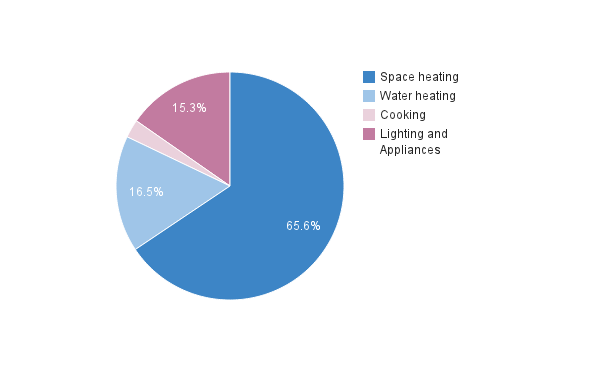
Remember though that electricity use is only a small part of home energy demand. The chart below shows home energy demand according to use. It is based on modelling because accurate figures are not available and each home is different.
However everyone agrees that heating rooms (dark blue) and water (light blue) uses the lion’s share.
More insulation, better boilers
The chart below shows estimated home energy efficiency ratings for the UK’s housing stock. 70 per cent of homes in 2012 scored a ‘D’ or above (blue areas) compared to just 45 per cent in 2008. The proportion of homes rated E, F or G is shrinking (purple areas). So UK homes seem to be getting more efficient over time.
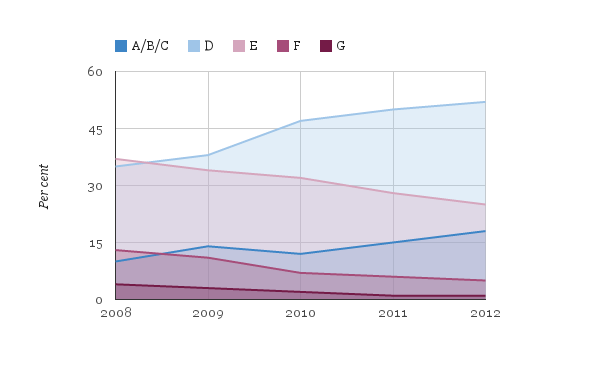
Source: English Housing Survey 2013, DECC and Fuel Poverty Report 2014, DECC
Energy efficiency rating improvements are mainly down to a combination of better insulation, more double glazing and newer boilers. The proportion of lofts with recommended 125 millimetres of insulation increased by 60 per cent in the five years to 2013 for instance.
And an increasing proportion of homes have efficient condensing gas boilers. This chart shows the number of UK home with different types of boiler. Since around 2004 efficient condensing boilers (blue wedge) have been increasingly replacing older standard boilers and combi boilers that heat water and rooms (pink and purple areas):

Rarely noted regulations mean new boilers are much more energy efficient. Replacing old, inefficient boilers has saved 30,000 gigawatt hours of energy each year since 2005 according to National Grid. That’s 9 per cent of current domestic gas demand. This annual saving could rise to 40,000 gigawatt hours each year by 2030.
Most of the improvement in average home energy efficiency ratings must be coming through retrofits of older homes. New-build houses are typically much more energy efficient. But the chart below shows the age of construction of the UK’s housing stock – with new-build (blue wedge) adding to, not replacing old stock in purple.
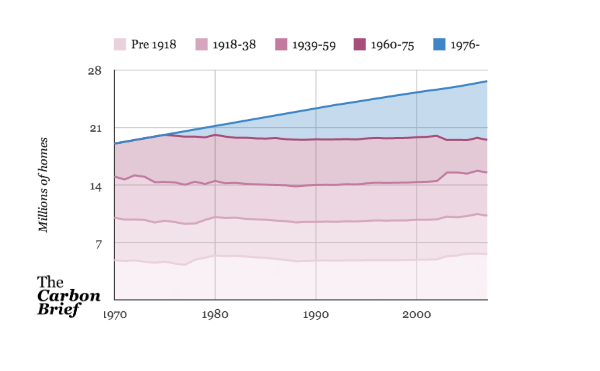
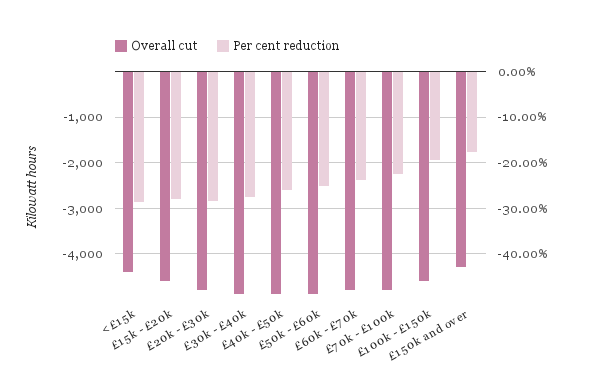
The change in home energy efficiency ratings should have reduced the energy needs per square metre of each home by around a quarter between 2008 and 2012. In fact, home gas demand fell by around this amount over a slightly different time period from 2005 to 2011 (pink bars, below).
The cost of keeping warm
One obvious reason why energy use might fall is rising prices. The chart below shows that electricity prices (blue) and those for gas (purple) have risen sharply since around 2004.
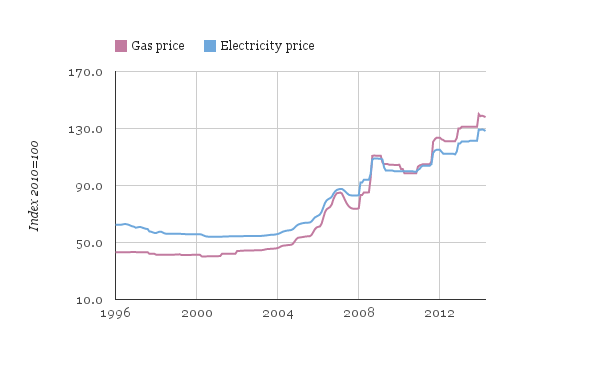
Source: Monthly energy price statistics, DECC
Rising prices may well have led people to use less. As prices rose, the overall fall in gas demand (purple bars, above) was greatest for middle income households. High income homes were probably more able to absorb the extra cost of rising prices without changing their behaviour. And low income households may have been unable to make large cuts because a certain amount of heat, hot water and gas for cooking is close to essential.
There could be other reasons: Middle income homes may have installed more energy efficiency measures than others, or may have been wasting more energy before, and had more potential to save energy by being careful.
But there are certainly indicators that the economic crisis has played an important part in curtailing energy use. Relatively speaking lower income households have seen their gas use fall by a larger proportion than any other group. Fuel Poverty Advisory Group head Derek Lickorish says there was a 29 per cent increase in excess winter deaths last year, a third of which were due to fuel poverty. He has doubts over how much of the recent reduction in energy demand is due to energy efficiency, as compared to an increase in fuel poverty.
The latest official fuel poverty statistics show that the amount of fuel poverty has indeed risen in line with rising prices since 2004, though the number of homes affected has remained relatively steady.
Past performance is not an indicator of future results
Uncertainty remains over the reason for falling domestic energy demand because weighing up the relative impact of all these different factors is really difficult. For instance Richard Smith, National Grid head of energy strategy and policy, tells Carbon Brief:
“What proportion of reduced gas demand is down to insulation versus better boilers is hard to judge. If I had to say I’d go for boilers.”
He thinks both will be important in future, as will lighting. Behaviour change could be significant but Smith is unsure when it will happen at a big enough scale to have an impact. National Grid has done its best to add up past changes so that it can begin to estimate future demand. It will produce updated estimates in a few weeks.
Smith says that the link between rising incomes and rising energy use has been breaking in recent years, in part because of uptake of more efficient appliances and lighting, a trend that is expected to continue.
National Grid expects electricity demand to continue falling unless electric vehicle and electric heating start to take off, which may happen towards the 2030s.
Gas demand should fall too, it thinks, as insulation and boiler improvement continue. Household gas use will be between 6 and 12 per cent below 2012 levels in 2020, National Grid thinks. By 2030 it will be between 4 and 25 per cent lower.
Part of this range is because of “considerable uncertainty” over how effective the Green Deal and Energy Company Obligation will be. These are currently the government’s main policies to improve the energy efficiency of existing homes.
Both have had struggles over the past year. Not even DECC expects them to have much impact between now and 2020, when the UK must meet an EU energy efficiency target to have cut demand by 1.5 per cent per year on average relative to the 2010-2012 average.
Instead DECC thinks stricter building regulations will meet much of the UK’s 2020 target. But given the lack of penetration of new build houses in the chart above, this seems optimistic.
Finally the EU is thinking about whether – and how – to introduce a new legally binding energy efficiency target for 2030. This could put a renewed focus on UK energy efficiency policies.