Analysis: How 2015 became the hottest year on record
Roz Pidcock
01.20.16Roz Pidcock
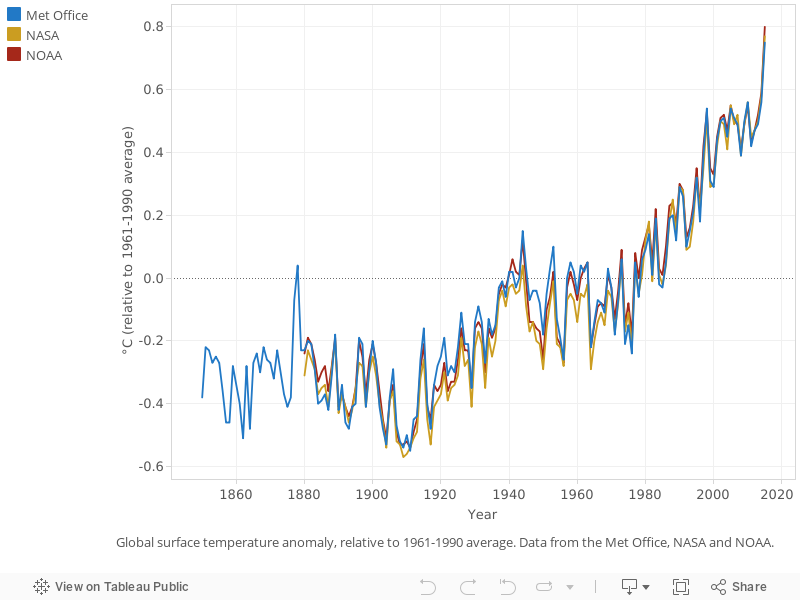
20.01.2016 | 3:30pmLast year topped the chart as the warmest year in the modern record, according to data released today by the world’s top meteorological agencies.
Global temperature in 2015 was 0.75C above the 1961-1990 long-term average and a full 1C above preindustrial times, according to official figures from the UK’s Met Office.
The two major US meteorological agencies – NASA and the National Oceanic and Atmospheric Administration (NOAA) – also confirmed 2015 as the warmest year on record. Dr Gavin Schmidt, Director of the NASA Goddard Institute of Space Studies, said:
2015 was remarkable even in the context of the larger, long-term warming trend.
In a joint summary with former head of NASA GISS, Dr James Hansen, Schmidt says 2015 global temperature “smashed the prior record” and “should practically terminate” discussion of any slowdown in the pace of global warming.
The World Meteorological Organisation – which makes an annual statement based on all three major datasets – said the global average surface temperature in 2015 broke all previous records by a “strikingly wide margin”, noting that fifteen of the 16 hottest years on record have all been this century.
Rising greenhouse gases and a “small contribution” from the El Niño in the Pacific combined to cause the record temperatures in 2015, the Met Office’s Prof Adam Scaife tells Carbon Brief.
There is unlikely to be any respite – scientists expect 2016 to be even warmer than 2015, says Scaife.
Overall, we expect El Niño to contribute around 25% to what will most likely be a new record global temperature in 2016.
Forewarning
Each year, the world’s major meteorological organisations calculate the global average surface temperature. It’s one measure of how the world is responding to greenhouse gas emissions.
Well before the end of 2015, it was looking likely that it would end up as the hottest year on record by quite some margin.
In an announcement timed to coincide with the UN climate talks in Paris in early December, the World Meteorological Organisation (WMO) said it expected 2015 to be the first year to see global temperatures rise 1C above preindustrial levels.
The Met Office predicted at the end of 2014 that 2015 would be among the hottest years on record, with global temperature likely to fall within the range 0.52-0.76C above the 1961-1990 average. The actual observed temperature anomaly of 0.75C is at the upper end of that range.
From this point of view, today’s news that 2015 was the hottest year on record comes as no great surprise. Perhaps what’s most remarkable is how much hotter it has been.
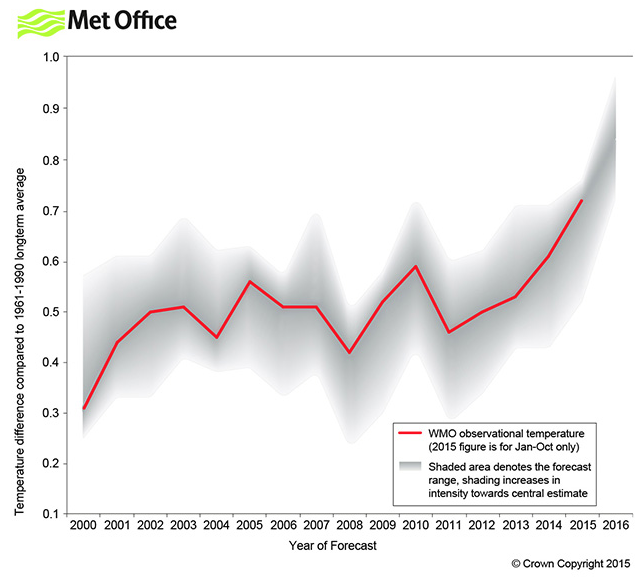
How the Met Office’s annual forecasts (grey shading) compare to actual observed temperatures (red) since 2000. The prediction for 2016 is another year of record-breaking warmth, with global temperature expected to fall within 0.72-0.96C above the 1961-1990 average. Source: Met Office.
Levels of confidence
Measuring global temperature is complicated. Scientists’ estimates come with a range of possible temperatures either side of a central figure, to reflect that uncertainty.
While today’s announcement puts 2015’s global temperature at 0.75C above the 1961-1990 long-term average, the scientists say it could realistically be as low as 0.65C or as high as 0.84C.
(Note: The Met Office traditionally uses a 1961-1990 baseline, rather than the less well-defined “preindustrial” level. Where it uses term ‘preindustrial’, this refers to the 1850-1900 average.)
When it comes to temperature rankings, what matters is whether the difference between individual years is more or less than the range of uncertainty. If it’s more, scientists can be confident one year was warmer than the other. If it’s less, they can’t say for certain either way.
But the situation is very clear this year, says Prof Tim Osborn from the University of East Anglia. He tells Carbon Brief:
The HadCRUT4 global temperature record includes the most complete representation available of the various sources of error. Taking these into account, we can confidently say that 2015 was the warmest.
HadCRUT4 is the longest of the three major global time series, extending back to 1850. It is jointly put together by the Met Office and the Climatic Research Unit (CRU) at the University of East Anglia.
The graph below shows global temperatures and associated uncertainty ranges in HadCRUT4 since 2000. You can see the difference between the middle estimates for 2015 and the next warmest year in 2014 is a full 0.18C – over and above the typical uncertainty of 0.1C.
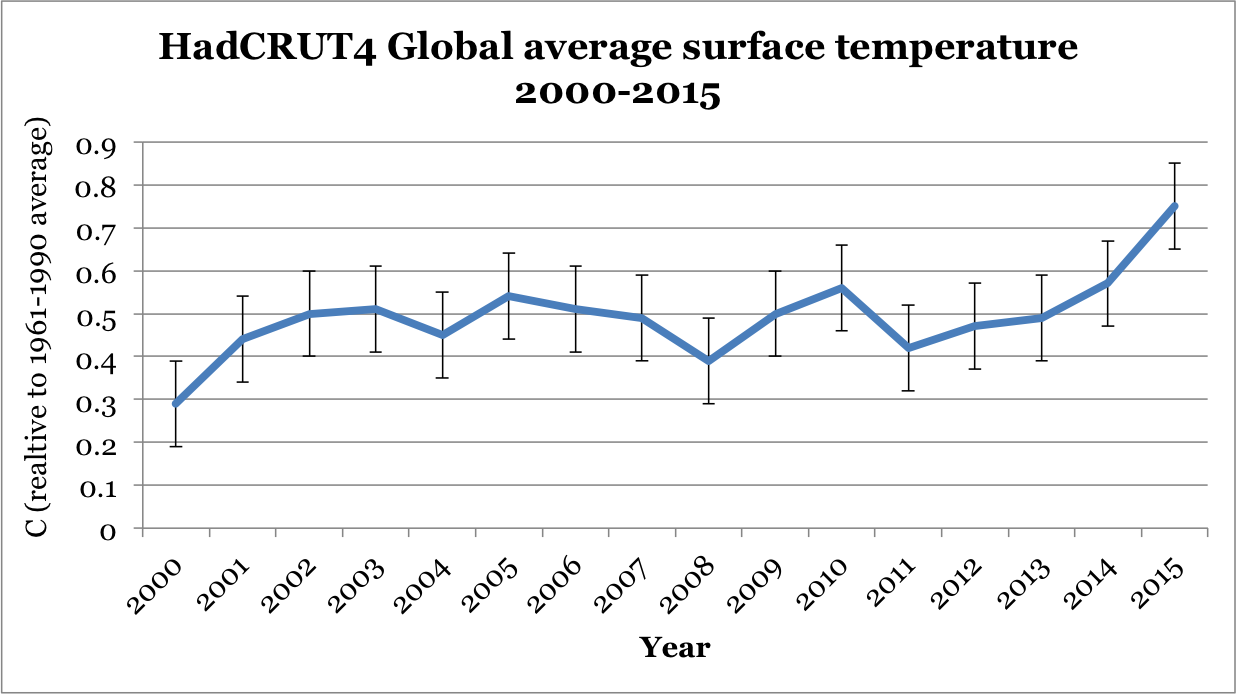
Global average surface temperature in the HadCRUT4 dataset for 2000-2015 (relative to the 1961-1990 average. Error bars represent an uncertainty range of 0.1C. Source: Met Office data, plotted by Carbon Brief.
The only way that 2015 might not be the warmest year on record is if turned out the actual temperature was at the very bottom of the uncertainty range while the temperature for 2014 was at the very top. But the chances of that are extremely small, Osborn tells Carbon Brief:
The slight overlap between the 2015 and 2014 ranges does not undermine our confidence that 2015 is the warmest year on record. For 2014 to be warmest, that would require the combination of two very unlikely events: 2014 to be at the very top of its confidence interval at the same time as 2015 being at the very bottom of its confidence interval.
Dr Thomas Karl, director of NOAA’s National Climatic Data Centre, echoed this point, telling a press conference earlier today that it is ‘virtually certain’ that 2015 is the hottest year on record. But while interest in which years break records is inevitable, understanding climate change means taking a much wider view. Osborn explains:
It is the long-term trend that tells us about climate change, rather than the relative warmth of individual years.
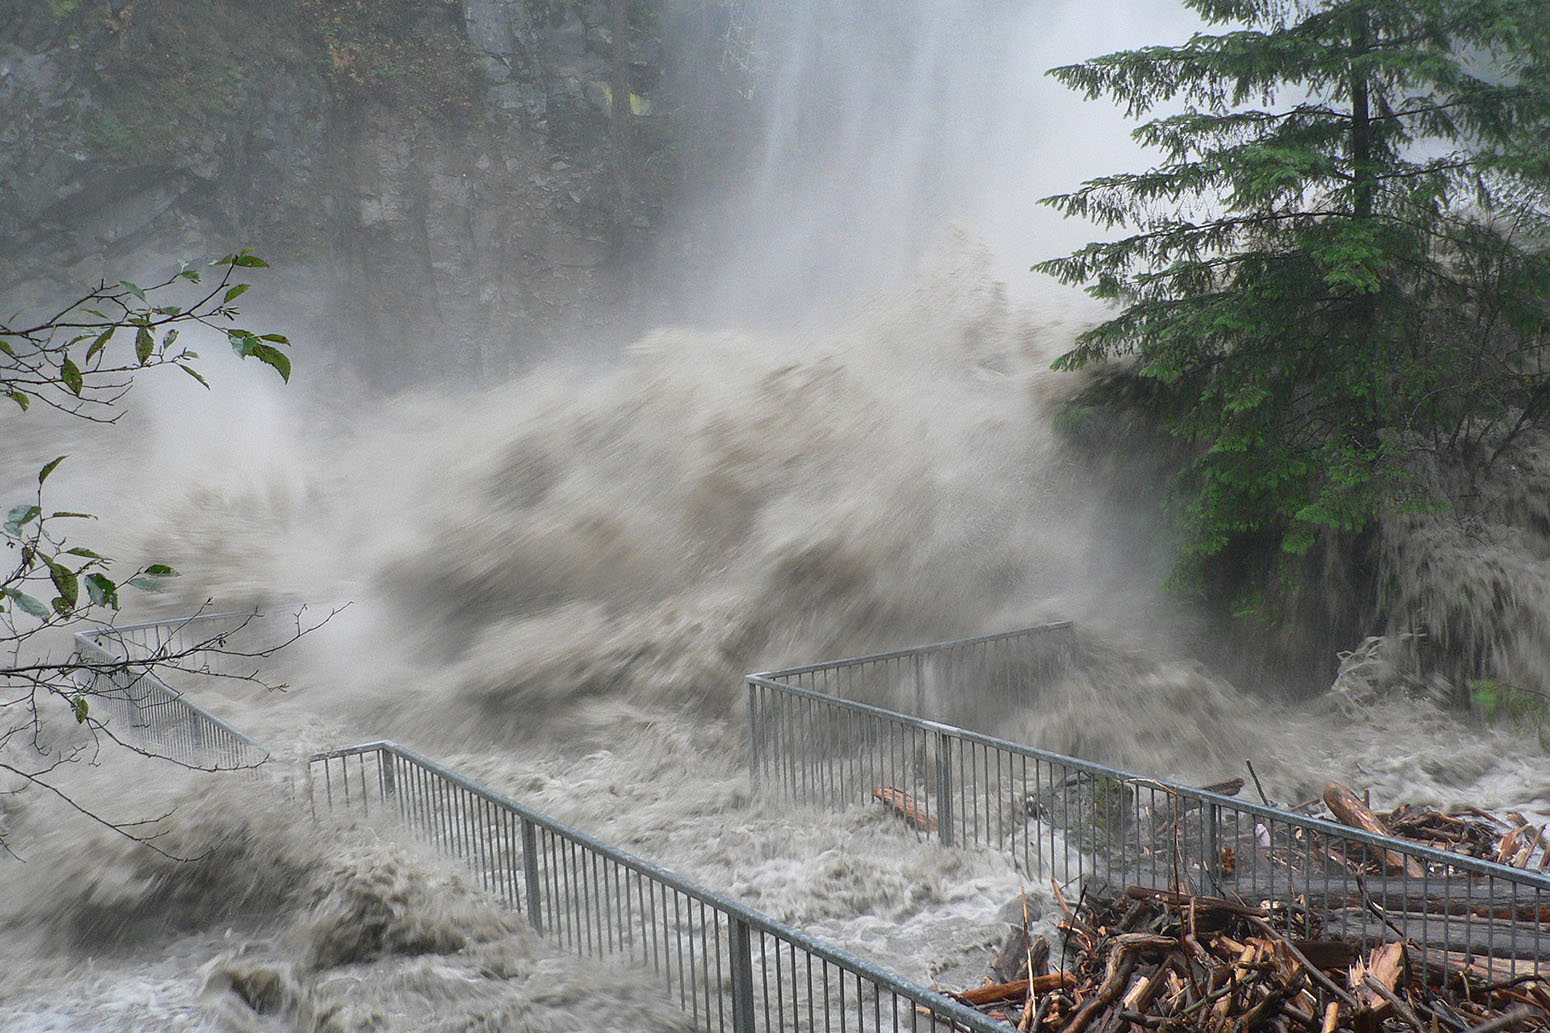
November 2006 flood, Granite Falls on the Stillaguamish River, Washington. A huge El Niño event in the Pacific contributed to record warmth in 2015 and is likely to have a far stronger impact in 2016. El Niño brings extreme weather to many parts of the world. Credit: Walter Siegmund/Wikimedia Commons.
Q&A: A boost from El Niño
As well as being a symptom of the long term warming trend, scientists are interested in 2015 global temperature because of what it tells us about how natural fluctuations in the climate can act to amplify or dampen the warming signal, Osborn explains.
A huge El Niño in the Pacific – among the biggest on record – contributed to the record warmth in 2015, say scientists. In total, 10 out of the 12 months in 2015 either tied with or broke previous records, according to NASA and NOAA’s joint analysis. Since the El Niño only recently reached peak strength, scientists expect its impact to be even larger in 2016.
Carbon Brief asked Prof Adam Scaife, head of long-range forecasting at the Met Office, a few questions about the role of El Niño in the current spell of record-topping warmth.
How do scientists work out the impact of El Niño on global temperature?
Using the historical observational record, which now extends back more than a century, and theoretical computer models, which have been used to simulate even longer periods, we are able to calculate what happens to global temperature in the run up to an El Niño (or La Niña) and in its aftermath. The effects are very clear: there is a little warming in the period preceding the winter El Niño peak, but the big effect on global temperature comes in the following calendar year as it takes a few months for heat to increase in other ocean basins around the world. The bottom line is that for each 1 degree of El Niño the global temperature in the following year rises by about 0.1 degrees.
How much of the record temperature in 2015 was down to El Niño?
El Niño was growing in 2015 and only reached its peak this winter. So, we think El Niño made only a small contribution (a few hundredths of a degree) to the record global temperatures in 2015.
Does that mean human activity was the biggest driver of 2015’s record temperature?
Yes. The nominal record global average temperature of 2015 was well predicted in advance and well explained as being primarily due to global warming, itself mainly due to greenhouse gas emissions of human origin. El Niño made only a small contribution.
What can we expect in 2016?
Given the strength of the current El Niño, we expect 2016 to be even warmer globally than 2015. The lagged effects of El Niño are already starting to appear in the monthly temperature observations which are registering more than 0.8 degrees above norm in recent months. This is consistent with our forecast for unprecedented warmth in the coming year. Overall, we expect El Niño to contribute around 25% to what will most likely be a new record global temperature in 2016. Much of the rest is down to climate change.
——————
Update: This article was updated on Monday 25th January once the World Meteorological Organisation had issued its annual statement.
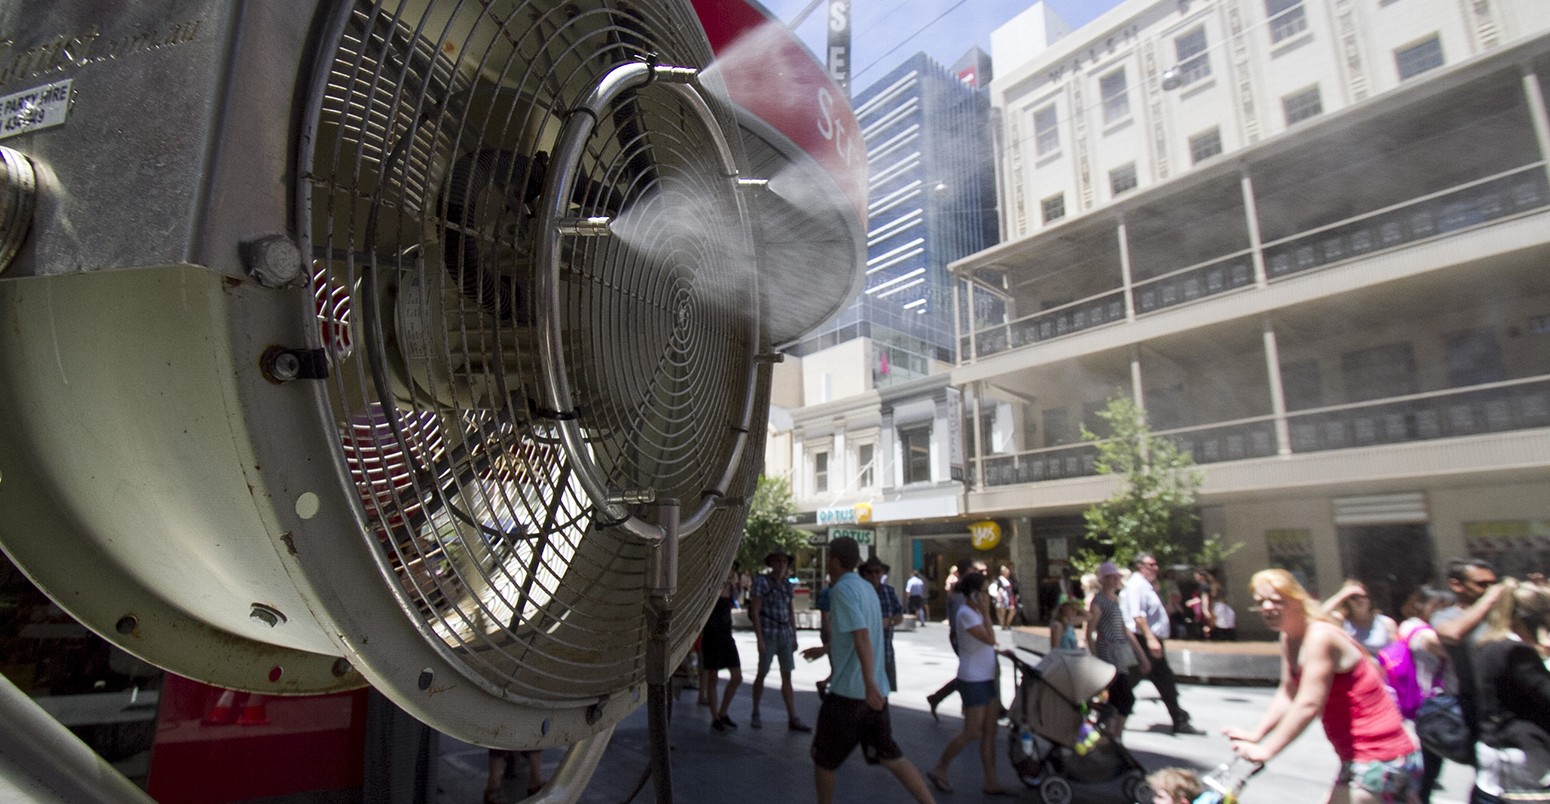
Main image: Adelaide, Australia. 17th December 2015 — Pedestrians walk past a giant fan sending out a cooling mist in the town centre as Adelaide experiences a heatwave. © Amer Ghazzal/Demotix/Corbis.
-
Analysis: How 2015 became the hottest year on record
-
Last year topped the chart as the warmest year in the modern record, according to data released today by the Met Office, NASA and NOAA