Analysis: How much did El Niño boost global temperature in 2015?
Roz Pidcock
01.26.16Roz Pidcock
26.01.2016 | 1:46pmAlmost as soon as the news broke that 2015 was the hottest year in the modern record, the conversation quickly turned to how much of the record-breaking warmth was down to climate change and how much to the Pacific weather phenomenon known as El Niño.
Carbon Brief has spoken to climate scientists working on this question, who all seem to agree El Niño was responsible for somewhere in the region of 10% of the record warmth in 2015.
But while the science seems pretty clear, these numbers got somewhat lost in the media coverage. So, too, did the fact that 2015 was far hotter than the last big El Niño year in 1997 – and that 2015 would still have been a record year even had the El Niño never occurred.
A wide margin
All three of the world’s major meteorological agencies came to the same conclusion last week. NASA, the US National Oceanic and Atmospheric Administration (NOAA) and the UK’s Met Office all confirmed 2015 was the warmest on record and the first year in which global temperature rose 1C above the preindustrial era.
Yesterday, the World Meteorological Organisation – which combines all three agencies’ data into a single definitive statement – agreed that 2015 was a record-breaking year.
As Carbon Brief and many others have noted, it isn’t so much the setting of a new record that is remarkable, but the margin by which 2015 took the top spot.
Combining the three global datasets, global temperature in 2015 was 0.16C above the next warmest year in 2014, a gap the WMO called “strikingly wide”.
Joining forces
Why such a leap? As all the major meteorological agencies noted, in addition to the climb in global temperature caused by greenhouse gases, 2015 was an El Niño year.
El Niño is a weather phenomenon that originates in the Pacific, which tends to increase global temperature for a couple of years by releasing heat from the ocean to the atmosphere. The El Niño that developed in 2015 – which is still underway – is one of the strongest on record.
While scientists have been very clear that El Niño gave global temperature a lift in 2015, the language we’ve seen in the past week or so around exactly how much hasn’t been very specific.
Dr Gavin Schmidt, director of NASA’s Goddard Institute for Space Studies, described the ongoing rise in global temperatures as having had “an assist” from El Niño.
Dr Peter Stott, head of attribution at the Met Office, said the weather phenomenon “has contributed somewhat” to global temperatures that are “generally elevated” as a result of climate change.
And in one of his first official duties as the new secretary-general of the WMO, Petteri Taalas said that El Niño and global warming had “joined forces with dramatic effect”.
With some commentators and climate skeptic websites on social media appearing keen to use the strong El Niño to downplay climate change as a driver of the record-breaking temperatures, the less-than-definite language has led to some speculation and confusion.
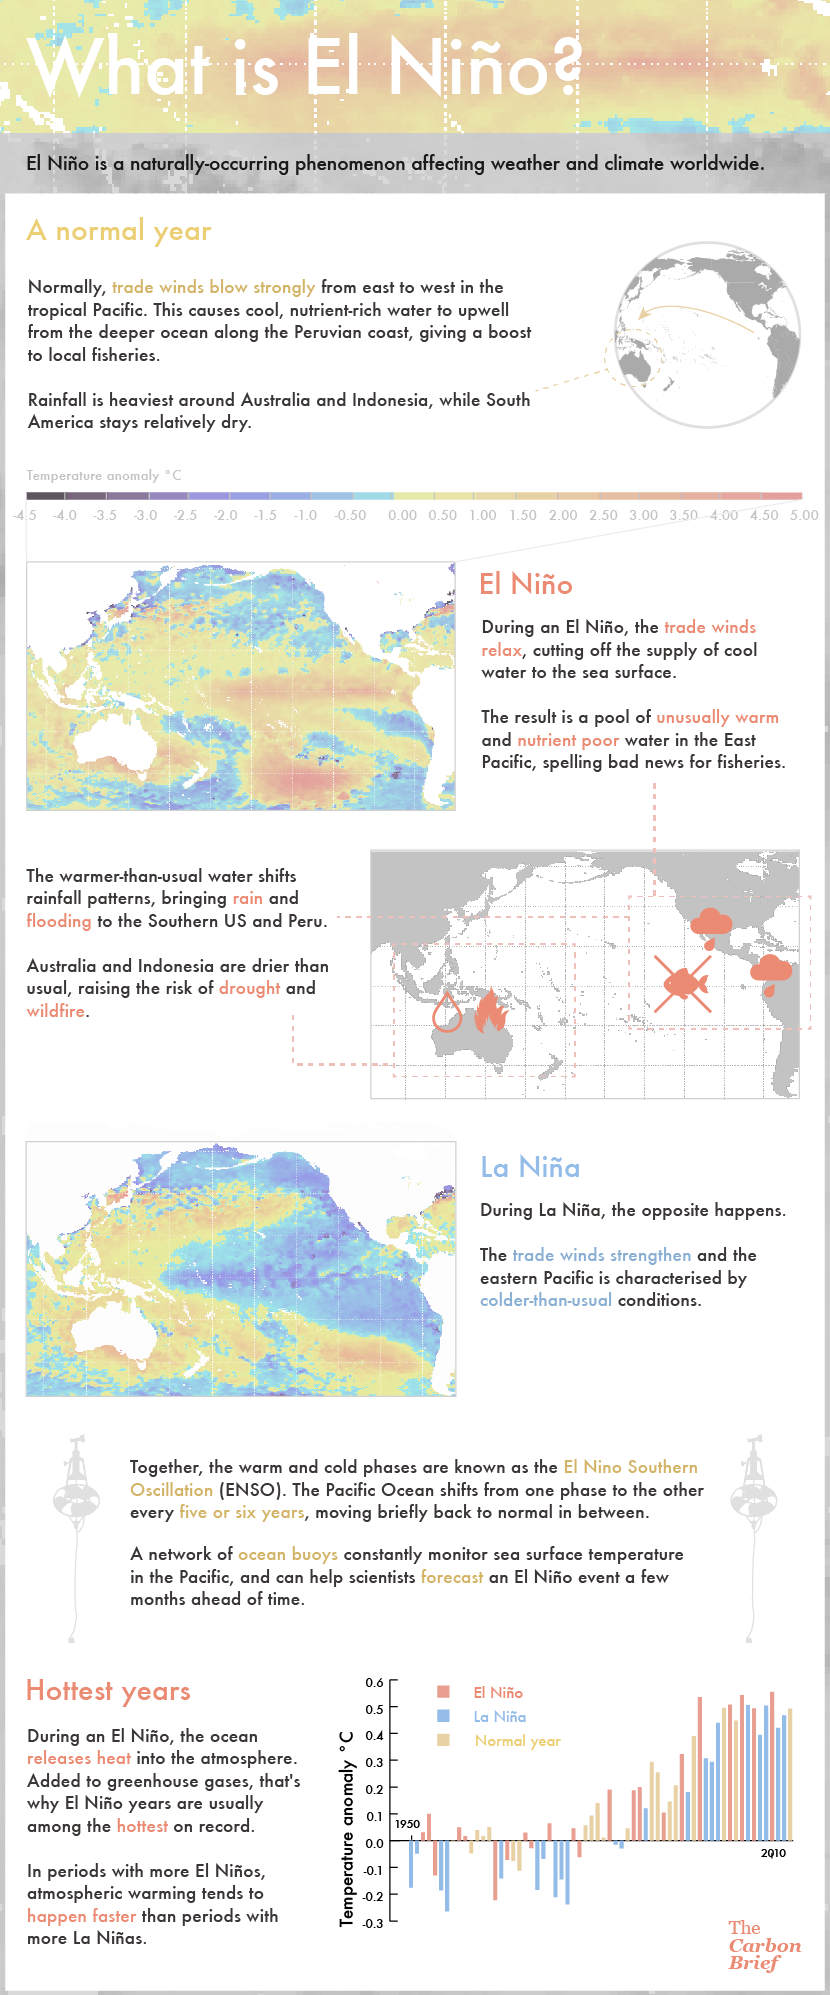
Infographic: What is El Nino? Credit: Rosamund Pearce/Carbon Brief.
“A small contribution”
As part of Carbon Brief’s coverage of last week’s hottest-year news, we spoke to Dr Adam Scaife, head of the Met Office’s long-range forecasting division. Scaife suggested only a cursory role for El Niño, telling Carbon Brief:
We think El Niño made only a small contribution (a few hundredths of a degree) to the record global temperatures in 2015.
While it’s impossible to get an exact answer to “what if El Niño hadn’t happened?”, scientists can make a reasonable estimate based on examining other El Niño years, explained Scaife.
Using the historical observational record, which now extends back more than a century, and theoretical computer models, which have been used to simulate even longer periods, we are able to calculate what happens to global temperature in the run up to an El Niño (or La Niña) and in its aftermath.
NASA’s Dr Gavin Schmidt took a similar approach last week, identifying how monthly global temperatures respond during past El Niños and effectively “removing” that signal from the data.
Schmidt estimated El Niño was responsible for 0.07C of the above-average warming we saw in 2015. In the graph below from Schmidt’s RealClimate article, you can compare the annual mean temperature in the NASA record with El Niño (green) and without El Niño (red).

Comparison of annual mean temperature in the NASA record with El Niño (green) and without El Niño (red). Credit: Dr Gavin Schmidt, NASA.
A record year, even without El Niño
Schmidt’s analysis suggests 2015 would have still been a record-breaking year even without El Niño. After removing the estimated contribution from El Niño of 0.07C, the average global temperature in 2015, according to NASA, would have been 0.8C above the 1951-1980 average.
This is still the warmest year in the NASA record, albeit by only 0.06C – less than the margin of error associated with estimates of global temperature. Schmidt tells Carbon Brief:
“If you take away the El Niño effects, the gap between 2015 and 2014 is smaller…So yes, the likelihood of 2015 being a record in the real world as opposed to just in our dataset goes down a little. It is still the clear favourite though.”
@richardabetts My estimate is 0.07ºC – would still have been a record. @LeoHickman @afneil
— Gavin Schmidt (@ClimateOfGavin) January 22, 2016
Another important point to note is that 2015 was much hotter than 1997 – the year in which we saw the last very big El Niño and the point often cited by climate skeptics as the start of a so called “slowdown” in surface warming.
This should terminate once and for all any ideas of a warming hiatus or slowdown, says Schmidt. He told journalists during a NASA/NOAA press conference last week:
There is no evidence that that warming trend has slowed, paused, or hiatused at any point in the last few decades.
Different method, same result
Schmidt’s analysis uses one indicator of El Niño conditions, known as the “Oceanic Niño index” (ONI). But there are others. A 2011 study by Grant Foster and Stefan Rahmstorf uses a similar approach, but combines several El Niño indicators into a “Multivariate ENSO index” (MEI).
The Met Office’s Prof Richard Betts tells Carbon Brief:
The MEI is based on six variables which can quantify El Niño and La Niña events – sea level pressure, surface winds in both north-south and east-west directions, sea surface temperature, surface air temperature, and the fraction of the sky covered by cloud.
Applying this approach, Dr Thomas Cropper, a climate scientist at the University of Sheffield, has estimated the contribution from El Niño to 2015 temperature. He says it is about 0.09C.
@richardabetts @theresphysics @afneil Using Foster&Rahmstorf method for GISS = ~0.09deg from ENSO for 2015. pic.twitter.com/ZULlSez6wB
— Thomas Cropper (@t_cropper) January 22, 2016
The figure below is a version of one from the 2011 paper, updated by Cropper to include 2015. The top panel shows the effect of El Niño on monthly temperature, where red indicates a boost and blue indicates a dampening (averaging over the full year gives the 0.09C figure.)
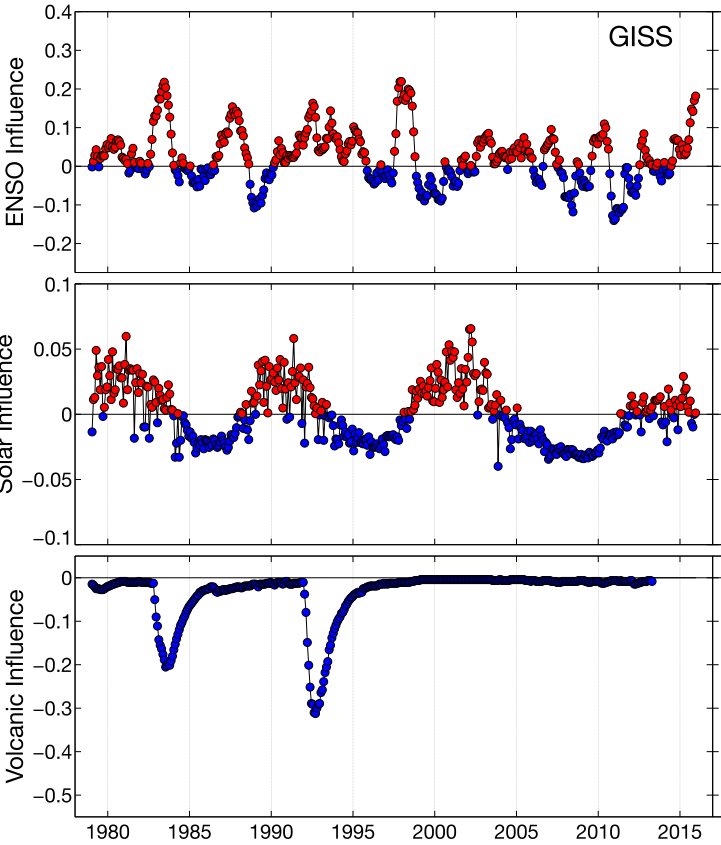
The effect of El Niño on monthly temperature, where red indicates a boost and blue indicates a dampening (averaging over the full year gives the 0.09C figure). Credit: Dr Thomas Cropper, University of Sheffield. Adapted from Foster & Rahmstorf (2011) using NASA Gistemp data up to 2015.
In the region of 10%
A quick comparison of either Schmidt or Cropper’s numbers with NASA’s temperature anomaly for 2015 of 0.87C above the 1951-1980 average suggests El Niño contributed about 8-10%.
That percentage will change, however, depending on the choice of historical baseline. Using a more recent baseline of 1980-2010 makes the El Niño contribution to 2015’s global temperature appear larger – around 16%. Compared to a period indicative of preindustrial times (1880-1900), however, the contribution from El Niño contribution comes out lower – around 6%.
While that makes the percentage exercise less-than-perfect, it is nevertheless indicative of the small contribution of El Niño to the record warmth in 2015, compared to greenhouse gas warming. Stott tells Carbon Brief:
An estimate of less than 0.1C due to El Niño on 2015 global mean annual mean temperatures is less than 10% of the approximately 1C warming of 2015 relative to pre-industrial levels.
In other words, El Niño contributed “a small amount on top” of the warming greenhouse gases are already causing, says Stott.
As ever, it’s important to look at any individual year in the context of the longer trend. A study published yesterday found that there is just a 0.01% chance that the recent run of global heat records could have happened due to natural climate variations alone. Thirteen of the 15 hottest years in the 150-year-long record occurred between 2000-14. Including the data for 2015, which came in after the study was completed, makes the odds even slimmer, say the researchers.
Expect a bigger contribution in 2016
While the El Niño emerged towards the latter part of 2015, it only reached its peak in January of this year – and there will be a lag before its full effects are felt. This is typical for an El Niño event, and it means that the influence on global temperature is much bigger in the year following an event than the one in which it is first detected. As Scaife told Carbon Brief last week:
The effects are very clear: there is a little warming in the period preceding the winter El Niño peak, but the big effect on global temperature comes in the following calendar year as it takes a few months for heat to increase in other ocean basins around the world.
This is why you’d, perhaps, be forgiven for thinking you’d seen numbers larger than “a few hundredths of a degree” mentioned in the discussion of El Niño’s role in 2015’s record warmth. It’s important to distinguish between this year’s impact and next year’s – which will be higher.
As Scaife told Carbon Brief last week, the boost to global temperature in 2016 is likely to be more in the region of 25%. He explains further today:
The forecast for next year is about 0.8C above the 1961-1990 baseline. About 0.2 of that is likely to come from El Niño, hence the 25%.
There’s no doubt the El Niño that developed in 2015, which is still underway, has been abnormally strong, exceptional even. But with a contribution somewhere around the 10% mark, it seems clear from scientists that El Niño can’t be blamed for 2015’s record warmth. In fact, its contribution was strikingly small.