UK carbon dioxide emissions fell by more than nine per cent in 2014 year-on-year, according to Carbon Brief analysis of newly released government energy data.
A 20 per cent reduction in coal use and record warm temperatures both contributed to the decline in emissions. Continued falls in energy use were also a factor.
The estimated 9.2 per cent fall in UK carbon emissions is the largest year-on-year reduction since 1880 for a year with a growing economy. There were larger carbon reductions in 1893, 1921, 1926 and 2009, when GDP was falling.
The Carbon Brief emissions estimate is based on analysis of preliminary energy use data for 2014, published on 26 February by the Department for Energy and Climate Change (DECC). Estimates for previous years using the same method are accurate to within half a percentage point, as the table below shows.

Source: Carbon Brief analysis of DECC energy and emissions data.
A 9.2 per cent reduction would leave UK emissions 28 per cent below 1990 levels, at 429 million tonnes of carbon dioxide. The UK is aiming to halve its greenhouse gas emissions by 2025 and cut them by 80 per cent by 2050, both against 1990 levels.
Coal use down by a fifth
Falling coal use for electricity generation was the main cause of the 2014 reduction in UK carbon emissions, contributing two-thirds of the overall saving. Coal emissions fell by 20 per cent compared to 2013, as the table below shows.
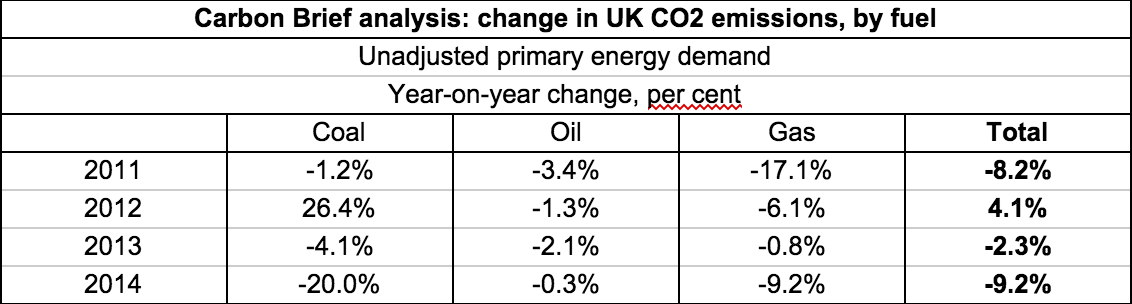
Change in emissions by fuel, based on unadjusted energy use data. DECC also supplies energy use figures adjusted for variations in temperature (see below). Source: Carbon Brief analysis of DECC energy data.
In fact, total UK coal use in 2014 was the lowest seen since the 1850s, when the UK was in the midst of the industrial revolution. The reduction was caused by several factors. First, the unexpected closure of Ironbridge and Ferrybridge power plants last year following fires.
Second, the UK’s largest power station Drax switched more of its capacity to biomass during 2014, with one-third of its four-gigawatt capacity now using biomass instead of coal. This switch is part of the UK’s drive to decarbonise, which saw renewables grow to a 15 per cent share of UK electricity generation during 2014.
The fourth and most decisive factor is changes in the relative price of coal- versus gas-fired electricity. Carbon Brief published a more detailed discussion of price effects in January.
Gas nears coal as leading source of UK electricity
Coal prices began to fall in 2011, causing coal to overtake gas as the UK’s leading source of electricity during 2012. This trend is now in the process of being reversed, with large reductions in UK wholesale gas prices during 2014 driving coal-to-gas switching in the power sector and contributing to last year’s falling coal use.

Source: DECC energy data. Chart by Carbon Brief.
Carbon Brief estimates that UK carbon dioxide emissions from gas use also fell strongly during 2014. A 9.2 per cent reduction in emissions from gas contributed one third of the overall cut in UK emissions.
Gas use fell despite an eight per cent increase in the use of gas for electricity generation. The reduction in gas use was instead driven by last year being the UK’s hottest on record. The use of gas for heating was 18 per cent lower in the first three quarters of 2014 than in the same period of 2013. Heating accounts for around half of UK gas use.
UK energy demand keeps falling
Even if it hadn’t been a record warm year, UK emissions would have fallen by 4.9 per cent during 2014, according to Carbon Brief analysis of DECC’s temperature-adjusted energy use data, shown in the table below.
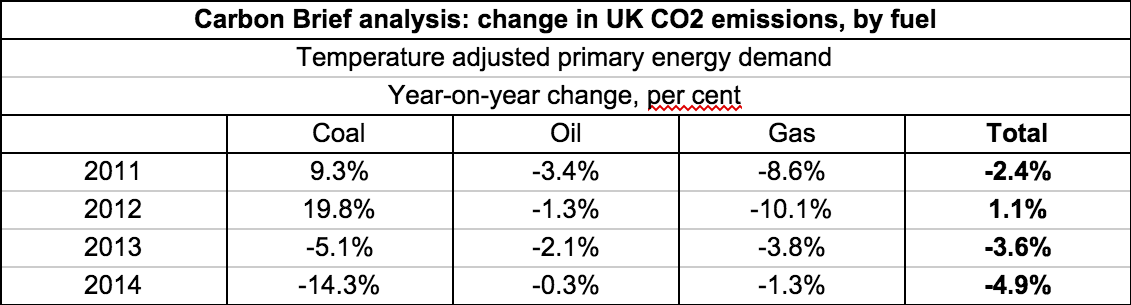
Change in emissions by fuel, based on temperature-adjusted energy use data. Source: Carbon Brief analysis of DECC energy data.
The temperature-adjusted fall in emissions reflects continued reductions in energy demand, down seven per cent year-on-year. UK energy demand peaked in around 2005 and has been falling ever since.
A similar picture is being repeated across the EU, where energy use has fallen back to 1990 levels despite a 6 per cent increase in population and a 45 per cent expansion of economic output.
These falling energy use trends are a result of the installation of building insulation, improvements in product energy efficiency, vehicle fuel efficiency standards and changes in the structure of the economy.
Record emissions cut
The UK’s carbon emissions saving for 2014 is the largest on record, for years when the economy was expanding. The 9.2 per cent carbon saving was accompanied by a 2.6 per cent increase in GDP.
Four years since 1880 have achieved larger annual emissions reductions than 2014. All were accompanied by falling GDP, as the table below shows. The very large emissions cuts during 1921 and 1926 were followed by even larger increases, of 34 per cent in 1922 and 89 per cent in 1927.

The top six years for annual UK carbon emissions reductions, in records going back to 1880. Annual changes in UK GDP are shown for comparison. Source: emissions data from the World Resources Institute and economic data from the Bank of England.
Sustained, multi-year emissions reductions of more than five per cent per year without economic recession are considered extremely unusual. The most commonly cited example is France, which cut its emissions by five per cent every year for five years, at the height of its shift towards nuclear power.
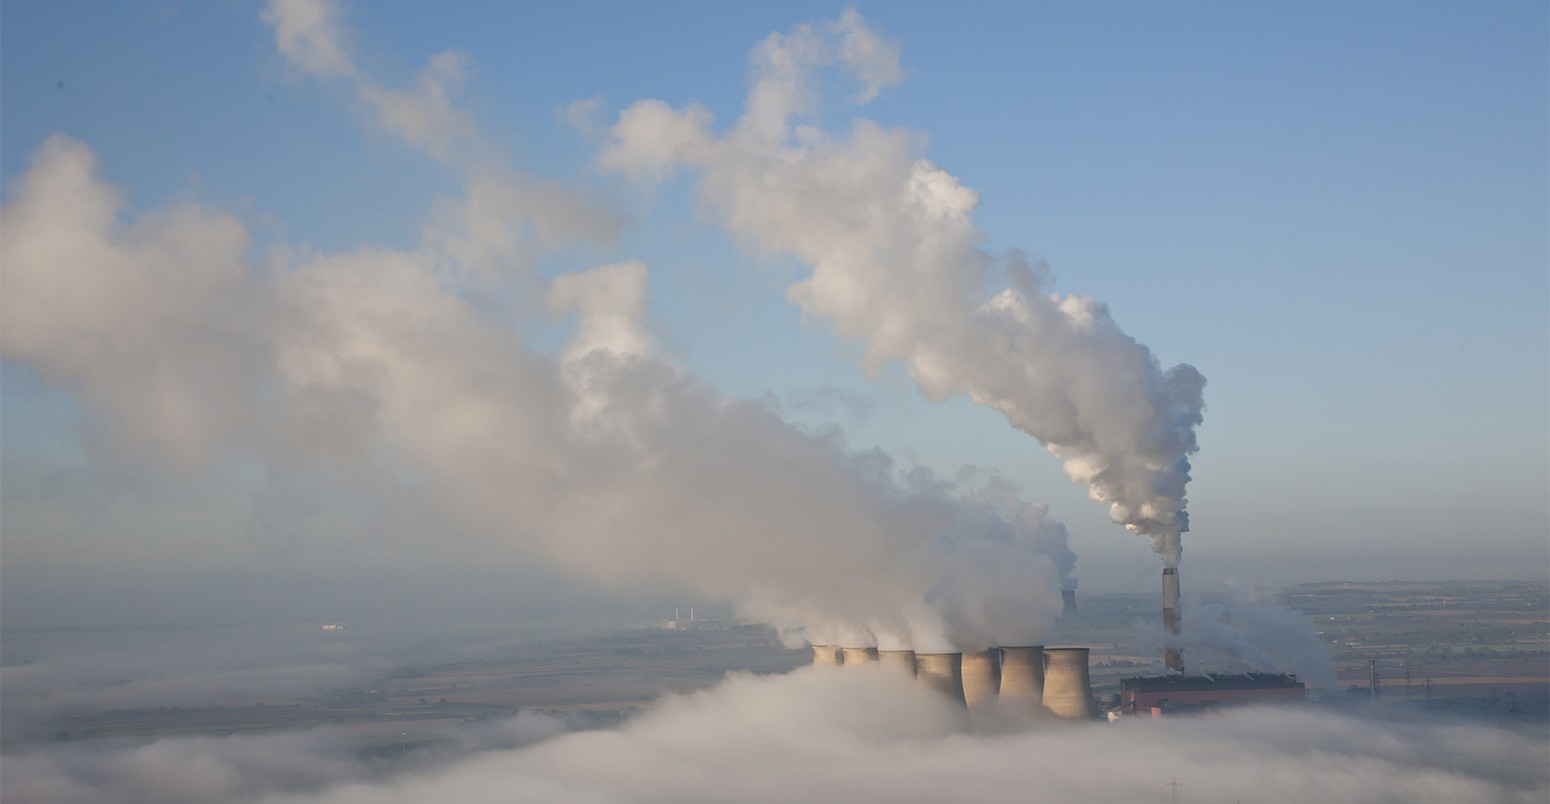
Main image: Aerial image of a power station on a misty morning.
Methodological note: Carbon Brief's analysis converts energy use in tonnes of oil equivalent into carbon dioxide emissions, using DECC emissions factors for coal, oil and gas. These are weighted by the shares of consumption of different types of each fossil fuel, for instance diesel versus petrol, which have different emissions factors. DECC will publish provisional UK carbon dioxide emissions figures for 2014 on 26 March. Update 26/3: Official figures have confirmed the analysis below. Update 17:20 - We added historical context showing the 2014 reduction is unprecedented for a year with a growing economy.