Carbon pricing schemes climb to $50bn, despite Australian backtracking
Sophie Yeo
05.27.15Sophie Yeo
27.05.2015 | 7:30amThe value of carbon pricing schemes rose to $50 billion in 2015, according to a new assessment by the World Bank.
It outlines its findings in the latest edition of Carbon Pricing Watch, which examines the state of the world’s carbon markets in advance of its more detailed report due later this year.
As of 1 April 2015, emissions trading schemes were valued at $34 billion, up from $32 billion the previous year. This was despite the repeal of Australia’s carbon pricing mechanism in July 2014 at the hands of prime minister Tony Abbott.
Emissions trading schemes are not the only way to put a price on carbon. For the first time, the World Bank has also valued carbon taxes across the world, which it finds amount to $14 billion.
The World Bank calculated the value of emissions trading schemes by multiplying the allowances issued for each scheme, multiplied by the price. Estimates of the price of carbon taxes were based on government budgets for 2015, or by the greenhouse gas emissions covered by the carbon price on 1 April 2015.
All in all, emissions are currently being priced in 39 nations and 23 subnational jurisdictions, as the World Bank map shows below.
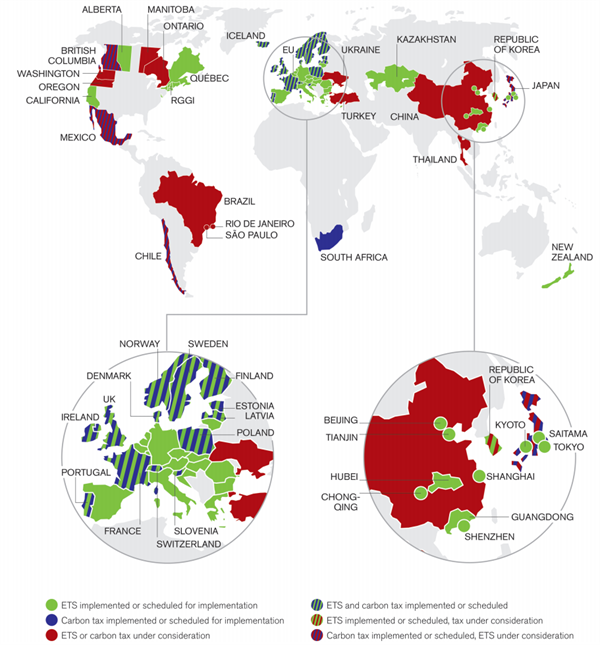
Map of existing and potential carbon pricing schemes. Source: World Bank Carbon Pricing Watch 2015
Comparison
The report says in 2015, carbon pricing covered around 12% of the world’s emissions.
The actual volume of carbon that was covered by a carbon price in 2015 rose slightly from the previous year, from almost 6 gigatonnes of carbon dioxide equivalent up to 7 gigatonnes, the World Bank report says.
Over the last decade, the picture has changed more dramatically, as the graph below shows. In 2005, only 4% of the world’s annual greenhouse gas emissions were priced, and almost all of this was a result of the EU’s newly launched emissions trading system (EU ETS).
Before this, less than 1% of emissions were priced.
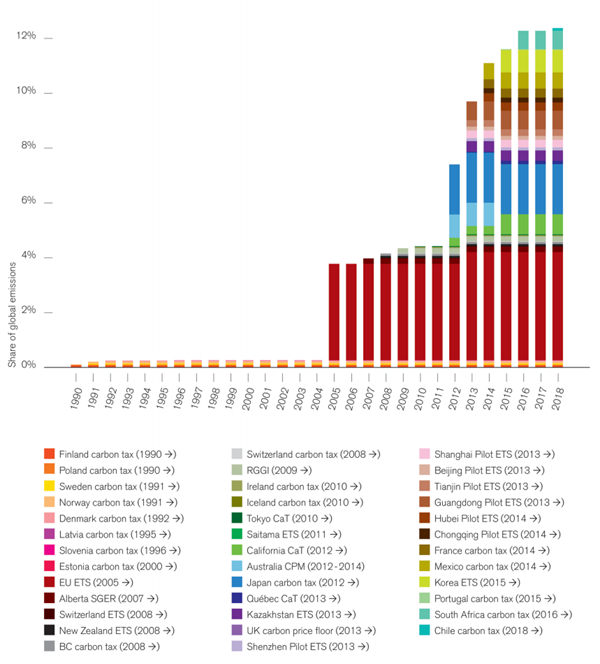
Share of global emissions covered by carbon pricing initiatives. Source: World Bank Carbon Pricing Watch 2015
Changes
The value of carbon markets has continued to increase, despite Australia scrapping its pricing mechanism – a scheme that covered 60% of the country’s emissions, and charged around US$20 for every tonne of carbon dioxide emitted.
Other nations did not share Australia’s distaste for a price on carbon, and the introduction of new schemes in other parts of the world more than compensated for backtracking down under.
The continued expansion of the value of carbon pricing – although by a smaller step than in the previous two years – was mainly down to South Korea, whose ETS kicked in on 1 January 2015.
Portugal implemented a carbon tax of $5 per tonne of carbon dioxide equivalent on the same day, making barely a dent in global emissions, but nonetheless expected to generate revenues of over $104 million in 2015 from sectors not already covered by the EU’s trading scheme.
Nor did existing systems stagnate.
Cap-and-trade programmes in California and Quebec extended their scope in 2015 to include transport fuels, increasing coverage from around 35% to 85% of their total greenhouse gas emissions. Before September, lawmakers in California are expected to debate the overall size of the cap, which determines the overall volume of gases that can be emitted under the scheme.
Chongqing in China is another example of a province improving its existing system. The number of emission allowances allocated for free to companies in the scheme was lowered by 7% compared to 2013 – faster than expected.
A number of new schemes and improvements in the pipeline for coming years means that the value of carbon pricing mechanisms is expected to continue expanding.
South Africa is expected to implement a carbon tax in 2016, while Chile has one coming online in 2018. And while details remain sketchy, China could launch a nationwide trading scheme based on its experience of its pilots also by the end of 2016.
The EU recently agreed a plan to bolster its own failing ETS, which will take effect from 2019.
Some companies are also beginning to factor in a carbon price into their own operations, albeit at different levels, as the diagram below illustrates.
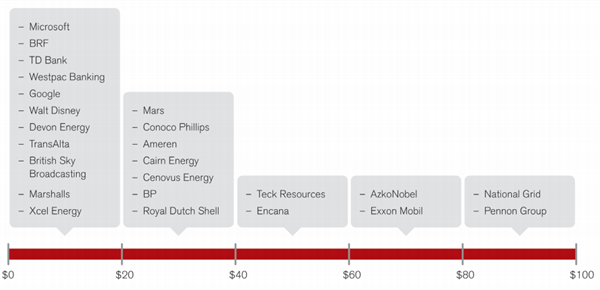
Price range of the average internal carbon price being used by companies. Source: World Bank Carbon Pricing Watch 2015
What does the future hold?
While a growing number of countries and regions are choosing to implement some sort of carbon pricing mechanism, there are still variable levels of ambition among the actors.
The amount that a polluting company must pay to emit a tonne of carbon dioxide varies state-by-state, depending on the local context. The graph below illustrates the disparities.
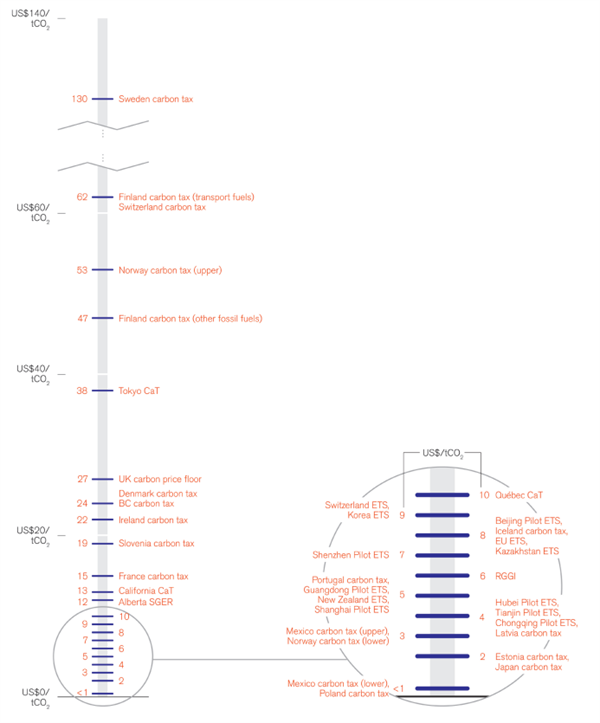
Price of existing carbon pricing instruments. Source: World Bank Carbon Pricing Watch 2015
Most carbon pricing mechanisms in place currently act within a country’s (or bloc, in the case of the EU) own borders.
But there is an appetite for going beyond this.
The UN is due to sign off an international deal to combat climate change in December this year in which market mechanisms could be included. One option currently on the table is to establish an emissions trading system open to all countries willing to take on economy-wide emissions reductions targets.
During a summit hosted by UN secretary general Ban Ki-moon in September 2014, 73 countries and more than 1,000 businesses also gave their support for a price on carbon.
Social cost
Economists use models to estimate the future climate costs imposed by carbon dioxide emitted today, known as the social cost of carbon.
There is no absolute answer, and attempts to estimate this cost are beleaguered by high levels of uncertainty about levels of future emissions and vulnerability.
However, some scientists believe that earlier models could have seriously underestimated the future costs and damages. A recent study, covered by Carbon Brief, found that including the potential for extreme, irreversible tipping points in the models could raise the social cost of carbon by 200%.
Even under a less extreme scenario, they found that the cost of carbon should have been about 50% higher – around $56 rather than $37.
Both of these are hypothetical figures. Before 2005, almost no governments were factoring in a carbon price at all, and even now many continue to allow their industries to pollute for free.
Support for carbon pricing may be growing, but these schemes are still a long way from providing the financial incentive to avoid the volumes of emissions needed to stave off dangerous climate change.