Five charts that show how Arctic and Antarctic sea ice is faring in 2015
Robert McSweeney
10.22.15Robert McSweeney
22.10.2015 | 2:27pmAt this time of year, there are big differences in what’s going on with sea ice at either end of the world.
September saw the Arctic hit its fourth lowest summer minimum on record, while over in Antarctica, the winter maximum finished just above average, ending a streak of record highs in the last three years.
Carbon Brief takes a look at what’s happened this year and how it fits in with long term trends.
Summer minimum
Scientists have been using satellites to measure sea ice extent at the north and south poles since the late 1970s. They take measurements daily, and record the annual minimum and maximum as an indicator of how the poles are changing.
In the Arctic, the end of the summer marks the point when sea ice is at its smallest extent, before it freezes up again as temperatures fall. Scientists keep a close eye around the time the low is normally reached – usually mid september – then look for signs of ice accumulating again in order to pinpoint exactly when the summer minimum is reached.
According to the National Snow and Ice Data Center (NSIDC) in the US, the summer low occurred this year on 11 September. But because sea ice can throw in a late dip or surge, the NSIDC waited until 6 October before finally confirming this summer’s minimum of 4.41m square kilometers (sq km) – the fourth lowest on record.
So how did the rest of the season shape up before this point?
Our starting point is the Arctic’s winter sea ice maximum, which signals the start of the summer melt season. The winter peak in February was the lowest on record and around two weeks earlier than usual, which meant sea ice started melting earlier in the year.
As the season progressed, air temperatures over the Arctic Ocean in May and June were not especially warm, but they were followed by the second warmest July in the satellite record.
You can see how these months of 2015 ranked against previous years in the charts below. Each bar represents the average temperature of that month for each year – and are ranked in order of warmth, from the colder months in blue towards the left, through to the hottest months in red on the right. The yellow bars indicate where the year 2015 sits in this ranking.
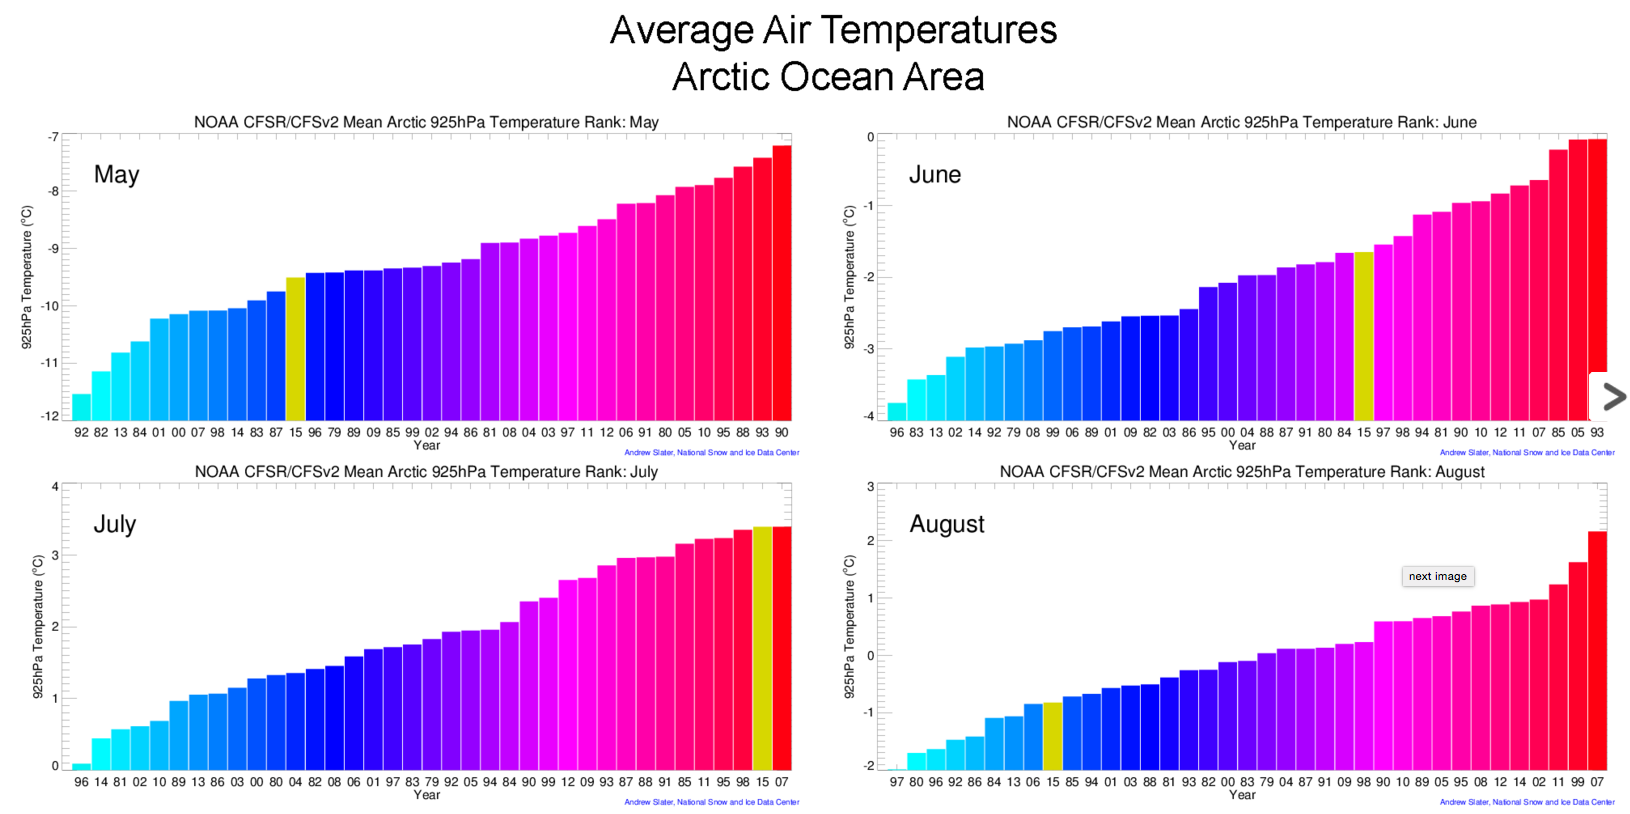
Arctic ocean air temperatures for May (top-left), June (top-right), July (bottom-left), and August (bottom-right), ranked according to temperature from lowest (blue shading) to highest (red shading). Ranking of 2015 is given in yellow. Source: D. Slater, NSIDC.
Despite such a warm July, sea ice melt didn’t accelerate immediately, Prof Julienne Stroeve, a senior research scientist at NSIDC, tells Carbon Brief:
July was only the eighth lowest [extent on record] because the ice didn’t melt out quickly in Baffin and Hudson bays, which was unusual.
By the end of the month, however, rapid melting meant that sea ice extent was smaller than at the same point for the two previous years, and within half a million square kilometres of the record low in 2012.
Then, just as scientists thought 2015 might bring a new record, a relatively cool August meant the summer minimum in September didn’t quite drop as low as 2012, but instead finished as the fourth lowest.
The chart below shows how summer sea ice extent compares for recent years; you can compare sea ice in 2015 (blue line) with the record low in 2012 (brown dotted line).
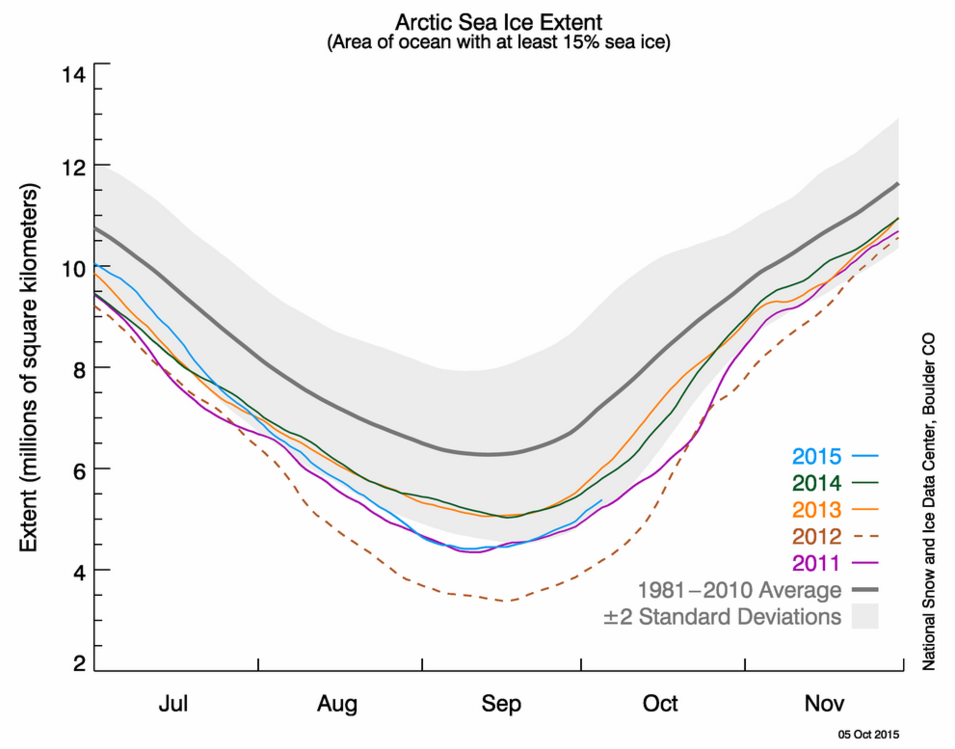
Arctic sea ice extent as of 5 October 2015 (blue line), along with daily ice extent data for four previous years: 2014 (green), 2013 (orange), 2012 (brown, dotted), and 2011 (purple). The 1981 to 2010 average is in dark grey, and the surrounding shaded area shows the two standard deviation range of the data. Source: NSIDC.
Nine of nine
So how does 2015 fit in with the long-term trend for Arctic summer sea ice?
This year is a continuation of the decline we’ve seen since satellite records began, Stroeve says:
There will be variations around that trend-line, ups and downs that reflect the chaotic atmospheric variability, but the continued warming trend of the Arctic allows for more ice melt each summer that not only removes ice but also thins the ice that survives the summer.
Since the start of the satellite record, Arctic sea ice extent in the month of September has fallen 13.4% per decade, relative to the 1981 to 2010 average – as the chart below shows. The nine lowest September ice extents over the satellite record have all occurred in the last nine years.
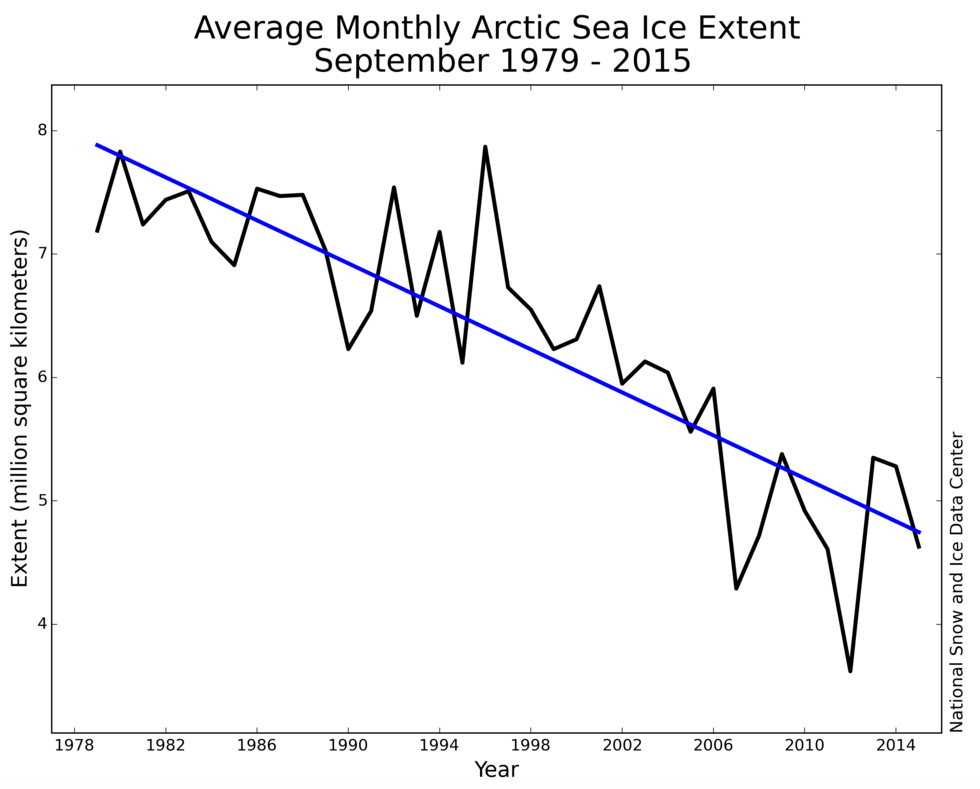
Monthly September ice extent for 1979 to 2015, showing a decline of 13.4% per decade relative to the 1981 to 2010 average. Source: NSIDC.
Winter maximum
While Arctic sea ice has been melting through its summer, on the other side of the world in Antarctica, it’s been winter. This means sea ice has been accumulating towards its annual maximum, which it reached on 6 October at 18.83m sq km.
From the blue line in the chart below, you can see that sea ice extent in July this year initially looked like it was going to keep pace with the 2014 record year (green dotted line), but then the pace of growth slowed.
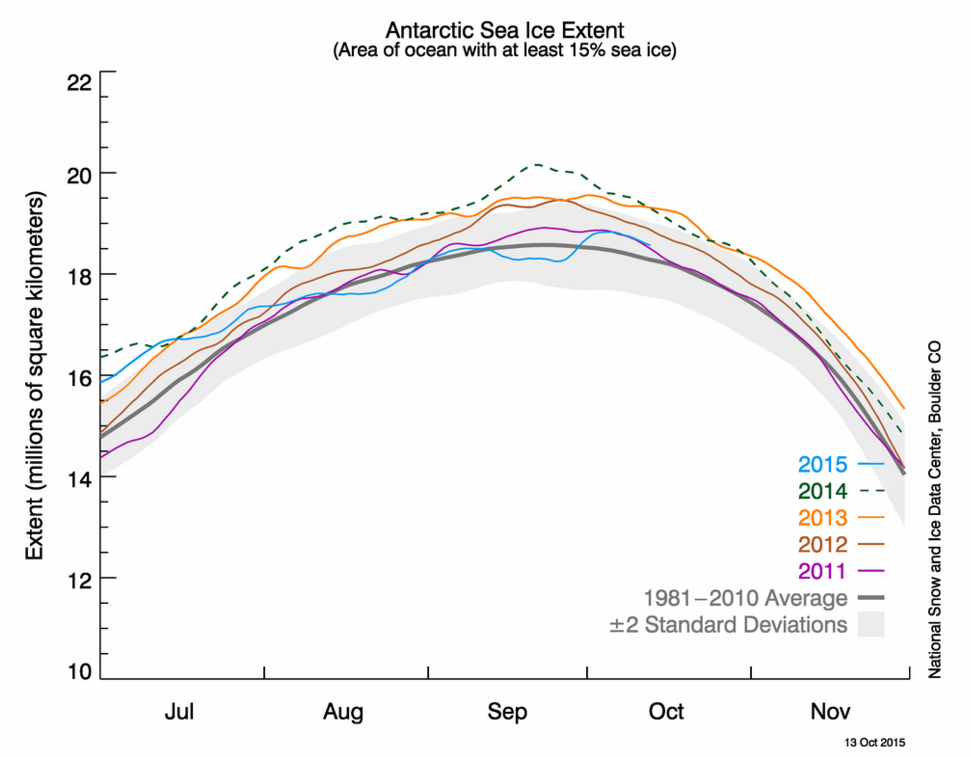
Antarctic sea ice extent as of 13 October 2015 (blue line), along with daily ice extent data for four previous years: 2014 (green, dotted), 2013 (orange), 2012 (brown), and 2011 (purple). The 1981 to 2010 average is in dark grey, and the surrounding shaded area shows the two standard deviation range of the data. Source: NSIDC.
The lower-than-expected accumulation of ice growth is down to the El Niño event currently underway in the Pacific Ocean, the NSIDC says. El Niño is a change in the winds that causes a shift to warmer than normal sea surface temperatures in the equatorial Pacific Ocean.
El Niño has knock on effects for an area of low pressure known as the Amundsen Sea Low, which sits off the Southern Ocean coast of West Antarctica. An El Niño event tends to weaken the low and allow in slightly warmer air.
As a result, sea ice in the Amundsen and Ross seas didn’t grow as much as expected. In the left-hand map below, for example, you can see that sea ice extent in the Ross Sea falls inside the orange line, which shows its extent is slightly smaller than the long-term average.
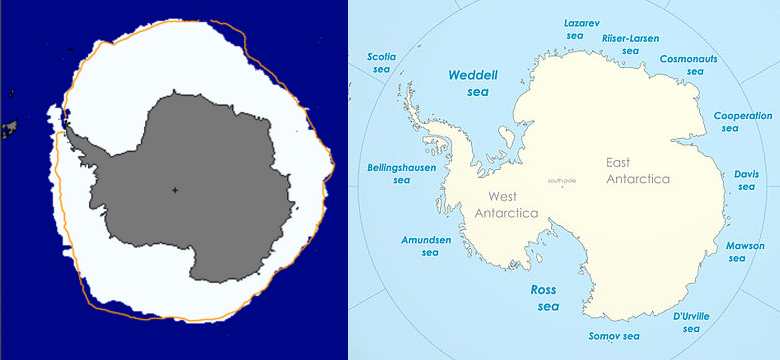
Left-hand map: Antarctic sea ice extent for 6 October 6 2015. The orange line shows the 1981 to 2010 average extent for that day. The black cross indicates the geographic South Pole. Source: NSIDC. Right-hand map: Seas around Antarctica. Credit: Creative commons.
Poles apart
While this year’s peak is around 120,000 sq km larger than the long-term average, it ends a series of record-breaking highs seen in the past three years.
Over the satellite record, average Antarctic sea ice extent shows a statistically significant increase, which means it’s unlikely the trend is happening by chance.
This increase is outweighed by the decline in the Arctic, meaning that global sea ice extent is decreasing overall. You can see changes in annual sea ice extent at the two poles compare in the chart below.
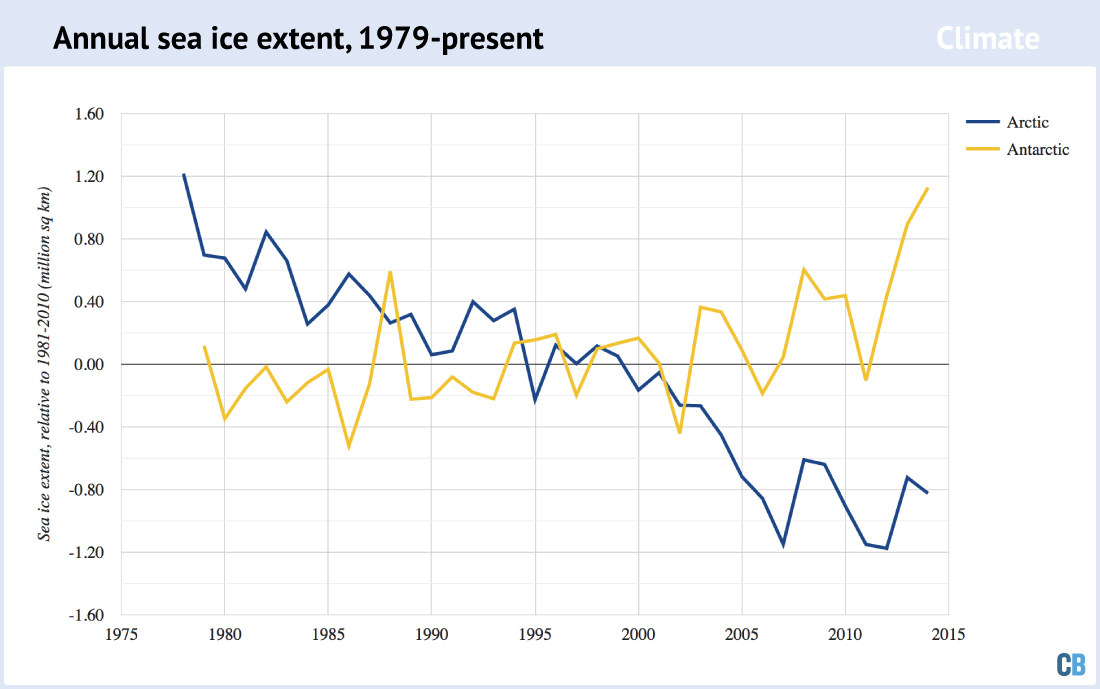
Arctic and Antarctic annual average sea ice extent (million square kilometres), from 1979 to present, against a baseline of 1981-2010. Source: Monthly data available from NOAA, via the NSIDC for the Arctic (baseline) and Antarctic (baseline).
The overall loss of global sea ice is accelerating. In the first half of the satellite record (1979-96), annual average global sea ice extent declined by 21,500 sq km per year, while in the more recent half (1996-2013), ice loss has more than doubled to 50,500 sq km per year.
The contrasting fortunes between the Arctic and Antarctic poses an intriguing research question for scientists. There could be several reasons why sea ice is growing at the south pole and receding at the north, says Stroeve. One is that it’s much colder in Antarctica:
Even if temperatures were to warm by, say, 5C in Antarctica, it would still be way below freezing, whereas the Arctic is closer to the melting point. So changes in air temperature have a larger impact there.
Another is to do with the hole in the Ozone Layer. Research suggests that the hole, which is centred over the Antarctic, is partly responsible for strengthening the winds that circulate around the continent, says Stroeve:
[The winds] push the ice away from the coasts and increase the overall extent. Since, in contrast to the Arctic, there is no land to constrain how far that ice can expand, the extent can increase in response to these changes in the winds.
The more scientists study Antarctic sea ice, the more they see how much it fluctuates from one year to the next, says Dr Ted Scambos, lead scientist at the NSIDC. He tells Carbon Brief:
The bottom line I think – what the community is learning from looking at the system and looking at pre-monitoring data from early satellites in the 1960s and early 1970s – is that the Antarctic sea ice system is inherently more variable than the Arctic.
So, although this year’s winter maximum sees a return to near-average levels after recent record highs, there are no guarantees on what next year will bring. And if you want to keep tabs on how sea ice is changing at both poles, keep an eye on Carbon Brief’s new climate Data Dashboard, as we’ll be tracking sea ice from one month to the next.
Main image: Sunlight reflecting off of ice in the Bellingshausen Sea on Oct. 19, 2012. Credit: NASA / George Hale/Flickr.
-
5 charts that show how Arctic and Antarctic sea ice is faring in 2015
-
2015: Arctic sea ice hits its fourth lowest summer low on record, while Antarctica’s winter maximum finishes just above average