Update: as of 31 March 2025, this map is no longer interactive. An in-depth feature on the UK’s energy supply was published in 2018.
In recent years, the UK has added thousands of renewable power schemes to its ageing and dwindling fleet of coal, nuclear and gas plants. Yet these older sources still supply most of the UK’s electricity.
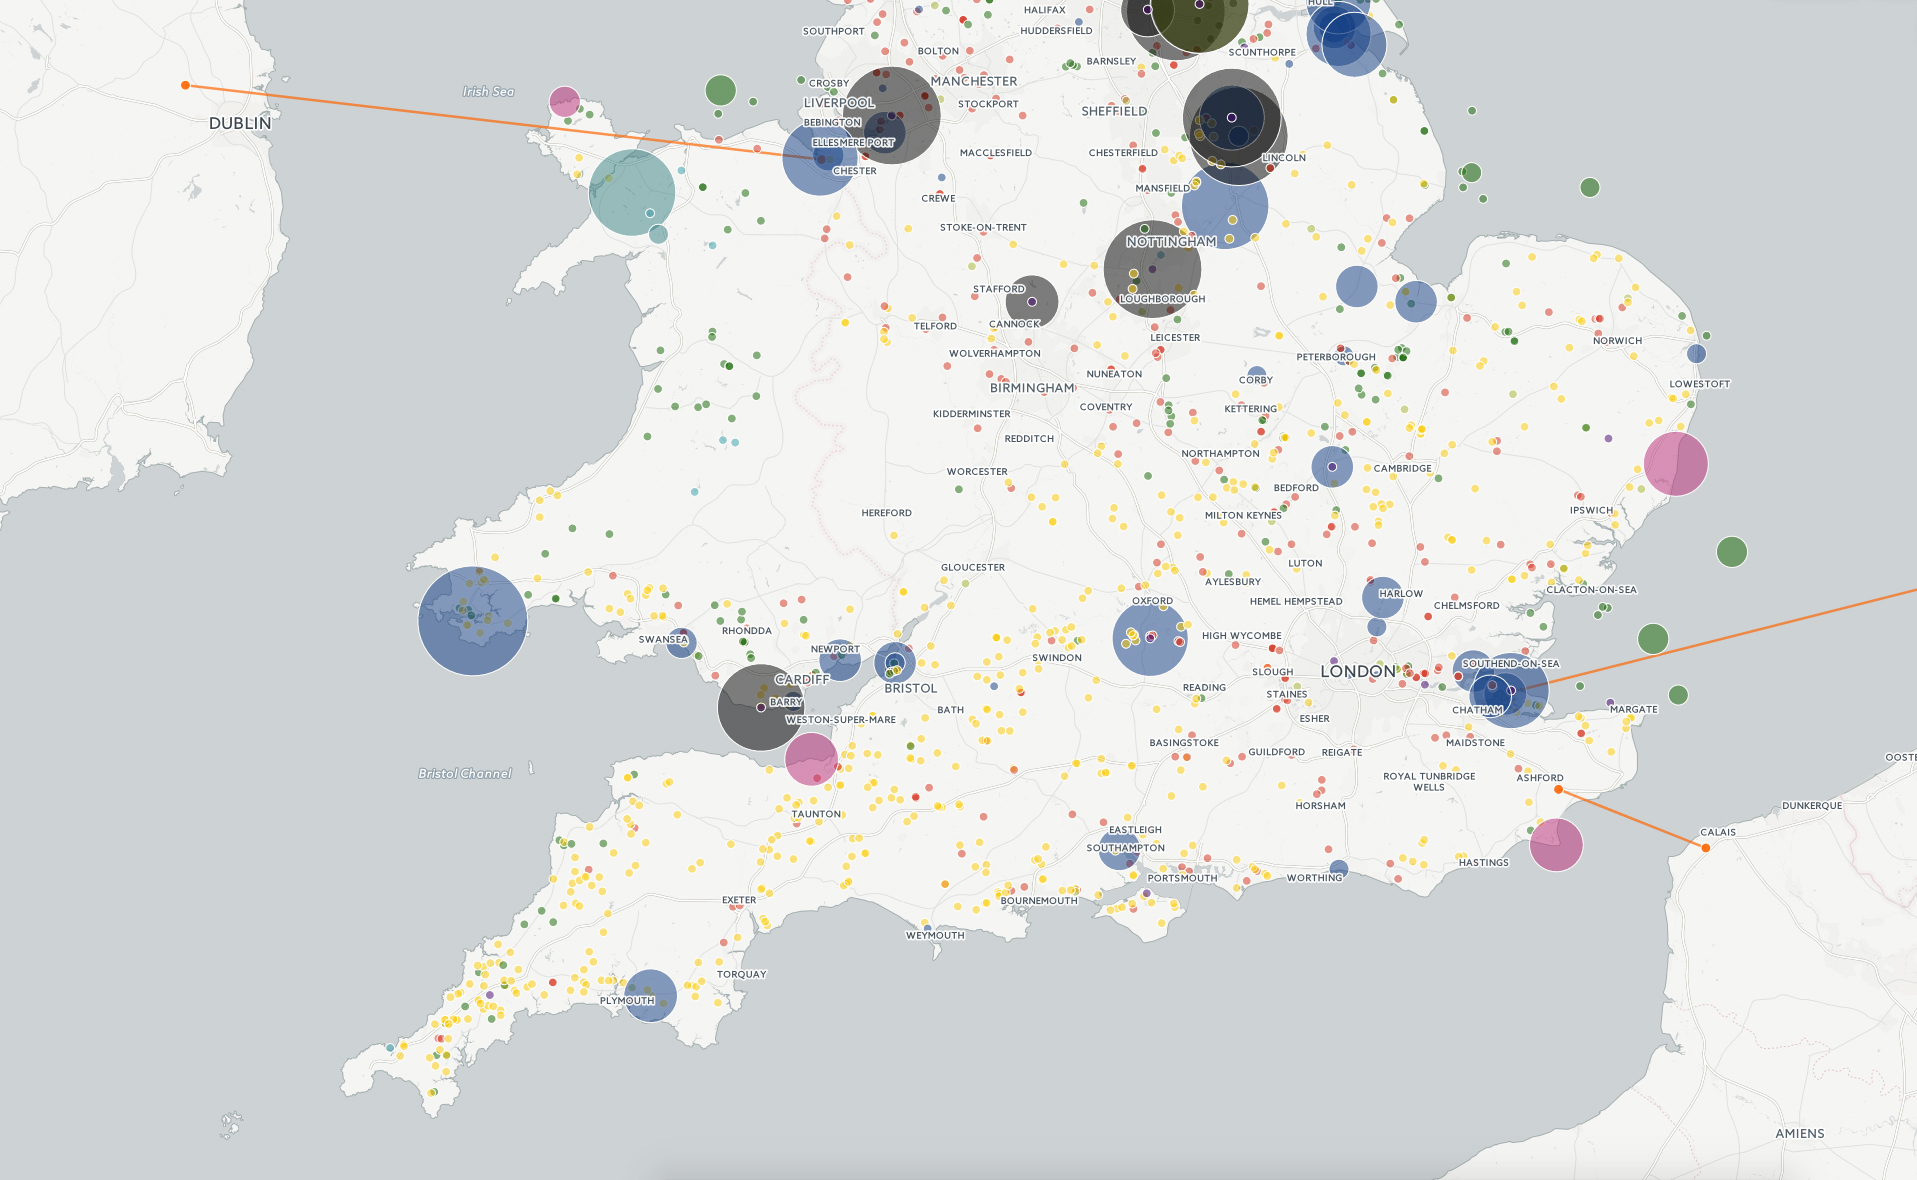
Carbon Brief has plotted the nation’s power stations in an interactive map to show the diversity of the UK’s electricity supply.
The UK’s energy resources are not shared evenly. Perhaps most strikingly, the UK’s solar farms are concentrated in the south, where insolation rates are higher. Note that small rooftop solar, which is more widespread, isn’t included in our data because it has a 1MW minimum.
The maps also show how the UK’s hydroelectric generation is limited to Scotland and Wales, where plentiful rainfall, mountains and sparsely populated valleys make it easier to build dams. The largest circles are the UK’s pumped storage reservoirs, which act like giant batteries for the grid.
Windfarms are skewed, too, towards the coastlines and higher ground where consistent wind speeds are more reliable. You can also see larger offshore wind installations popping up — for now these are relatively close to the shore, in shallower waters.
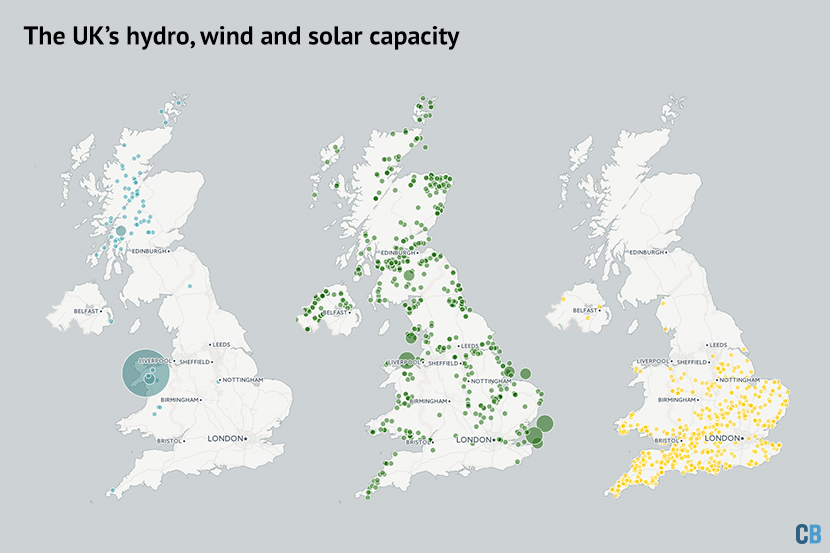
The UK’s hydro wind and solar capacity. Credit: Rosamund Pearce/Carbon Brief/CartoDB.
The UK’s coal, gas and nuclear sites are more evenly distributed, but here, too, the map is revealing. All nuclear sites, for instance, are on the coast, because they need guaranteed access to plentiful supplies of cooling water.
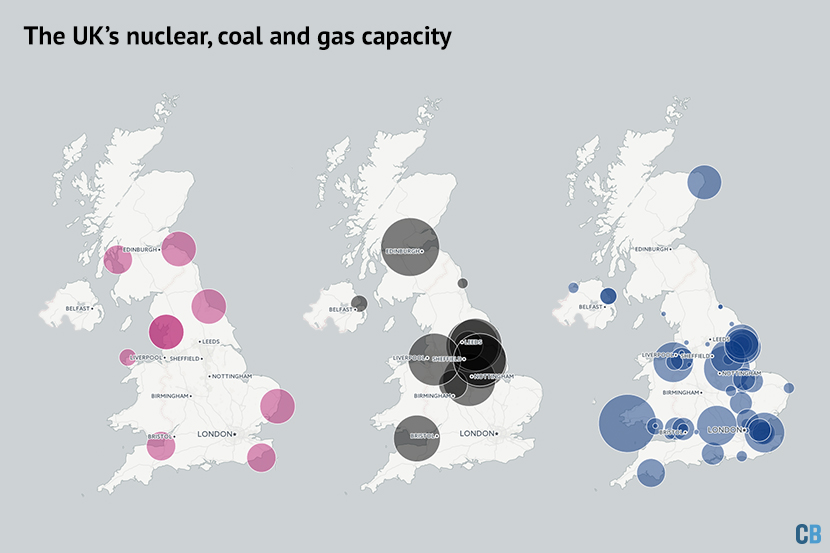
Nuclear, coal and gas capacity in the UK (left-right). Credit: Rosamund Pearce/Carbon Brief/CartoDB.
Coal capacity is concentrated near historic mining sites, most obviously in Yorkshire’s “megawatt valley”, home to three large power stations, including Drax. Many of the UK’s 50-odd gas plants, meanwhile, are near liquified natural gas (LNG) import terminals or where gas pipelines make landfall.
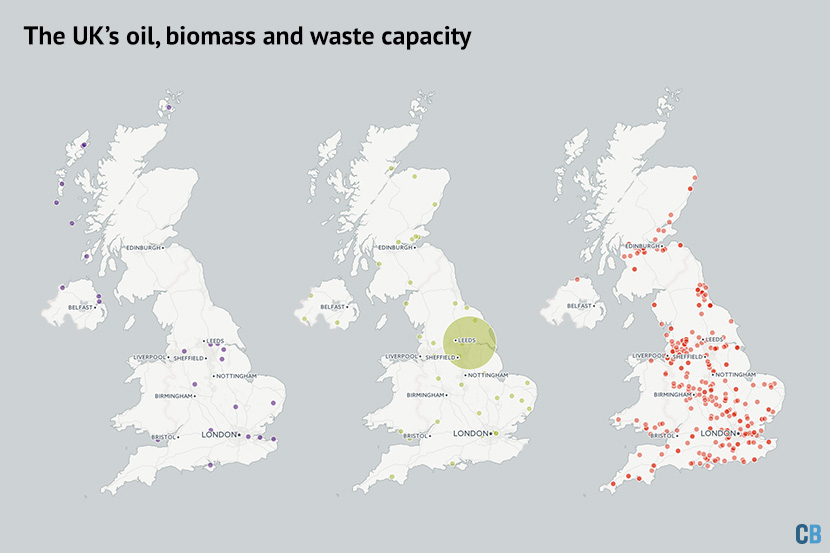
The UK’s oil, biomass and waste capacity (left-right). Credit: Rosamund Pearce/Carbon Brief.
The UK’s waste, biomass and oil-fired power stations are more evenly spread, but, once again, their location correlates with sources of fuel supplies. Waste sites, including anaerobic digestion plants, waste incinerators, landfill gas burners and sewage sludge digestors are a lesser-known source of power, generating 14% of renewable electricity last year.
Historic shifts
A closer look at the data behind the map reveals some interesting shifts in the types of infrastructure being built to generate the UK’s electricity. In the late 1960s and early 1970s, many large coal plants were built that are still operating today (black bars, below).
Our nuclear sites were built over the course of a quarter century from 1971 (purple bars). From the 1990s, new gas-fired plant was added during the UK’s “dash for gas” (blue). And since the turn of the century there has been a massive expansion of renewable capacity (green).
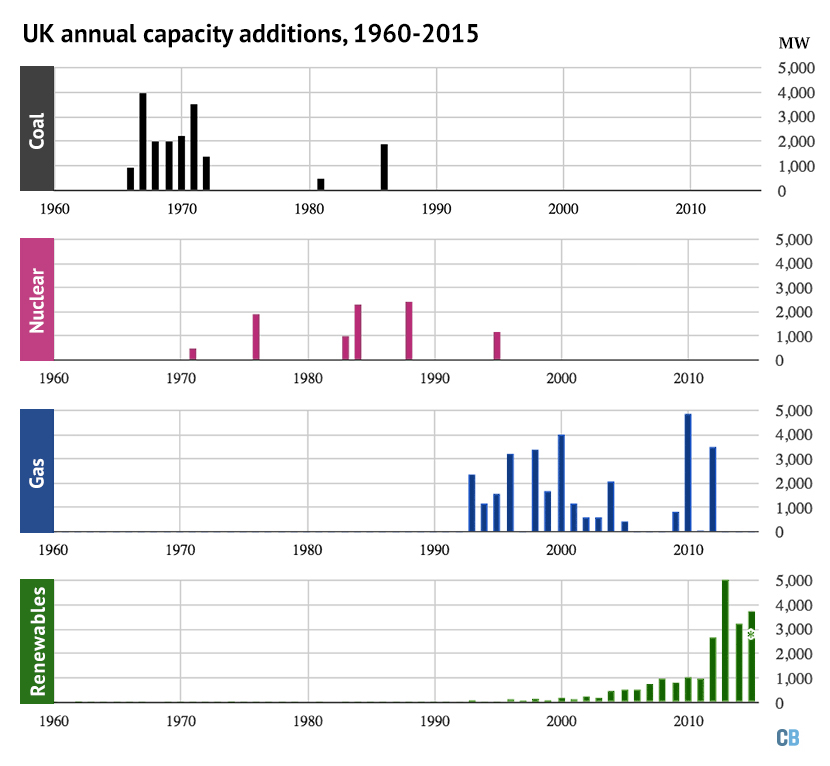
Year of construction of currently operating power stations in the UK, organised by fuel source. *Additions for 2015 are shown year-to-date. Charts by Carbon Brief using DECC data.
Like the map, this shifting history tells us more than you might expect. For instance, the big gaps between nuclear additions show how long it takes to build atomic plant. You can also see why our current coal fleet has an average age of 44 years with Drax, the newest coal plant in Great Britain, completed in 1986. Yet the UK still has nearly 20 gigawatts (GW) of coal capacity.
This illustrates why countries building new coal capacity today could face high-carbon lock-in for decades to come. In the UK, legislation means no new coal will be built without carbon capture and storage. Plans to build at Kingsnorth ultimately failed, and that battle is now firmly in the past.
However, the UK has no clear strategy to change its still-heavy reliance on coal. Despite a relatively high carbon price and prime minister David Cameron’s pledge to phase the fuel out, some 31% of UK electricity last year came from coal (black area, below).
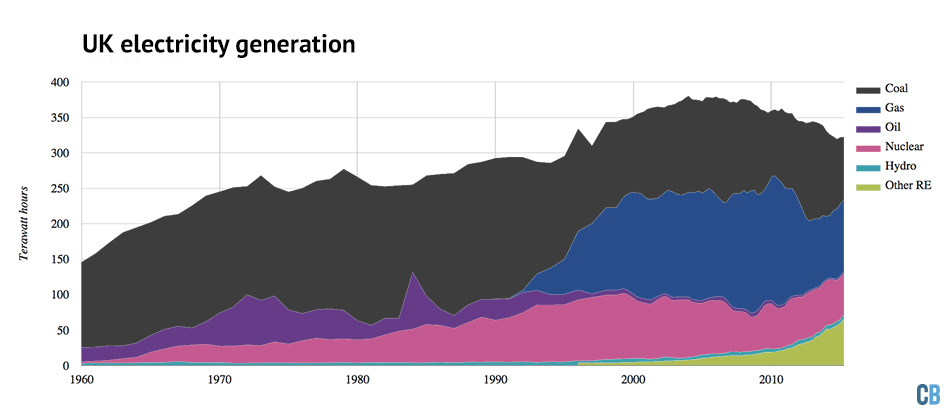
UK electricity generation by fuel type. In 2014, the UK electricity mix was 31% coal, 31% gas, 19% renewable and 18% nuclear. Chart by Carbon Brief using DECC data.
That said, UK coal use fell by a quarter last year, as overall electricity use fell back to mid-1990s levels. Three UK coal plants totalling 5GW have recently announced plans to close in March 2016. These are the 2GW Eggborough, 1GW Ferrybridge C and 2GW Longannet plants.
There has been a steady stream of closures over recent years as old and dirty coal plants have shut down, rather than invest in air pollution controls (shrinking black areas in the chart, below). Coal’s days may be numbered if a rumoured phase-out date of 2023 is confirmed.
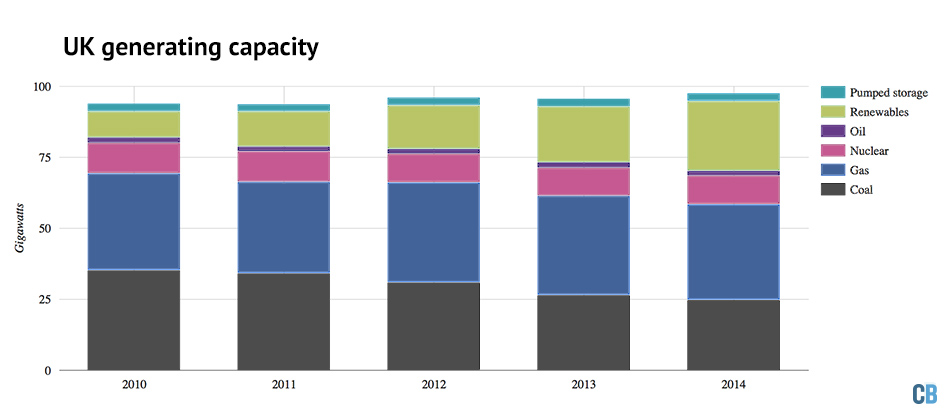
UK electricity generating capacity by fuel type. Note that these figures show total capacity, including for renewable sites, which will generally have lower power outputs than their capacity would suggest. The UK’s last large oil plant, Littlebrook D, is included in the chart, but has now closed. Chart by Carbon Brief using DECC data.
Renewable capacity
Meanwhile, some 16GW of new renewables have been built over the past five years, accounting for four-fifths of new capacity in that period. Gas made up the remainder, though only renewables have been added since the start of 2013.
These additions prevented the UK’s capacity from shrinking in absolute terms. Yet windfarms produce on average only a third of their total capacity and solar parks about 15%. DECC reports lower “de-rated” capacities, which account for these average availabilities.
De-rated capacity is falling. Combined with the unprofitability of building new gas-fired generation, this is creating a UK “capacity crunch“. In response to this shrinking margin between supply and demand, the UK’s capacity market will begin to pay power stations, just for being available — or it will pay large users to reduce their peak demand.
A chorus of concern over capacity from some analysts and sections of the media is consistently rebuffed by National Grid and the government, which insist plans are in place to keep the lights on. Sub-sea electricity interconnectors, shown in our map and with capacity set to more than double over the next five years, will also help to buffer ups and downs in the UK’s supply and demand.
In a recent interview Steve Holliday, National Grid chief executive, says the idea of large power stations acting as baseload for the grid is “outdated”. If he’s right, then the UK’s electricity generating map will continue its shift from tens of large, centralised power plants towards thousands of smaller sites dotted around the country.