Mapped: The sensitivity of the world’s ecosystems to climate
Sensitivity
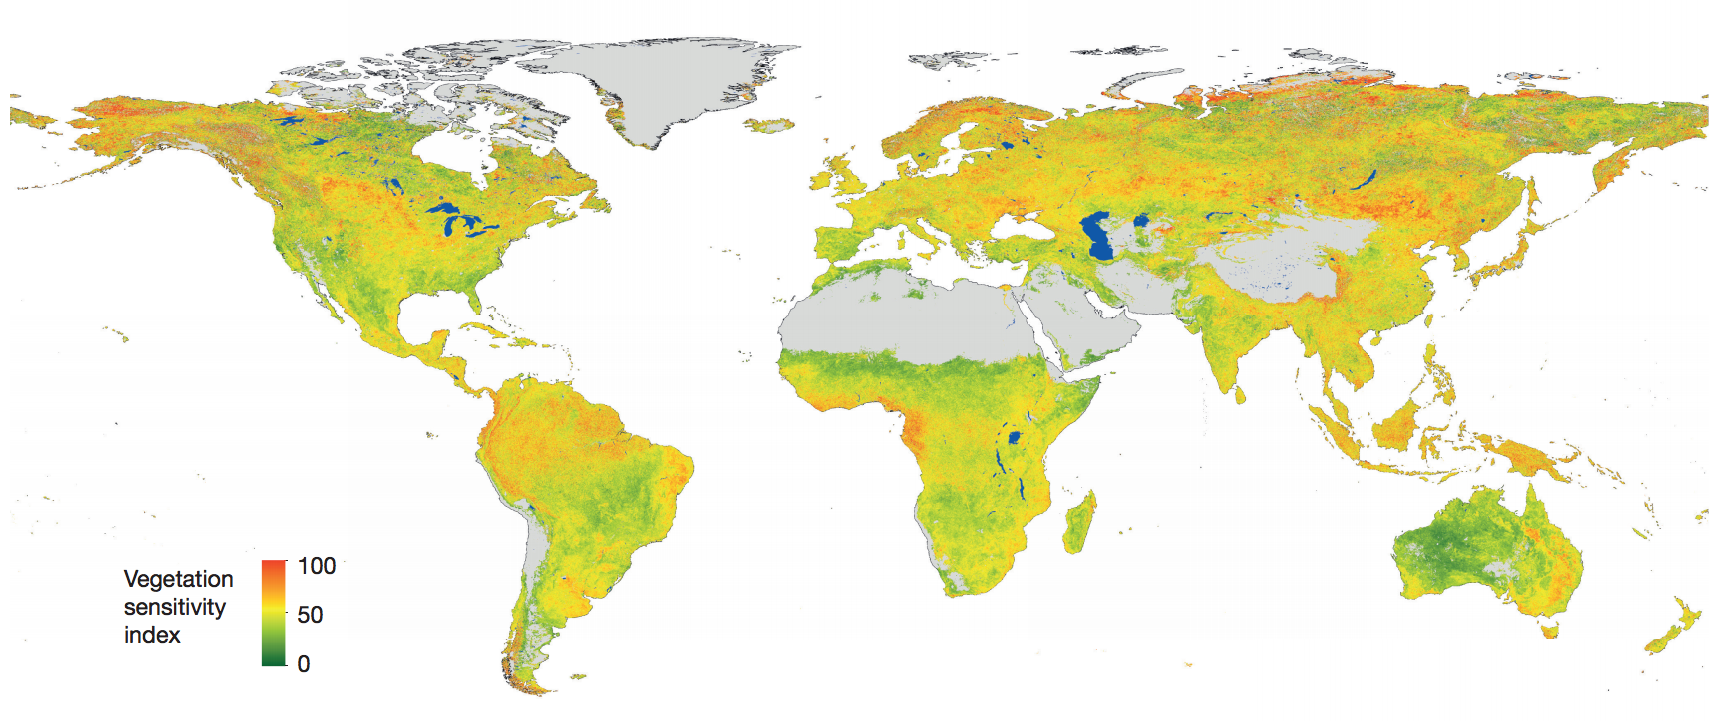
So, how do the researchers work out if an ecosystem is “sensitive” or not? Plants need warmth, water and sunlight (as well as nutrients) in order to grow. Using satellite data for 2000-13, the researchers estimated how plant growth across the world has varied with fluctuations in temperature, water availability and cloud cover. Satellites measure changes in plant growth by the “greenness” of the vegetation. Lead author Dr Alistair Seddon, a researcher at the University of Bergen, explains to Carbon Brief:“[An ecosystem] with a large variability in the climate variable – for example, lots of fluctuations around the average conditions – but a small variability in vegetation greenness would not be responding very much, so scores low sensitivity in our index. The opposite – low variability in climate and high variability in vegetation greenness – would score high on the index.”
The map demonstrates how satellite data can be used to measure how ecosystems respond to the climate, says Prof Alfredo Huete, from the University of Technology Sydney, in an accompanying “news and views” article. This will help scientists understand what the future holds for the Earth’s vegetation under climate change, he writes:
“Only through an understanding of vegetation’s responses to current climate variability can we improve predictions of the future consequences of such variability on our planet’s ecosystems and biodiversity, as well as on our own food security and welfare.”
Climate variables
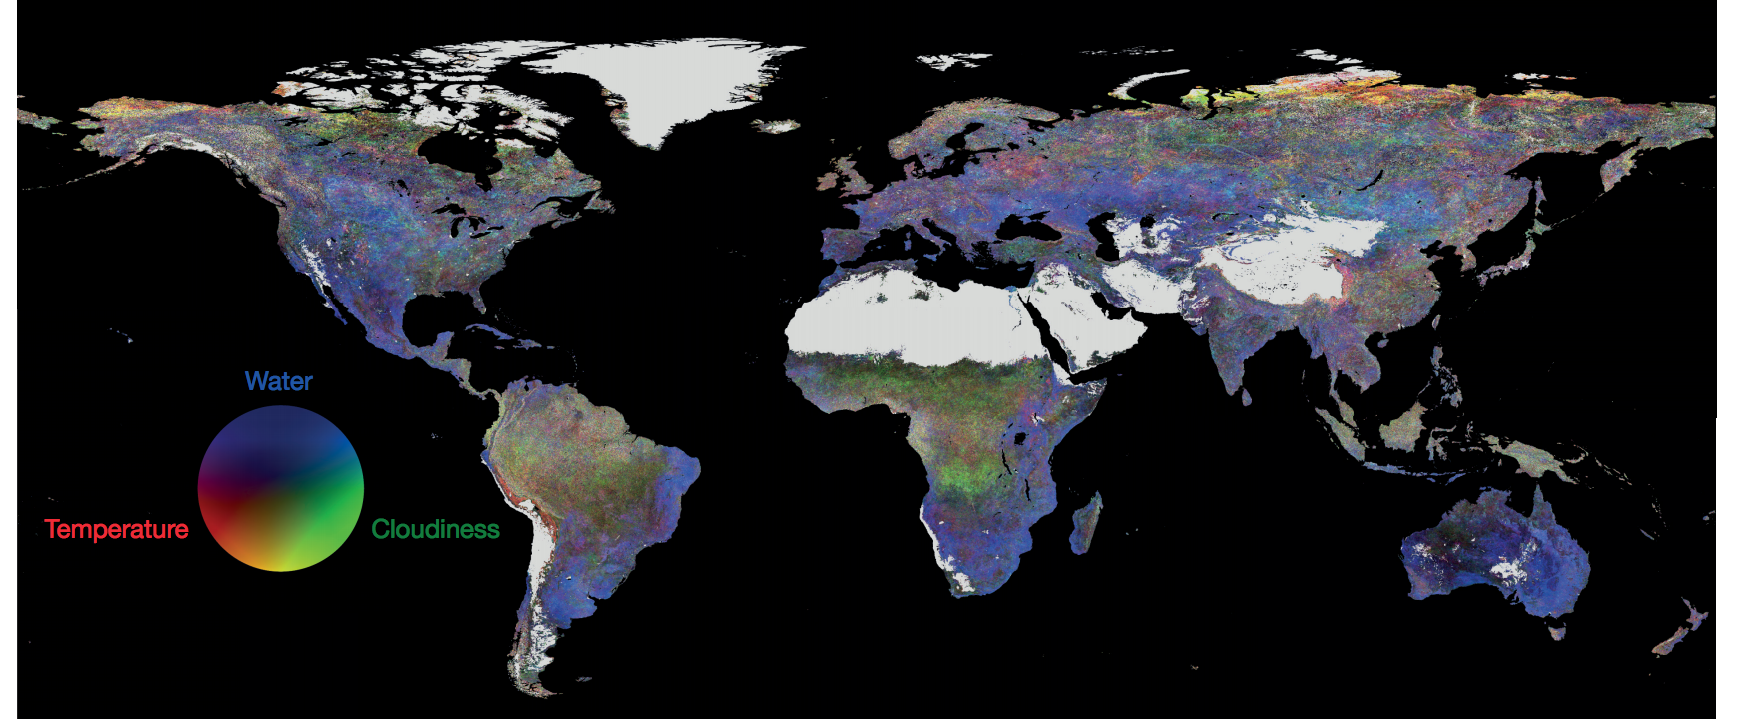
The researchers also worked out which of the three climate variables is most important for each ecosystem. Seddon explains:“[I]t depends on where you are in the world. A plant in the Arctic experiences much colder temperatures, and these colder temperatures can act as the main factor for limiting growth. In a dry shrubland in Australia, water would be more important.”
For areas that are consistently warm and wet, such as tropical rainforests, plant growth depends heavily on fluctuations in cloud cover affecting the sunlight they receive, adds Seddon.
You can see this in a second map below. For example, the tropical forests in the Amazon, central Africa, and southeast Asia are most sensitive to cloudiness, so they are mostly shaded green. On the other hand, the vast prairie grasslands in the middle of North America are sensitive to water availability, and so they appear blue in the map. Areas that are very sensitive to more than one climate variable show a combination of colours, so purple areas, for example, are sensitive to both temperature (red) and water availability (blue).
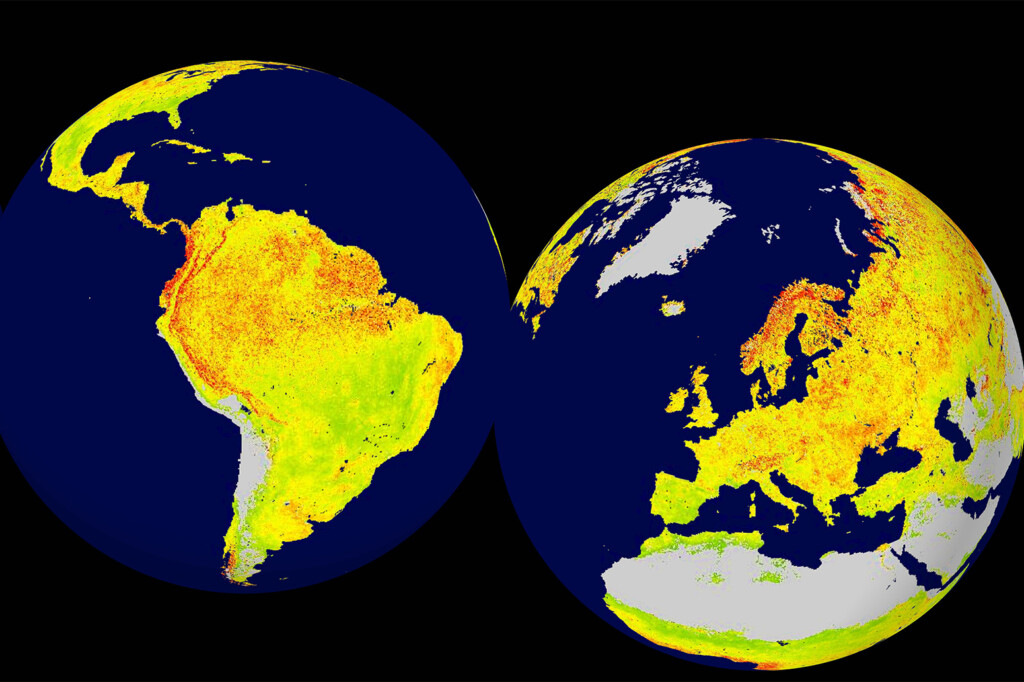
Main image: Global snapshot of the Vegetation Sensitivity Index. Credit: Seddon et al (2016).
Article information
Seddon, A. W. R. et al. (2016) Sensitivity of global terrestrial ecosystems to climate variability, Nature, doi:10.1038/nature16986 & Huete, A. (2016) Vegetation’s responses to climate variability, Nature.