Q&A: Is Antarctica gaining or losing ice?
What did the new study do?
The study, published in the Journal of Glaciology, calculates the changes in ice over the entire Antarctic ice sheet from 1992 to 2008. The ice sheet comprises three parts: East Antarctica, West Antarctica and the Antarctic Peninsula.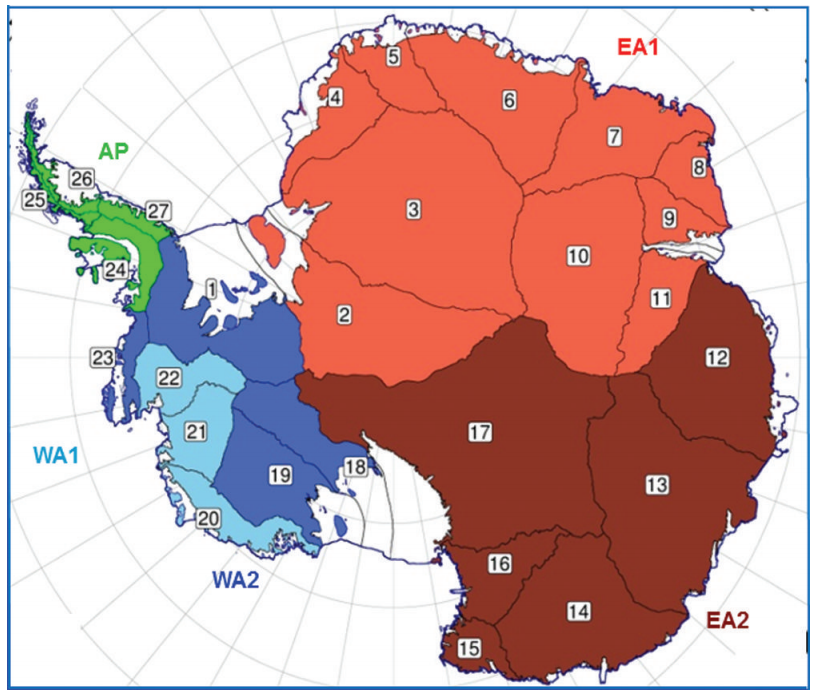
What does the study say about different parts of Antarctica?
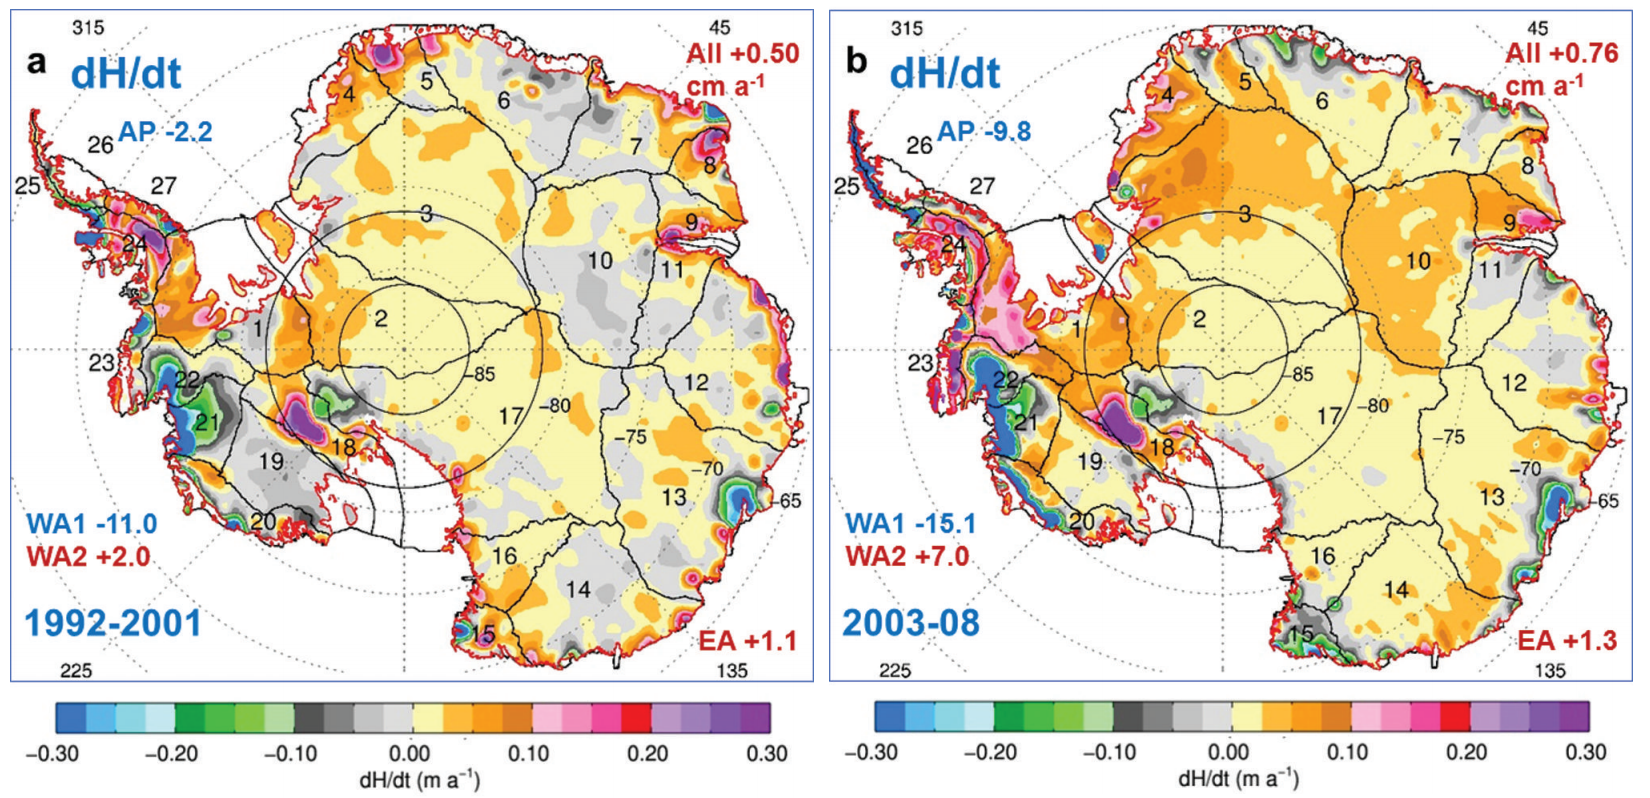
As you can see from the map below, the changes in ice mass has varied quite a lot over the different regions of Antarctica over the 17 years the study covers. The left-hand map shows changes between 1992-2001, and the right-hand map shows changes between 2003-08.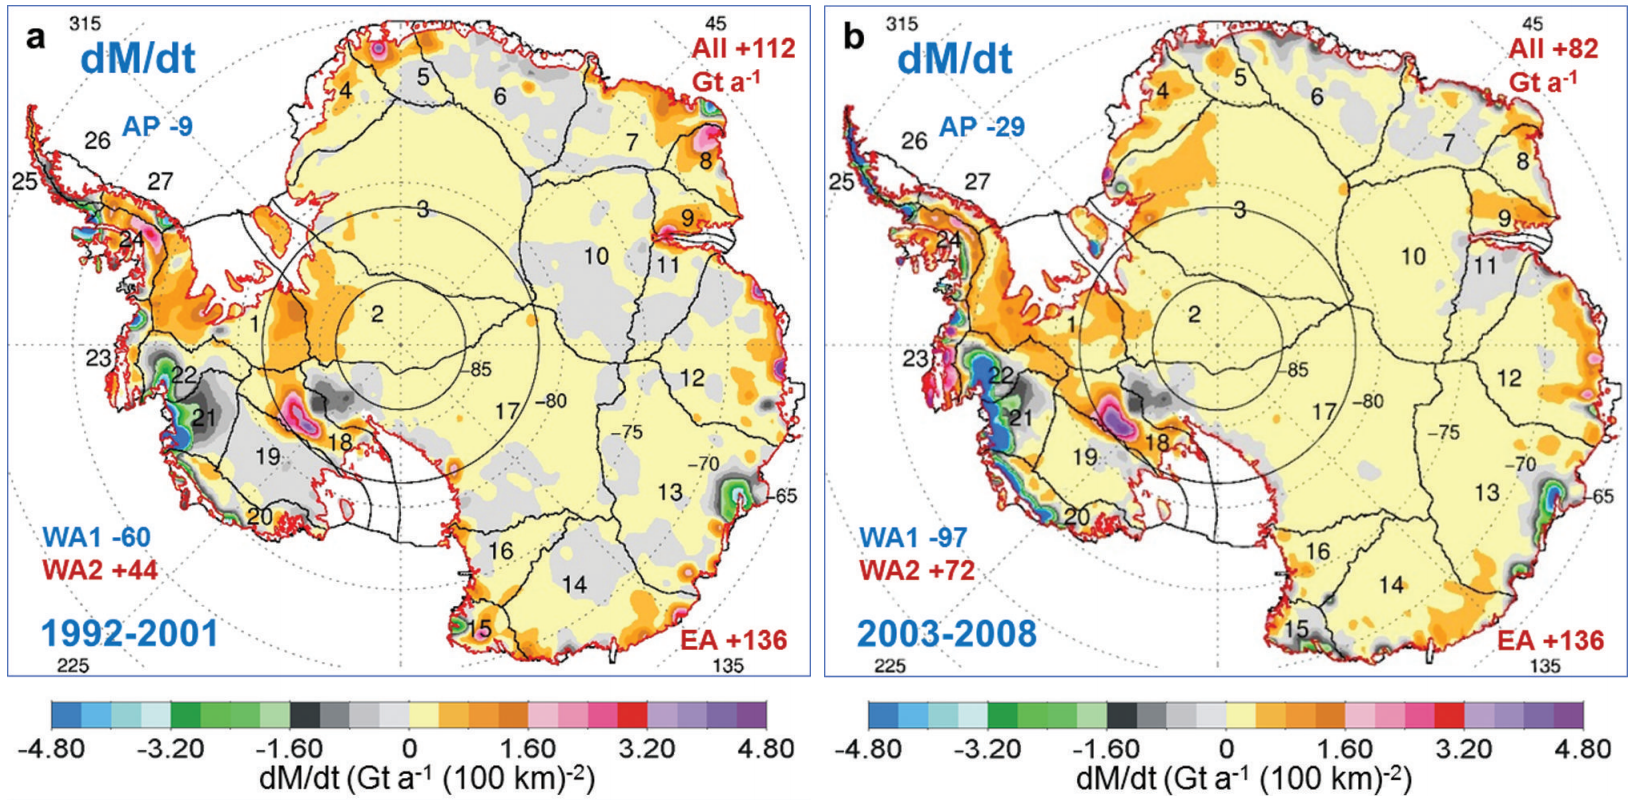
What does it say about Antarctica overall?
The study concludes that the gains in ice over East Antarctica outweigh the losses on WAIS and the peninsula between 1992 and 2008. This is what prompted the headlines in today’s papers. So, where is this extra ice on East Antarctica coming from? The researchers say it all started around 10,000 years ago, at the end of the last Ice Age. As the air warmed up, it could hold more moisture, and the amount of snow that fell onto the ice sheet doubled. Since then, this extra snow has gradually been compacting into ice, making the ice sheet thicker. A small amount of thickening spread across most of East Antarctica translates to a lot of ice gained. Even a recent decrease in snowfall hasn’t slowed down this long-term process, they say. But the gap between ice gained and ice lost is getting smaller. Between 1992 and 2001, the net gain was 112bn tonnes a year, the paper finds. This dropped to 82bn tonnes between 2003 and 2008. If ice loss from WAIS and the peninsula continues to accelerate, this gain would soon be reversed, lead author Dr Jay Zwally said in a NASA press release:I don’t think there will be enough snowfall increase to offset these losses.What’s important to note here is that the study ends in 2008, and there is evidence that ice loss in some regions has, indeed, accelerated since then.
What does the latest data show?
Some of the more recent studies use the CryoSat-2 satellite, which was launched in 2010. A paper published in July analysed the first three years of this data, and finds that between 2010 and 2013, West Antarctica, East Antarctica, and the Antarctic Peninsula lost 134bn, 3bn, and 23bn tonnes of ice per year, respectively. A paper based on the same data found that the volume of ice lost from the WAIS has trebled between 2003-09 and 2010-14. The study also notes that although ice on some parts of the East Antarctica has thickened, the gains only partly compensate for the losses elsewhere on the ice sheet. Another study published earlier this year finds that multiple glaciers in the southern Antarctic Peninsula have started thinning more rapidly, from no net ice loss during the 2000s to 56bn tonnes per year since 2009. And research published last year suggests that retreat of major glaciers on the WAIS are now past the point of no return, potentially leading to the eventual collapse of the entire WAIS in the centuries and millennia to come. In other words, there have been a lot of changes in Antarctica over the last seven years that the NASA study hasn’t included.Can we trust the new study?
Measuring ice changes on Antarctica has long been problematic – particularly on East Antarctica. The many different satellite missions of different durations makes it tricky to get a consistent view of what is happening to the ice sheet. The findings of the new NASA study are “at least somewhat at odds with multiple lines of other evidence,” says Prof Richard Alley from Penn State University, who wasn’t involved in the research. He points to another recent paper – which some of the authors of the new study also contributed to – as the current scientific consensus on ice loss from Antarctica. That paper found changes between 1992 and 2011 of +14bn, -65bn and -20bn tonnes of ice per year on East Antarctica, West Antarctica, and the Antarctic Peninsula, respectively. Prof Andy Shepherd from the University of Leeds, who led the study that Alley refers to, says the NASA study attempts the difficult job of accounting for snowfall, which can mask changes in ice sheet thickness. He tells Carbon Brief:It’s right to attempt this, but in places where nothing much happens – like the interior of Antarctica, which is a vast a desert – it’s really quite difficult to be sure that snowfall can be simulated with enough precision to detect ice imbalance.Prof Jonathan Bamber, a professor at the University of Bristol whose work focuses on satellite monitoring of the ice sheets, says there are also potential pitfalls in combining radar and laser satellite data for the two different time periods, as the NASA study does. He tells Carbon Brief:
At a whole ice sheet scale, the results between the two time periods that they study appear to be consistent. But when you start to look at a slightly smaller regional level – and I’m still talking about thousands of kilometres – then it is doesn’t appear to be quite so consistent, and that is a bit of a worry.Nonetheless, Bamber says, the reasons the researchers give for inconsistencies in previous estimates of ice changes on Antarctica and why their estimates are different, are “completely plausible”.
Does it challenge the IPCC?
The NASA press release claims the study “challenges the conclusions of other studies, including the Intergovernmental Panel on Climate Change’s (IPCC) 2013 report, which says that Antarctica is overall losing land ice”. In its Fifth Assessment Report (AR5), the IPCC concludes that, based on the evidence available, Antarctica is losing ice:Overall, there is high confidence that the Antarctic ice sheet is currently losing mass.While the new study isn’t consistent with the latest IPCC report, says Bamber, it has to be interpreted in light of many other studies that have given different results. The IPCC process draws conclusions based on the research available at the time. It also includes all available research published up to 2012, covering multiple satellites and their various techniques. The new study will be one of the many studies that feeds into the next assessment report.
Does it give a reason not to worry about climate change?
No. The new study doesn’t contest that global sea levels are rising. Rather, it says that if Antarctica is getting thicker overall, the 0.27mm per year that scientists thought the ice sheet was contributing to sea levels must instead be coming from elsewhere. As Alley puts it:What is absolutely obvious is that this does not in any way mean that we don’t need to worry about sea level rise from our warming.It will take a number of other studies, both satellite and on-the-ground research, to confirm if the new NASA study is correct about East Antarctica. If it is confirmed, it will still only apply up to 2008, not to the present day. This limits how much it can usefully tell us, Alley concludes:
While the new work will feed into the next assessments, I don’t see anything in it that really changes our overall picture that we face future sea level rise from our warming, nor does this do much to the best estimate of how much rise we face.
Main image: Icy Landscape, Weddell Sea, Antarctica. © Jürgen & Christine Sohns/imageBROKER/Corbis.
Article information
Zwally, H. J. et al. (2015) Mass gains of the Antarctic ice sheet exceed losses, Journal of Glaciology, doi:10.3189/2015JoG15J071. Updated: 04/11/2015 at 11:00 to add comment from Prof Andy Shepherd.