Scientists dismiss claims of “fiddling” global temperature data
Roz Pidcock
02.10.15Roz Pidcock
10.02.2015 | 5:30pmThis January, we saw the usual flurry of announcements by the world’s major meteorological agencies as they raced to release their official figures for global surface temperature in 2014.
No sooner had the dust settled on the news that 2014 was the warmest year on record than climate skeptic columnist Christopher Booker had a series of articles in The Sunday Telegraph claiming scientists were “fiddling” the data.
Suggesting this tampering reveals “the biggest science scandal ever”, Booker’s says:
“[O]fficial temperature records â?¦ were systematically “adjusted” to show the Earth as having warmed much more than the actual data justified”.
This isn’t a new claim. It’s not uncommon in some parts of the media to see articles popping up questioning the reliability of the global temperature data record. Booker himself wrote a very similar one last summer. But scientists have shown many times that this argument holds no water.
Taking Earth’s temperature
Global temperature may be a simple enough concept, but it’s not as easy as you might think. You can read more about what goes into taking Earth’s temperature in our Carbon Brief explainer, here.
Scientists piecing together global temperature have to deal with a number of issues. One of the main ones is a lack of data in remote parts of the world, such as the Arctic.
But checks are made on a more basic level, too. There are millions of instruments across the world measuring temperature and scientists have to check they’re doing it reliably.
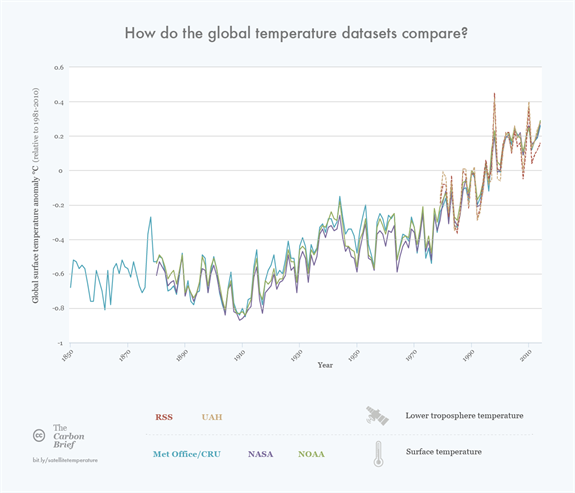
Global average temperature anomalies for the major global surface temperature datasets (Met Office/CRU, NASA and NOAA) and the tropospheric temperatures (RSS and UAH). All temperatures are relative to 1981-2010 average. Source: Rosamund Pearce, Carbon Brief
Changes in space and time
Prof Tim Osborn from the Climatic Research Unit at the University of East Anglia, the group that co-produces the HadCRUT4 surface temperature record with the UK Met Office, tells Carbon Brief:
“Temperature records from weather stations suffer from all sorts of artificial artefacts, whether from moving a city centre weather station to more rural site, from the encroachment of urban sprawl around a weather station, or from changing the time of day when readings are taken.”
It’s also important if a station is moved, explains Steven Mosher on the And Then There’s Physics blog.
“A measurement is taken at a time and place. If you change the place or location, then basic principles suggest that you need to examine or control for changes in the location.”
Mosher is part of the Berkeley Earth (BEST) team, a project established in 2010 primarily to address skeptic’s concerns about potential biases from issues such as data selection, data adjustment and station quality. The BEST scientists reanalysed the global temperature record, finding that these issues “did not unduly bias the record”.
It’s clear when a change of instrument or location has caused an error because a station will show very different temperature from its surroundings, explains Dr Kevin Cowtan from the University of York in the video below. Cowtan co-wrote a paper last year which attempted to reconstruct missing Arctic data in the HadCRUT4 dataset using satellite data.
Homogenisation
Scientists have three choices when faced with errors in the data, Osborn tells Carbon Brief.
“One, throw all the data away and leave decision makers to develop climate policy in ignorance of how the Earth’s climate may have changed over the last century and a half.”
Option two is to leave the data as it is. This isn’t ideal, but not out of the question, says Osborn:
“It turns out that you can get a good global temperature picture this way, because many of the artefacts have opposite influences which cancel out when averaging across the globe, though the reliability at regional scales will be poor.”
But the best option is to use the data to estimate how temperatures may have changed if the weather stations and observing practices had stayed the same over time, a process known as homogenisation. Osborn explains how this is done:
“The adjustments are usually judged by comparison with neighbouring weather stations that did not have an artificial change at that time.”
In effect, the process means that when stretches of temperature data for a station that has seen a change in its equipment, location or sampling time are spliced together, some bits are adjusted up or down to remove artificial changes between sections.
This process results in a more reliable dataset, rather than compromising it, Mosher explains:
“Adjustments aim at correcting measured data, raw data, in order to improve its quality.”
Indeed, climate skeptics have suggested similar adjustments in the past to avoid distorting the “real” data, Mosher adds. One example is the suggestion that changing the paint inside the housing around temperature sensors from whitewash to latex may have introduced a bias in the temperature record, for which it was suggested the data needed adjusting.
A non-story
In a guest blog post, BEST scientists Robert Rohde, Zeke Hausfather and Steve Mosher show the graph below, which shows the very small difference before (red) and after (blue) homogenisation. They explain:
“[T]he effect of adjustments on the global time series are tiny in the period after 1900 and small in the period before 1900.”
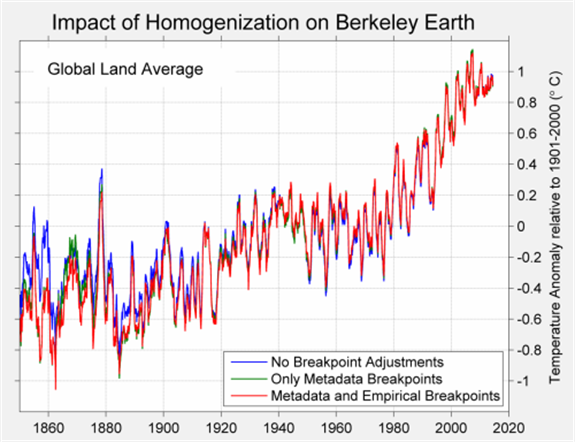
In other words, the warming trend is clear with or without homogenisation.
The reason homogenisation makes very little difference is that the process shifts temperature data in both directions, up and down. So it’s important not to draw general conclusions about which way adjustments are made in a specific part of the world:
“[I]t is possible to look through 40,000 stations and select those that the algorithm has warmed; and it’s possible to ignore those that the algorithm has cooled â?¦ [I]t is also possible to select entire continents where the algorithm has warmed the record; and, it’s possible to focus on other continents were the opposite is the case.”
The point is that on balance, the adjustments “mostly cancel each other out” and the overall effect is “inconsequential”, the BEST scientists conclude.