10 charts showing why carbon emissions stalled last year
Update: You can now read our analysis of BP’s Statistical Review of World Energy 2016.
Strong growth in solar and wind was accompanied by stalling growth in fossil fuels use and energy-related emissions last year, the BP Statistical Review of World Energy 2015 shows.
Solar continues to exceed expectations, with output expanding by 38% during 2014. Wind also grew in double digits, though its 10% growth rate was down on the 24% average rate seen in the previous decade. Coal demand growth slumped from 3.6% over the decade to just 0.4% last year. Oil and gas also grew by less than 1%, far below historical averages – in line with predictions from the International Energy Agency.
Shifts in China’s model of economic growth once again dominated the global energy story. It accounted for three-quarters of the increase in renewable electricity generation, while its coal use and emissions stalled.
Carbon Brief has produced ten charts using BP review data, showing why these shifts in energy use helped global energy-related carbon emissions stall in 2014.Emissions and coal
The BP data confirms that previous growth in carbon dioxide emissions stalled in 2014, in line with early indications first reported by the Financial Times in March. What’s even more remarkable is that the global economy performed strongly last year, growing by 3.2%.
This suggests GDP and emissions could be decoupling. Indeed, the 2014 figure appears to be part of a trend towards slower emissions growth that has followed the post-recession bounce in 2010 (blue bars, below left).
Previous pauses or reductions in global emissions have been associated with seismic events that caused a weak economy (red line, below left), for instance the financial crisis in 2008/9 and the collapse of the Soviet Union in the early 1990s.
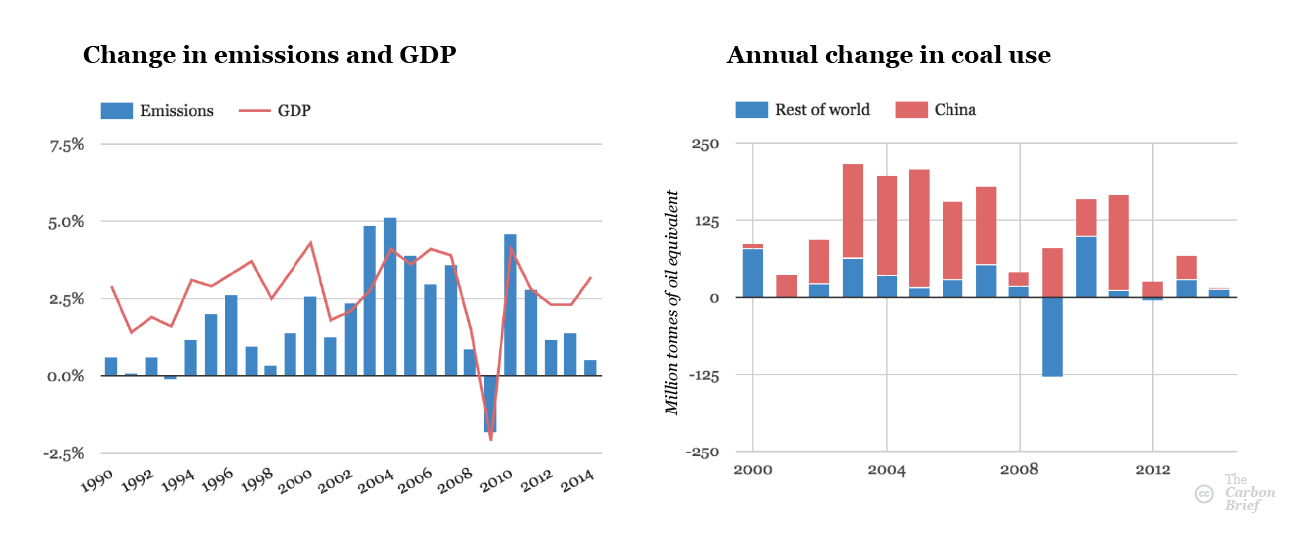
A large part of the reason emissions stalled last year, despite strong GDP growth, was slow global coal demand and near-zero emissions growth in China (blue and red bars, above right). After a decade-long binge of expansion, some analysts are arguing Chinese coal use could have peaked.
It’s worth noting that BP and official Chinese statistics have at times been heavily revised in the past, including a 19% increase in the coal consumption figure for 2007 between the 2013 and 2014 BP data, so neither source can be considered definitive. It’s also possible, according to BP chief economist Spencer Dale, that Chinese demand will rebound.
Another point of interest is India’s coal use. Its coal growth of 36 million tonnes of oil equivalent (Mtoe) during 2014 (11%) offset a 19Mtoe (6.5%) reduction in the EU, twice over.
Low-carbon sources eclipse fossil fuels
Another reason why emissions stalled in 2014 is that energy demand grew relatively slowly. The increase in demand between 2013 and 2014 of below 1% was less than half the average seen over the previous four decades. Again, this should be seen in the context of strong GDP growth.
The slowing trend in energy demand has been satisfied by reduced growth in fossil fuel use (grey bars, below left). In contrast, renewables have maintained relatively steady increases since 2010 (green bars). This means low-carbon energy accounted for more than half of the change in energy demand between 2013 and 2014, the first time this has happened for more than two decades (green and purple bars, below right).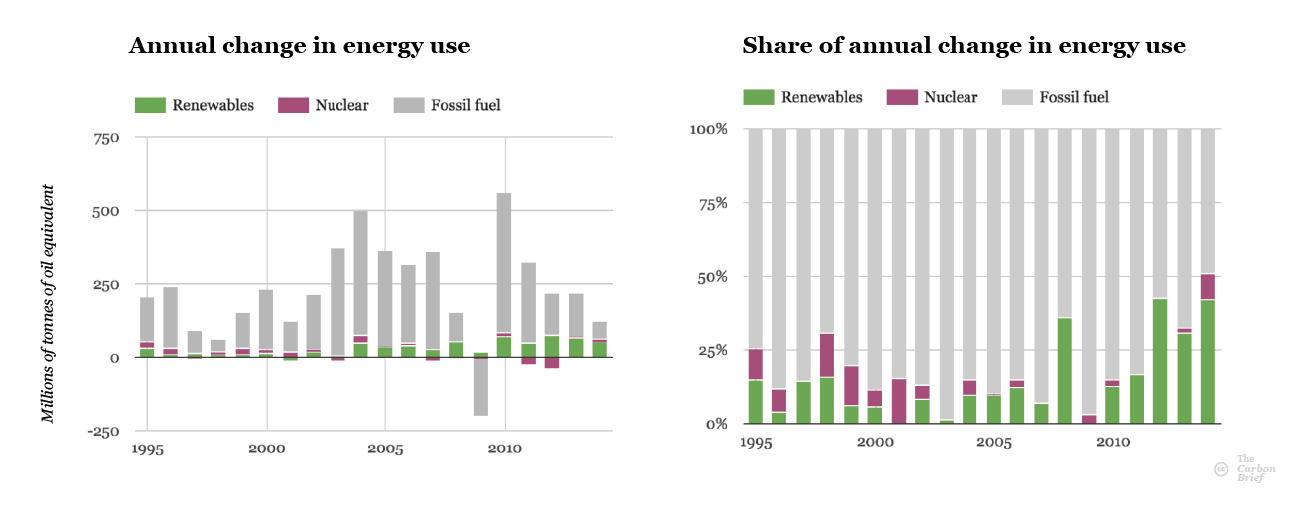
The steady increase in renewable energy output in 2014, including a 38% boost for solar and 10% for wind, conceals reduced growth rates for both sources. Solar had averaged more than 50% growth for a decade and nearly doubled between 2010 and 2011. Wind had averaged 25% growth.
China dominates renewables
It’s becoming increasingly well-known that China is the global engine of growth for renewable energy. The latest BP review strengthens this view, showing how China has driven the expansion of renewable electricity generation for a decade (red area, below left).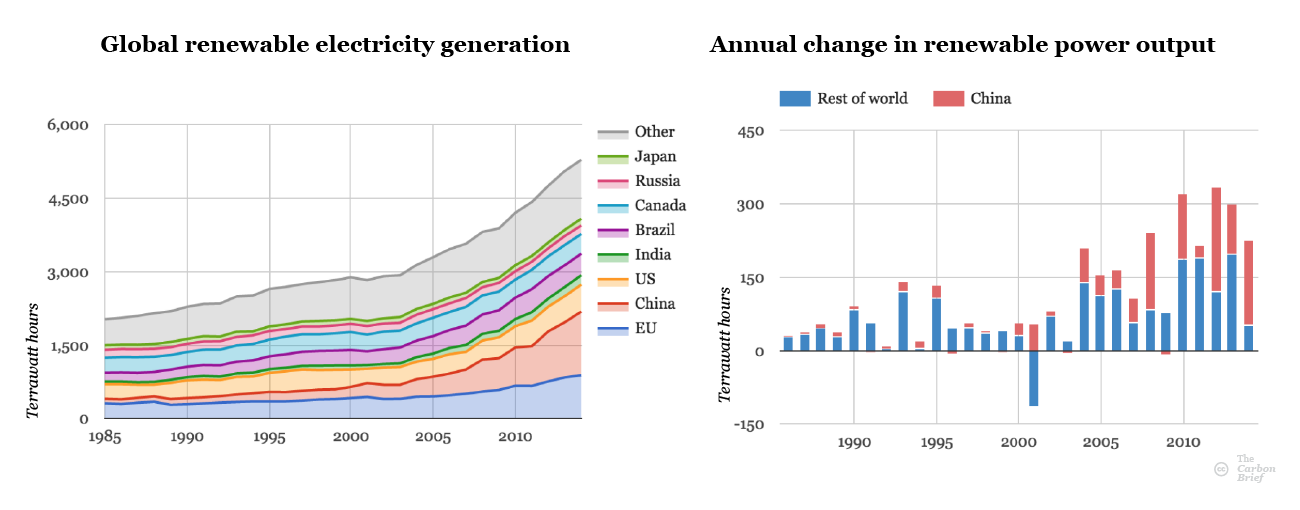
China added three times as much new renewable power generation (red bars, above right) during 2014 as the rest of the world put together (blue bars). China is widely expected to continue being the largest investor in renewables growth for the next quarter-century.
World renewable leaders
In 2014, China generated more than two times as much renewable electricity, with 1,299 terawatt hours (TWh) as the US, its nearest competitor, which generated 549TWh. The top five nations for renewables in 2014 is completed by Brazil (438TWh), Canada (400TWh) and India (192TWh). The UK is 15th, with 64TWh and Germany, with 161TWh is seventh. Update: as of 31 March 2025, this map is no longer interactive.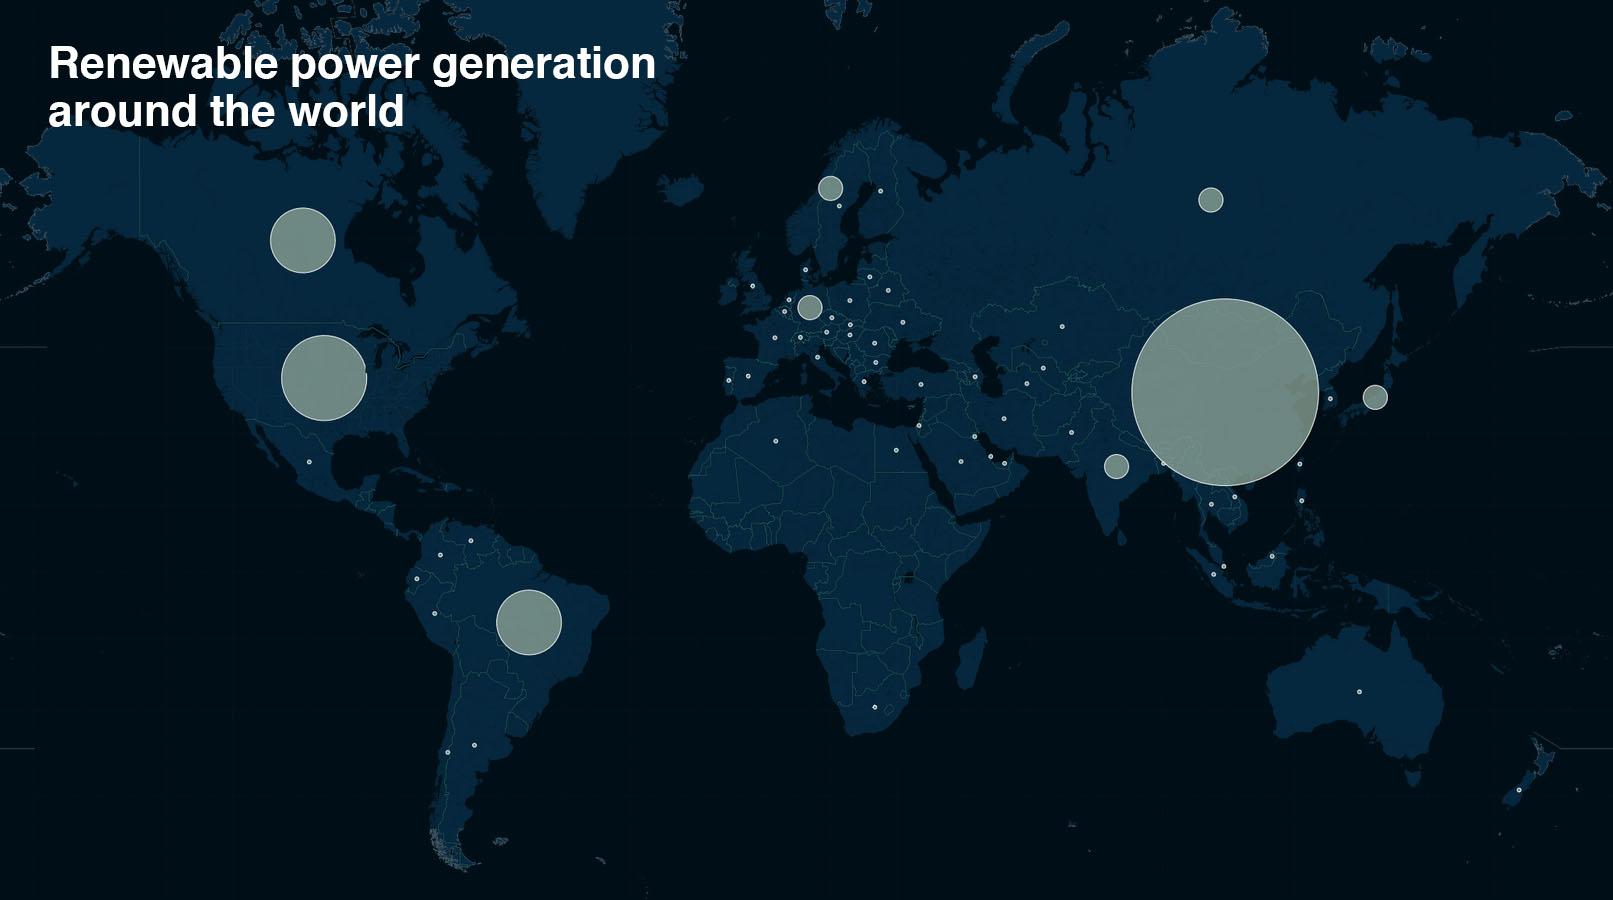 Renewable power output during 2014, by country. The area of the bubbles is proportional to generation in terawatt hours, but there is a minimum circle size below which all outputs look the same. Click image to view the interactive version. Source: BP Statistical Review of World Energy 2015. Map by Rosamund Pearce for Carbon Brief, using CartoDB. Full-size map here.
The lion’s share of global renewable electricity in 2014 (74%) came from hydroelectricity. A map of non-hydro renewable electricity generation changes the ranking we saw above, with the US instead of China taking top spot.
The US generated 287TWh of power from solar, wind, geothermal and biomass power sources last year. Second place goes to China, with 235TWh. The top five is completed by Germany (140TWh), Spain (71TWh) and Brazil (68TWh). The UK ranks in the top ten, with 59TWh.
Renewable share of energy nudges ahead
Given the continuing increases in renewable energy generation and the larger share of additional demand satisfied by low-carbon sources during 2014, it’s perhaps tempting to imagine that efforts to tackle energy-related emissions are starting to see success.
A recent Bloomberg article said fossil fuels had “lost the race” against renewables because more renewable electricity generating capacity had been installed than for fossil fuels. There are several reasons why this paints a misleadingly optimistic picture, however.
Foremost among them is that despite growth in renewable energy use (green areas, below), fossil energy has been racing ahead, too, and it had a massive head start. As a result, the share of global energy use satisfied by renewables remains below 10% (below right).

Article information
Update 17:30 – We added clarification that the emissions referred to are only energy-related carbon dioxide emissions, not total carbon dioxide emissions.