Guest post: Climate change has caused one-fifth of Pine Island glacier retreat

Dr Alex Bradley
06.29.26Dr Alex Bradley
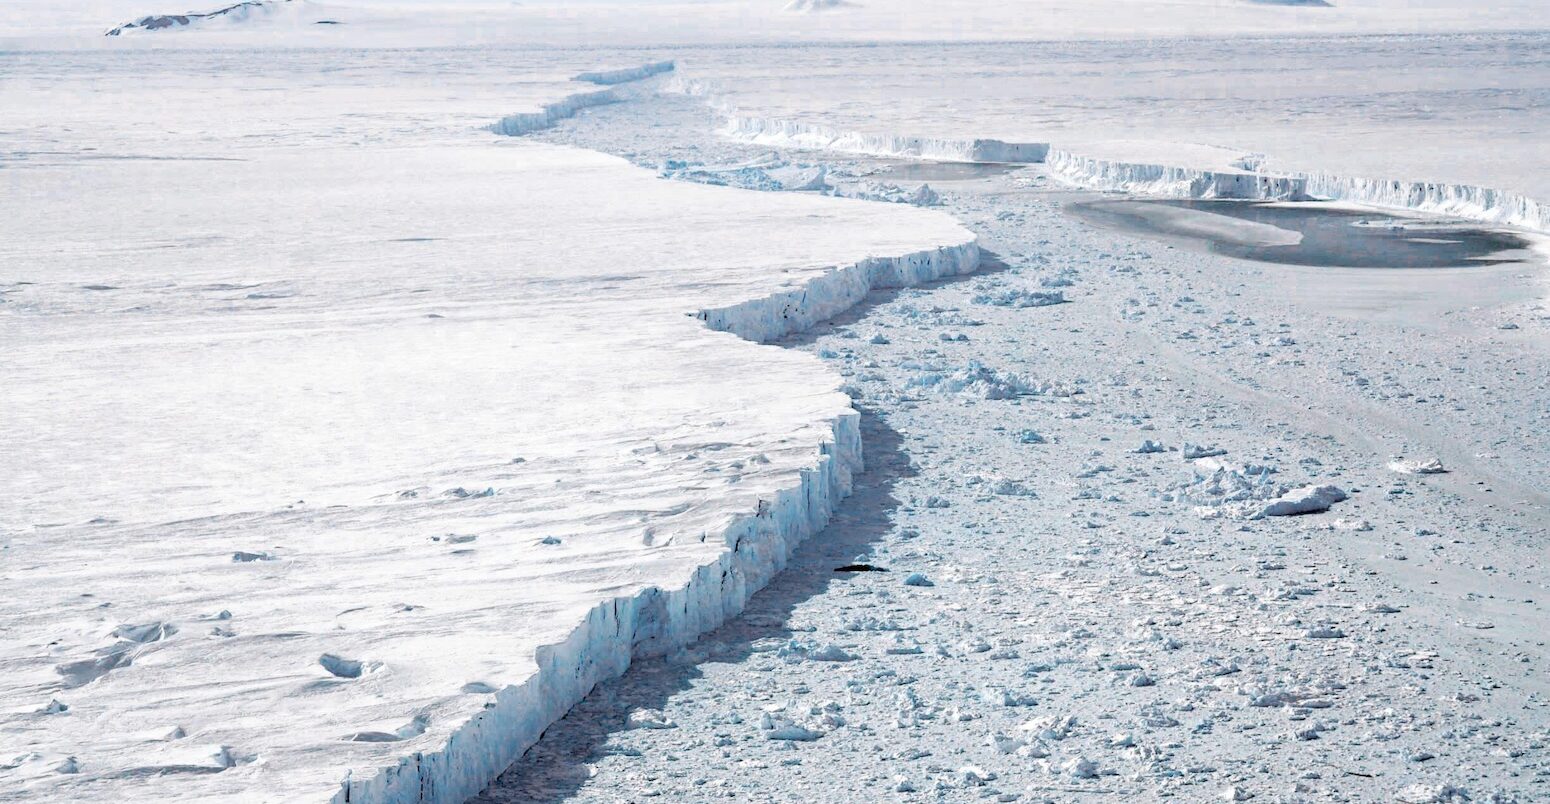
29.06.2026 | 12:01amThe Pine Island glacier in West Antarctica is one of the fastest-changing glaciers in the world.
Alongside its neighbour, the Thwaites glacier, it is responsible for almost half the sea level rise caused by melting ice sheets in Antarctica.
Scientists know the West Antarctic ice sheet – which includes Thwaites and Pine Island – is retreating because of warm water eroding the ice sheet from below.
But the extent to which this process has been driven by human-caused greenhouse gas emissions, as opposed to natural variations to the Earth’s climate, remains unknown.
Our study, published in the Cryosphere, looks at how human-caused warming has contributed to the retreat of the Pine Island glacier since pre-industrial times.
The research, the first attribution study of glacier retreat on Antarctica, finds that climate change has been responsible for around 4km – roughly a fifth – of the glacier’s retreat.
The West Antarctic ice sheet
Glaciers are frozen rivers of ice and snow that move slowly over land. They are found at high elevations on mountains and on ice sheets.
There are two ice sheets on Earth – covering Antarctica and Greenland. Both were formed over millennia, as layers of snow compressed into dense ice.
Ice sheets grow and shrink depending on temperature and snowfall conditions. In the past, when global temperatures were much colder than present day, vast ice sheets also covered large areas of North America, Scandinavia and Patagonia.
Today, human-driven climate change is accelerating the retreat of ice sheets. This is contributing to sea level rise and altering the Earth’s climate system by pumping vast quantities of fresh melt water into the ocean.
Our research looks at the Pine Island glacier, which is found on the western part of the Antarctic ice sheet.
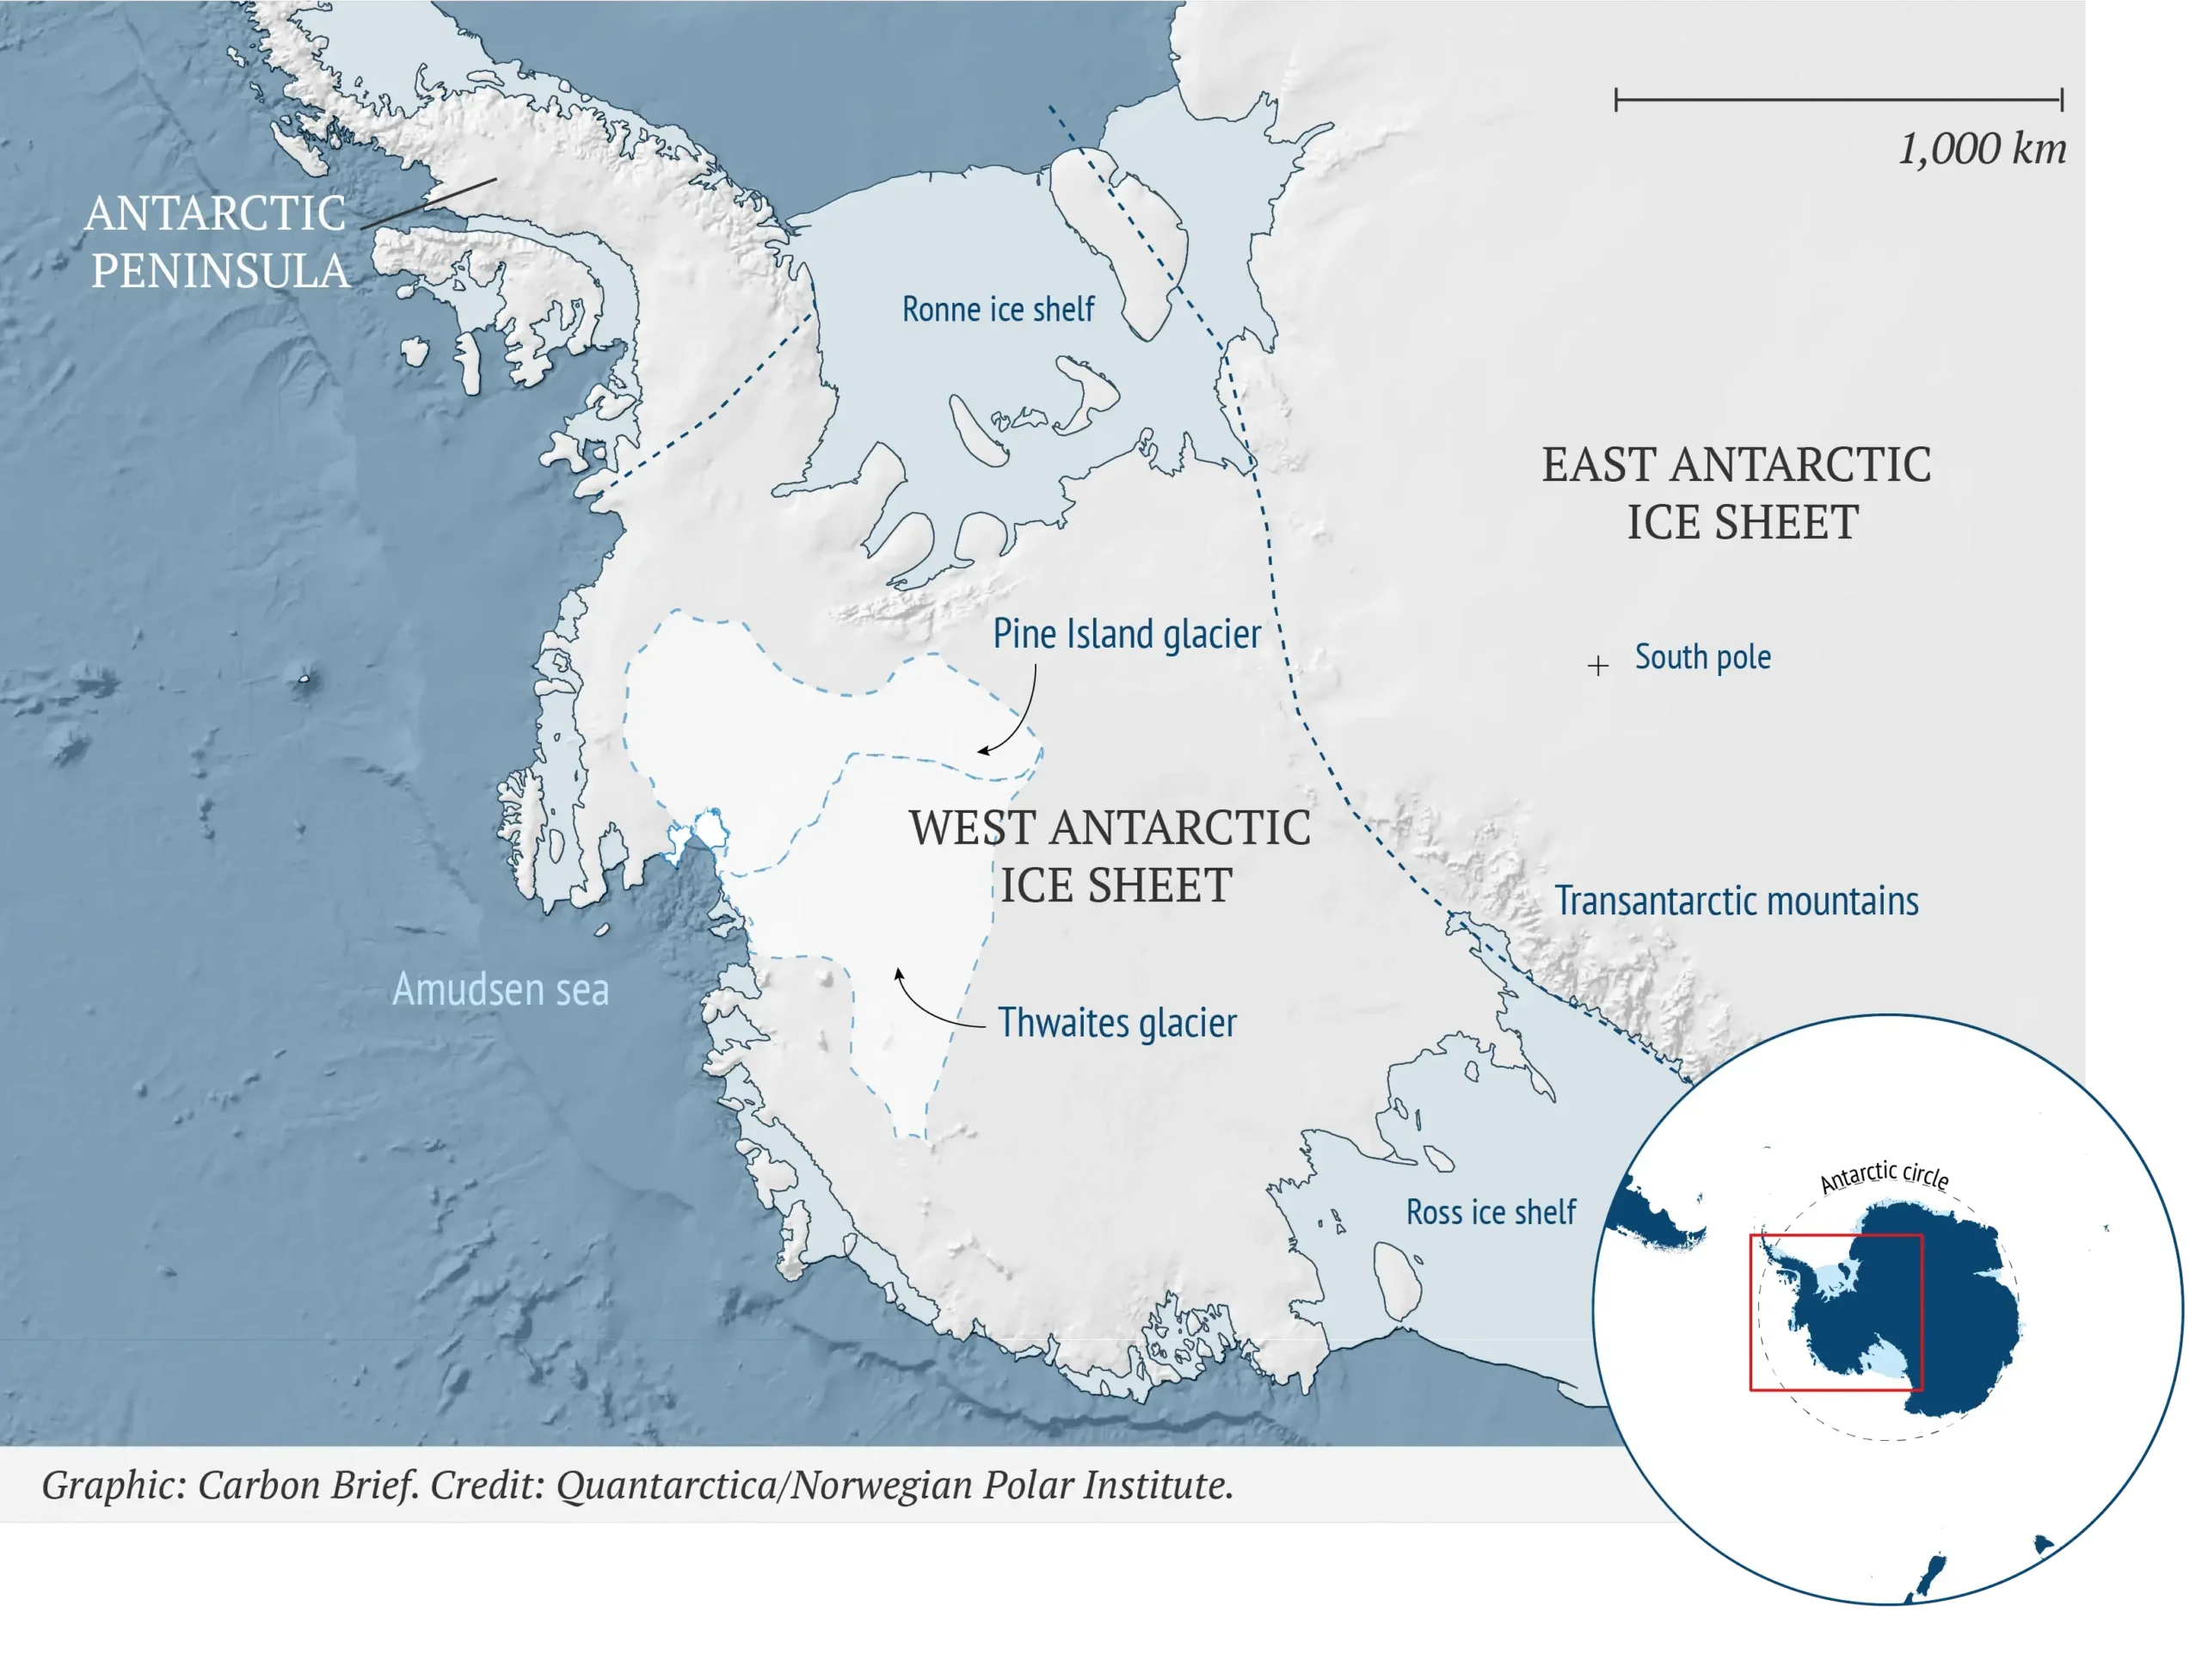
It is one of the fastest-melting glaciers in the world. Research has shown it has been responsible for a fifth of net ice loss from the West Antarctic ice sheet, which, in turn, has been responsible for almost all ice loss in Antarctica over the past 40 years.
At the coldest point of the last ice age – the “last glacial maximum” period around 20,000 years ago – the West Antarctic ice sheet was much bigger than it is today. Since then, it has retreated by approximately 500km – roughly the distance from Paris to London.
Most of this retreat took place between 10,000 and 20,000 years ago. For the past 10,000 years or so, the ice sheet has been about as big as it is today.
Sediment records beneath the Pine Island glacier reveal that, for hundreds of years until the 1940s, the glacier rested on a seabed ridge that is about 30km ahead of where it sits today.
The sediment records also tell us that the Pine Island glacier started to retreat in the 1940s. This coincided with a strong El Niño event, a recurring climate pattern in the tropical Pacific that drives up global temperatures, that brought a large pulse of warm water to the ice sheet.
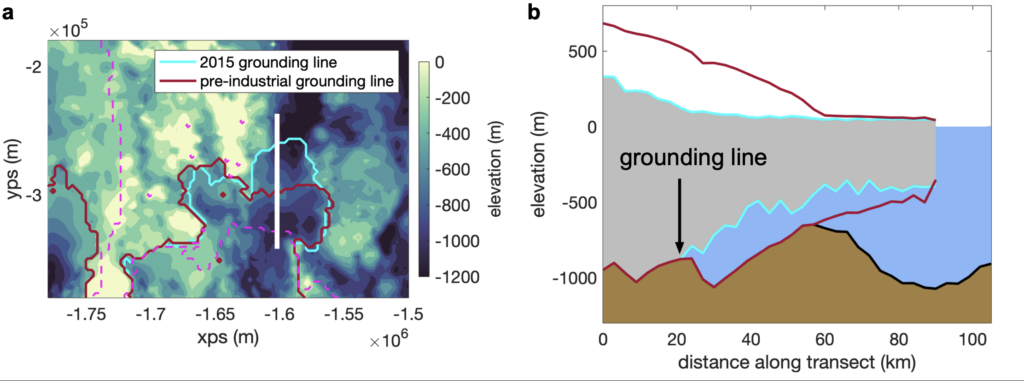
This is illustrated in the figures below, which shows how the grounding line – the boundary between grounded and floating ice – of the Pine Island glacier shifted between pre-industrial times (red line) and 2015 (bright blue line).
The map on the left shows an aerial view of grounding line retreat from pre-industrial times (red) to 2015 (blue). The graphic on the right illustrates how the grounding line has shifted across a cross-section of the glacier.
Both illustrate how the glacier has contracted.
Climate reconstructions suggest that human-caused climate change only started to increase the amount of warm water reaching the West Antarctic ice sheet in the 1960s.
This indicates that climate change started to affect the melt rate in the region 20 years after the retreat had already been initiated.
In our research, we wanted to find out how important climate change was to the overall retreat since the 1940s.
Attributing ice sheet retreat
Currently, scientists do not know precisely how much of the retreat of the world’s ice sheets – and the associated sea level rise – is due to human-caused global warming.
Through the field of attribution science, the links between climate change and extreme weather and climate events, including heatwaves, wildfires and droughts, are routinely quantified by scientists.
In attribution studies, scientists typically use climate models to simulate the severity or frequency of an event in two worlds. The first is our existing, climate-changed world and the second is a “counterfactual” world that has not been affected by human-caused warming.
By comparing the model runs, scientists can assess how much climate change influenced an event.
To create these two modelled worlds in an Antarctic context, scientists need to run historical models for at least 200 years into the past. This is because ice sheets respond very slowly to changes in the climate, with very small changes year-on-year.
This presents a challenge, given the limited information available about ice sheet change before satellite records began in the 1970s.
To build a picture of the ice sheets prior to this, scientists have to rely on a few, sparse, palaeoclimate records – including sediment records and seafloor imprints – which tell us where ice was present in the past.
Reconstructing Pine Island’s past
To reconstruct the retreat of the Pine Island glacier – and, therefore, determine the role of climate change – we used a combination of physical climate models and machine learning.
First, we ran many simulations of our model under a range of different settings. This included variations in how important processes are represented, such as how the ice moves and interacts with the ocean.
Then, we compared the results of these simulations to modern satellite observations and older sediment records, allowing us to narrow down the settings that were most realistic. This gave us a set of plausible simulations that agreed with the available observational data.
However, to reconstruct the retreat in full, we needed to find all settings of our model that would agree with the observational data.
Because simulations take a lot of time to run, this was not possible.
Therefore, to fill the gaps and find all plausible simulations, we used machine learning to identify relationships between model settings and simulated glacier retreat.
This exercise allowed us to build a good picture of how the glacier actually retreated over the past 250 years. We call this our “reconstructed” scenario.
We then compared the glacier retreat in this reconstructed world with changes that took place in a counterfactual scenario where there had been no human-caused climate change.
In doing so, we were able to quantify the role that warming played in the shrinking of the Pine Island glacier since the 1940s.
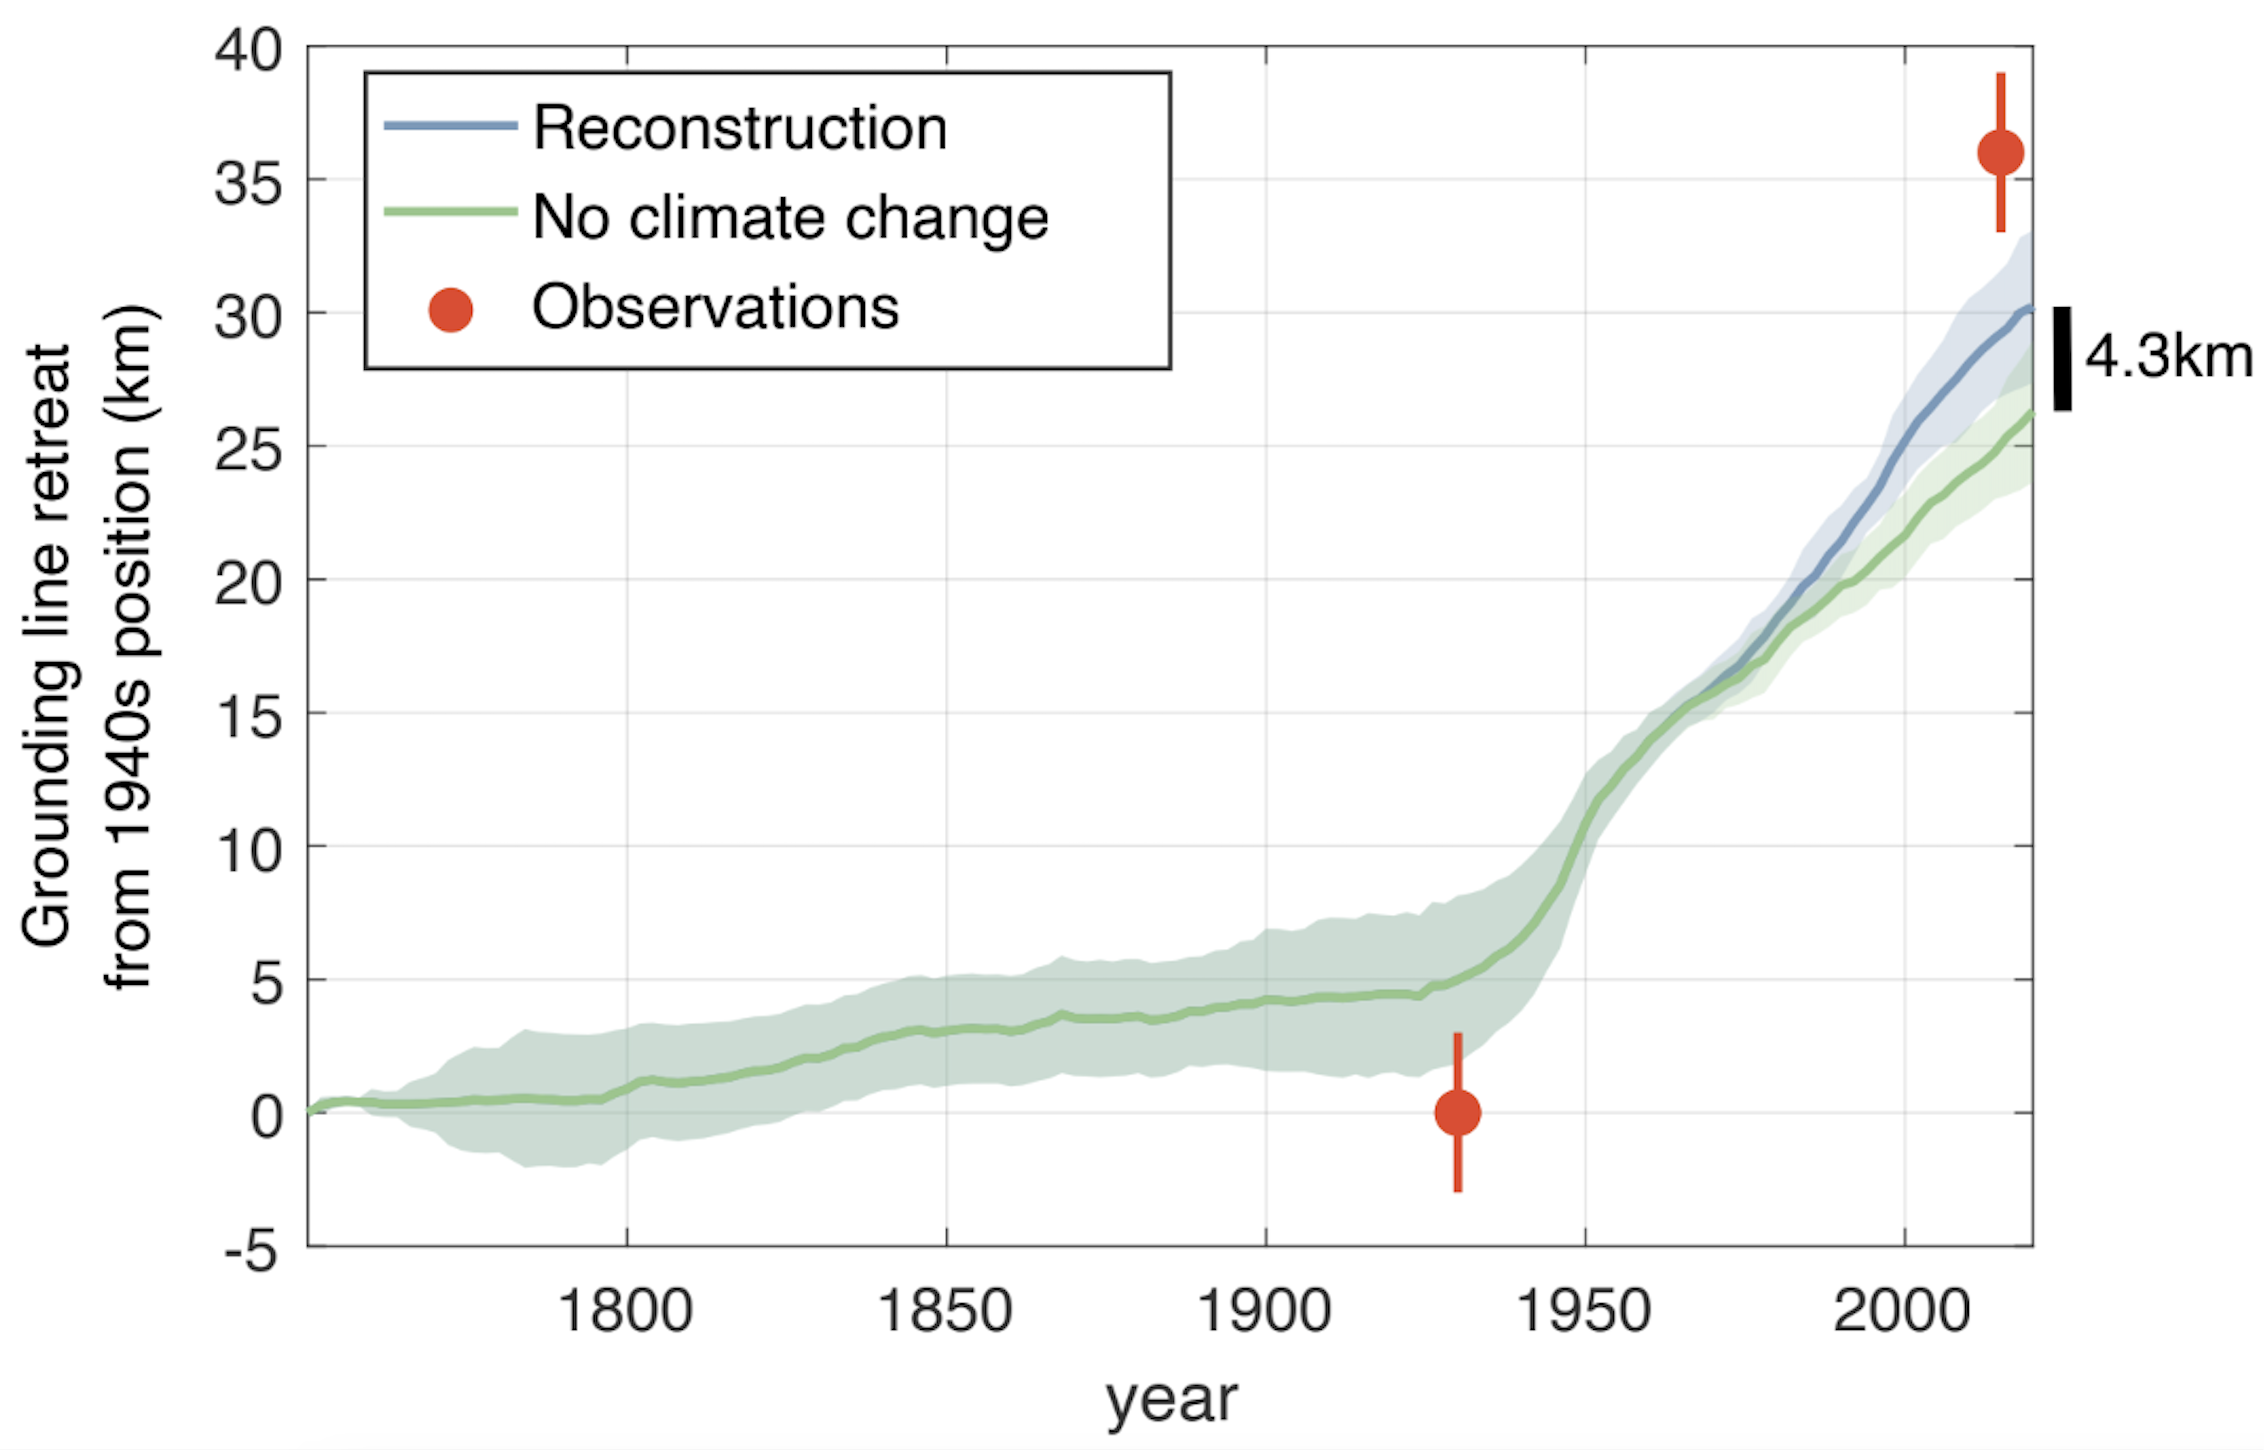
Overall, we estimate that warming has been responsible for around 4km – roughly a fifth – of the glacier’s retreat since 1940.
This is shown in the figure below, which shows how grounding line retreat in the reconstructed scenario (blue) is more extreme than projected by the counterfactual scenario (green).
Interpreting the numbers
Our work quantifies, for the first time, the role of climate change in the retreat of a glacier in the world’s ice sheets – directly linking greenhouse gas emissions with glacier decline.
We also find that the Pine Island glacier may have retreated even without climate change, just not as far. This is similar to how extreme weather events, such as drought or extreme rainfall, could still happen without climate change, just with less frequency or intensity.
One of the key challenges in our research arises from not knowing exactly how large the ice sheet was prior to satellite records.
Although the sediment records tell us where the ice was grounded – that is, what its footprint was – they do not tell us exactly how much ice there was.
This means we do not know exactly how to set up our model at the start of the simulations, which leads to uncertainty in our predictions.
Further work is underway to determine exactly how to best set up the simulations for future research.


Bradley, A. et al (2026), Detection and attribution of the role of anthropogenic climate change in industrial-era retreat of Pine Island Glacier, The Cryosphere, doi.org/10.5194/tc-20-3443-2026