2013’s carbon dioxide emissions are set to hit 36 billion tonnes, scientists announced earlier this week – that’s a rise of around 2.1 per cent on last year’s levels. The assessment comes from academics at some of the world’s top climate research institutes
A big chunk of those emissions will have come from Europe. The region is pretty developed and has a long history of fossil fuel consumption. But it’s currently undertaking a number of wide-reaching energy policies which could see its carbon footprint reduce over the coming years – renewables targets, an emissions trading scheme, as well as national plans for decarbonisation.
To get an insight into Europe’s current emissions, we’ve played around with the Global Carbon Atlas – an online tool released alongside the new carbon dioxide predictions for 2013. It’s not real time data, but looking back to 2012 and 2011 gives a good idea of how the world’s emissions break down. Here are five interesting facts the Atlas reveals about Europe:
1. European countries are among the highest emitters in the world
For a collection of small countries, Europe packs a significant carbon punch. The region contained nine of the world’s top 25 emitters in 2012. Germany had the 6th highest emissions. The UK ranked 13th highest, closely followed by Italy in 16th and France 18th. Consumption of fossil fuels in these countries remains high.

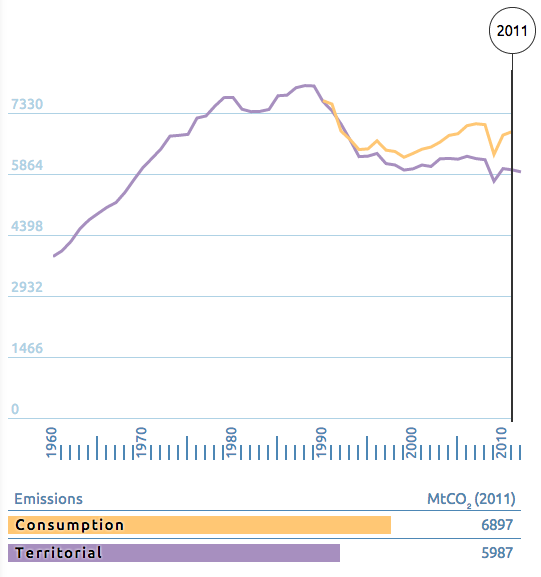
2. Many european countries are responsible for more carbon emissions than they ‘produce’
Generally, governments measure territorial emissions – the amount of carbon dioxide produced inside the boundaries of a country by activities which consume fossil fuels. But there’s another way of looking at it – consumption emissions. That’s a measure of how much carbon is produced by the stuff a country actually uses – inside and outside its borders.
In 2011, the UK’s territorial emissions were around 450 megatonnes of carbon dioxide, but its consumption emissions were an estimated 632 megatonnes (one megatonne is equivalent to one million tonnes). The picture was the same for countries like Italy, France and Germany. Across Europe as a whole, consumption emissions were estimated to be about a billion tonnes higher than territorial emissions in 2011.
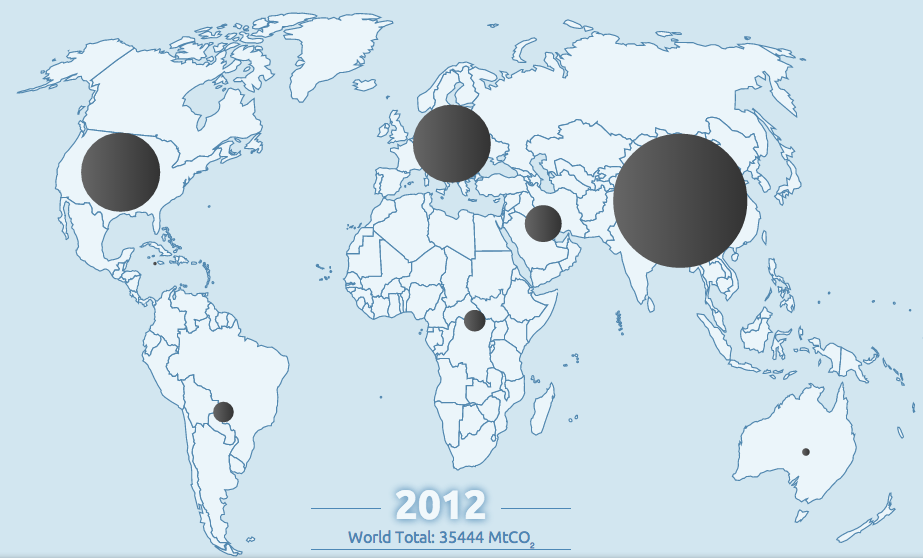
3. Asia and the US beat Europe in emissions terms
Grouped by region, Europe emerged as the third biggest polluter in 2012. It produced nearly 6 billion tonnes of carbon dioxide, in terms of territorial emissions. Asia, the highest overall emitter, produced 16 billion tonnes of carbon dioxide – nearly three times as much – while North America emitted just over 6 billion tonnes.
Smaller amounts of the greenhouse gas were emitted from the oil-rich Middle East (2 billion tonnes), South America (1 billion tonnes) and Africa (1 billion tonnes).
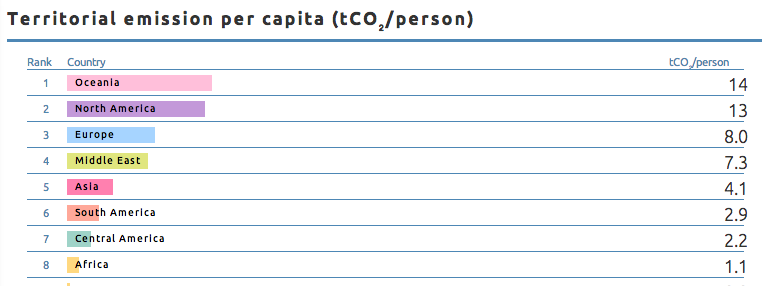
4. Your average American or Australian emits much more than a European
Averaged over the 740 million or so population, Europe’s carbon dioxide emissions in 2012 equalled out at around eight tonnes per person. That’s almost 40 per cent lower than the per capita emissions in North America (13 tonnes per person) and in the Australian-encompassing-region of Oceania (14 tonnes per person).
Europe’s emissions are still twice the size of Asia’s, however, at around four tonnes per person.
5. Europe produced the highest carbon dioxide emissions from burning gas
Of the total 35.5 billion tonnes of carbon dioxide emitted in 2012, 33 per cent of those emissions came from burning gas, says the Global Carbon Project. As a region, Europe was at the forefront of that charge, emitting nearly two billion tonnes of carbon dioxide. That means despite the growth in US shale gas, Europe’s still using more gas – just.
Europe produced roughly the same emissions again burning coal and oil, the Atlas reveals, but carbon emissions from both were highest in Asia.

How does Europe compare?
By many different measures, Europe’s carbon emissions aren’t the highest in the world. In terms of total emissions, Asia and North America emit more. But per person, Europe emits twice as much as Asia. On top of that, Europe has been producing carbon emissions for a lot longer – and so is responsible for a lot more of the total that’s accumulated in the atmosphere.
It’s not a very green picture either when you consider that Germany, the UK, Italy and France all ranked in the top 20 biggest emitters in 2012. If it was based on consumption emissions, they’d have all been in the top 12.
It’s an interesting snapshot of how global emissions have evolved so far, though. A decade or two ago, the comparison with Asia, a region just starting to rapidly consume fossil fuels as it developed, would have been different. Just a few years ago the picture would have been different in North America, as it discovered and began to exploit shale gas. The picture may look different again in the near future.