Analysis: China’s carbon emissions grow at fastest rate for more than a decade
Lauri Myllyvirta
05.20.21Lauri Myllyvirta
20.05.2021 | 4:10pmChina’s carbon dioxide (CO2) emissions have grown at their fastest pace in more than a decade, increasing by 15% year-on-year in the first quarter of 2021, new analysis for Carbon Brief shows.
The post-pandemic surge means China’s emissions reached a new record high of nearly 12bn tonnes (GtCO2) in the year ending March 2021. This is some 600m tonnes (5%) above the total for 2019.
The analysis is based on official figures for the domestic production, import and export of fossil fuels and cement, as well as commercial data on changes in stocks of stored fuel.
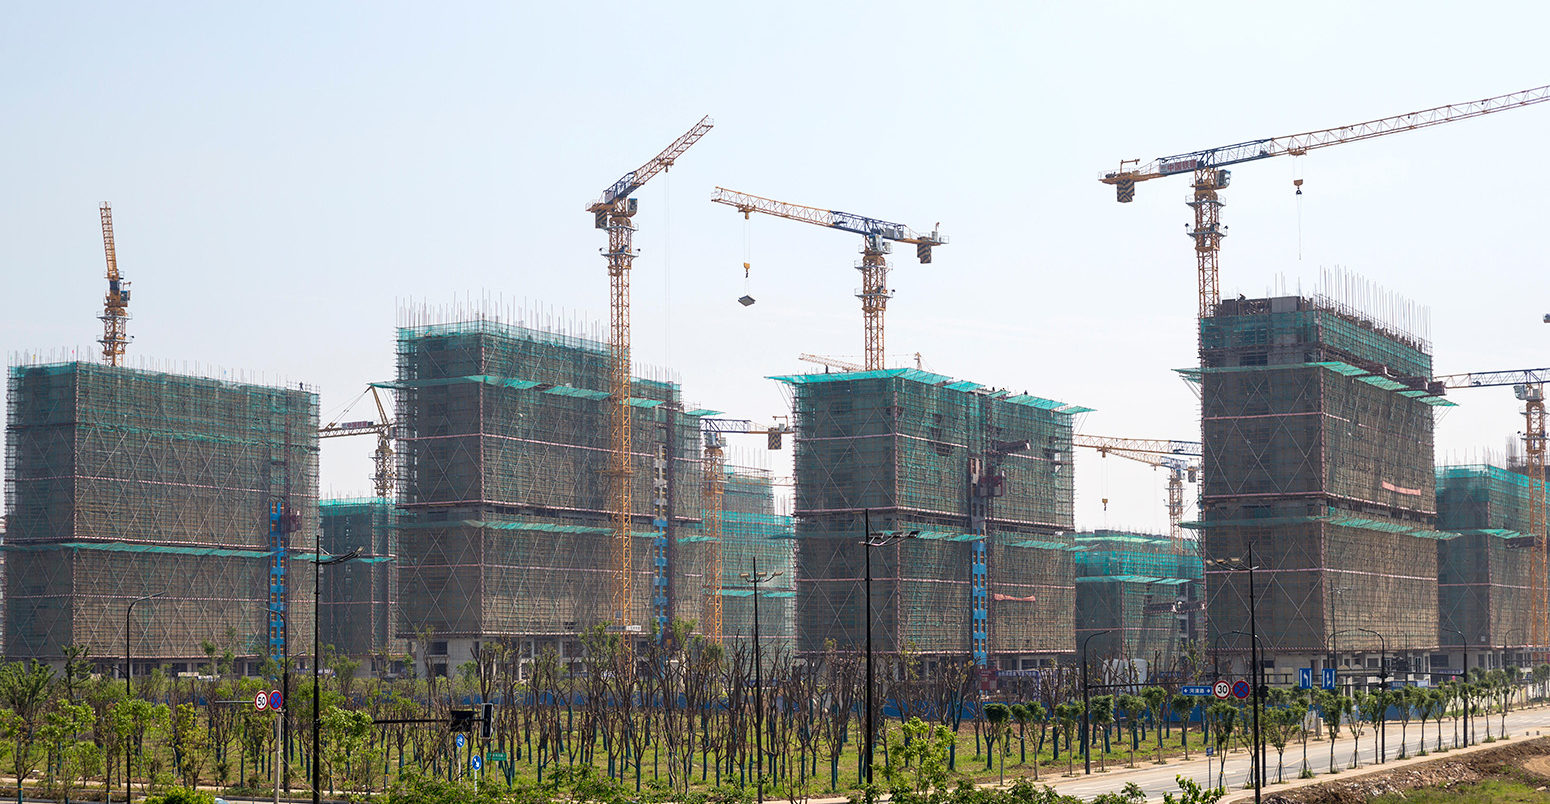
The CO2 surge reflects a rebound from coronavirus lockdowns in early 2020, but also a post-Covid economic recovery that has so far been dominated by growth in construction, steel and cement.
If emissions in 2021 as a whole match the growth seen over the past 12 months, there would be little room for further increases to 2025, under the targets of China’s 14th five-year plan (14FYP).
Fastest growth
In the first quarter of 2021, China’s CO2 emissions from fossil fuels and cement production grew by 14.5%, relative to the same period a year earlier.
This is shown by the red column in the chart, below. Changes for previous quarters are in blue, highlighting the impact of coronavirus lockdowns in the first quarter of 2020.
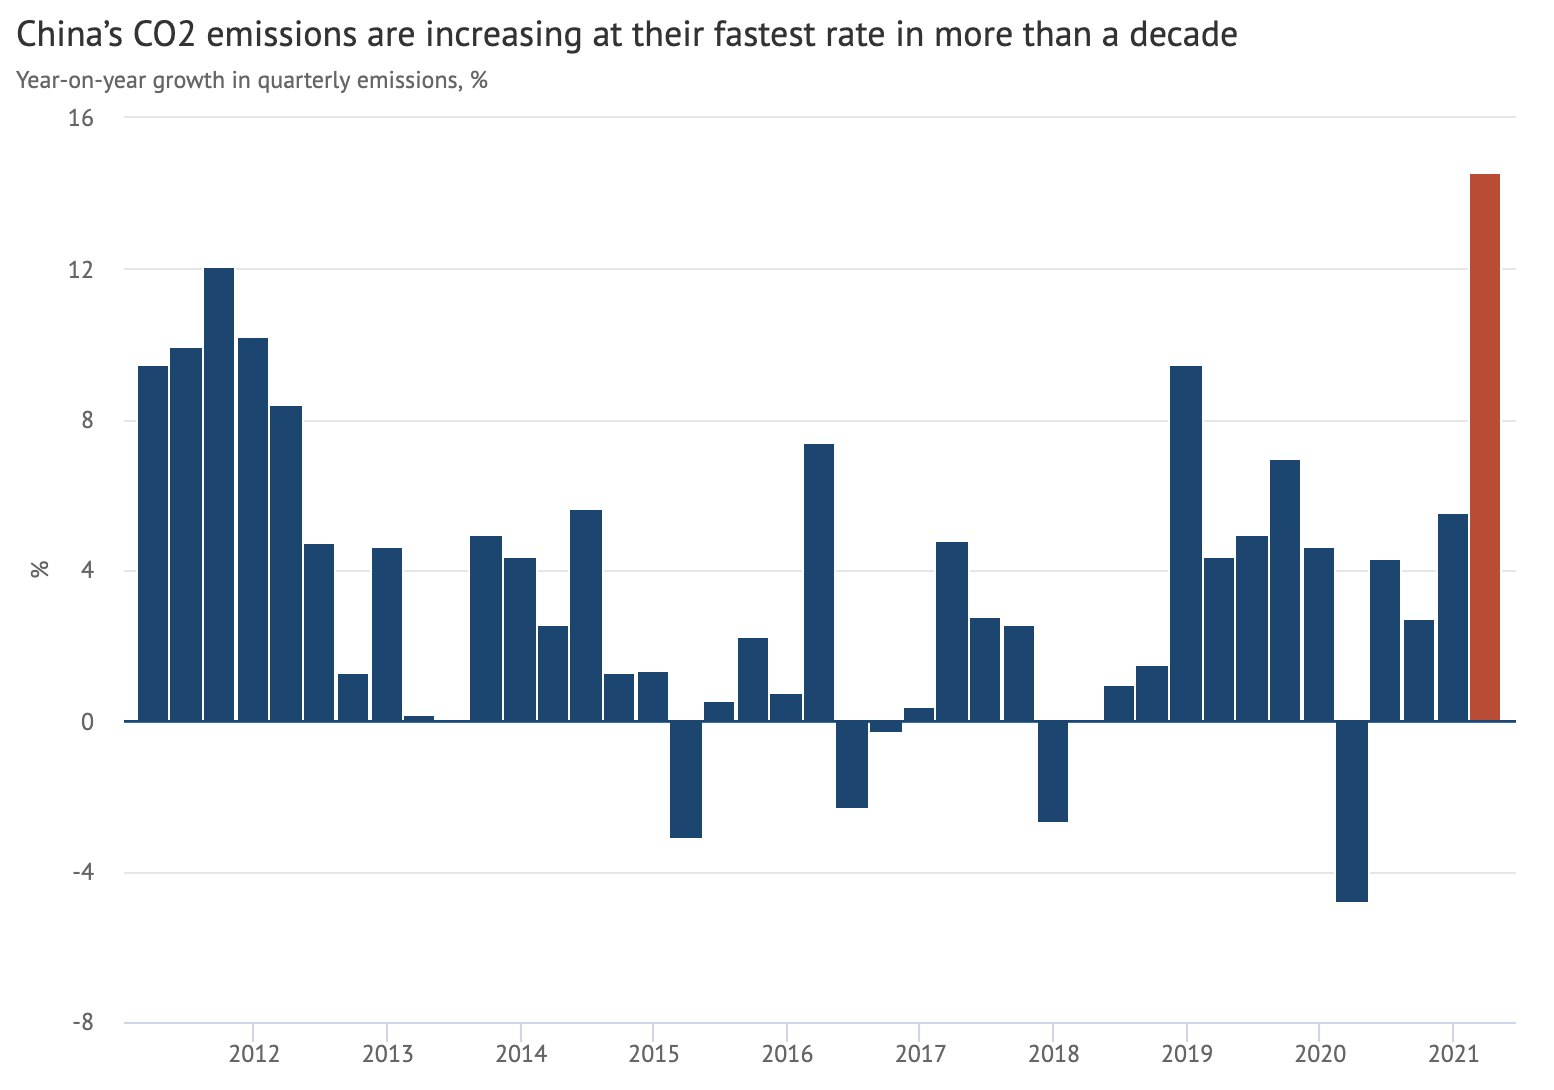
Year-on-year change in China’s quarterly CO2 emissions from fossil fuels and cement, %. Emissions are estimated from National Bureau of Statistics data on production of different fuels and cement, China Customs data on imports and exports and WIND Information data on changes in inventories, applying IPCC default emissions factors and annual emissions factors per tonne of cement production until 2018. Monthly values are scaled to annual data on fuel consumption in annual Statistical Communiques and to National Energy Administration data on coal and fossil gas consumption in the first quarter of 2021. Chart by Carbon Brief using Highcharts.
This estimate of quarterly emissions growth is consistent with, but somewhat lower than figures published recently by the independent Carbon Monitor academic research group, which provides estimates of “real-time” emissions data.
Even against the pre-pandemic first quarter of 2019, January-March 2021 posted growth of 9%, showing that the increase this year is not only a rebound from the impact of lockdowns in 2020.
The latest increase helped push China’s emissions to a new record high of nearly 12GtCO2 in the 12 months to March 2021, as shown in the chart below. This is nearly 600MtCO2 (5%) higher than the total in 2019, which was unaffected by the coronavirus pandemic.
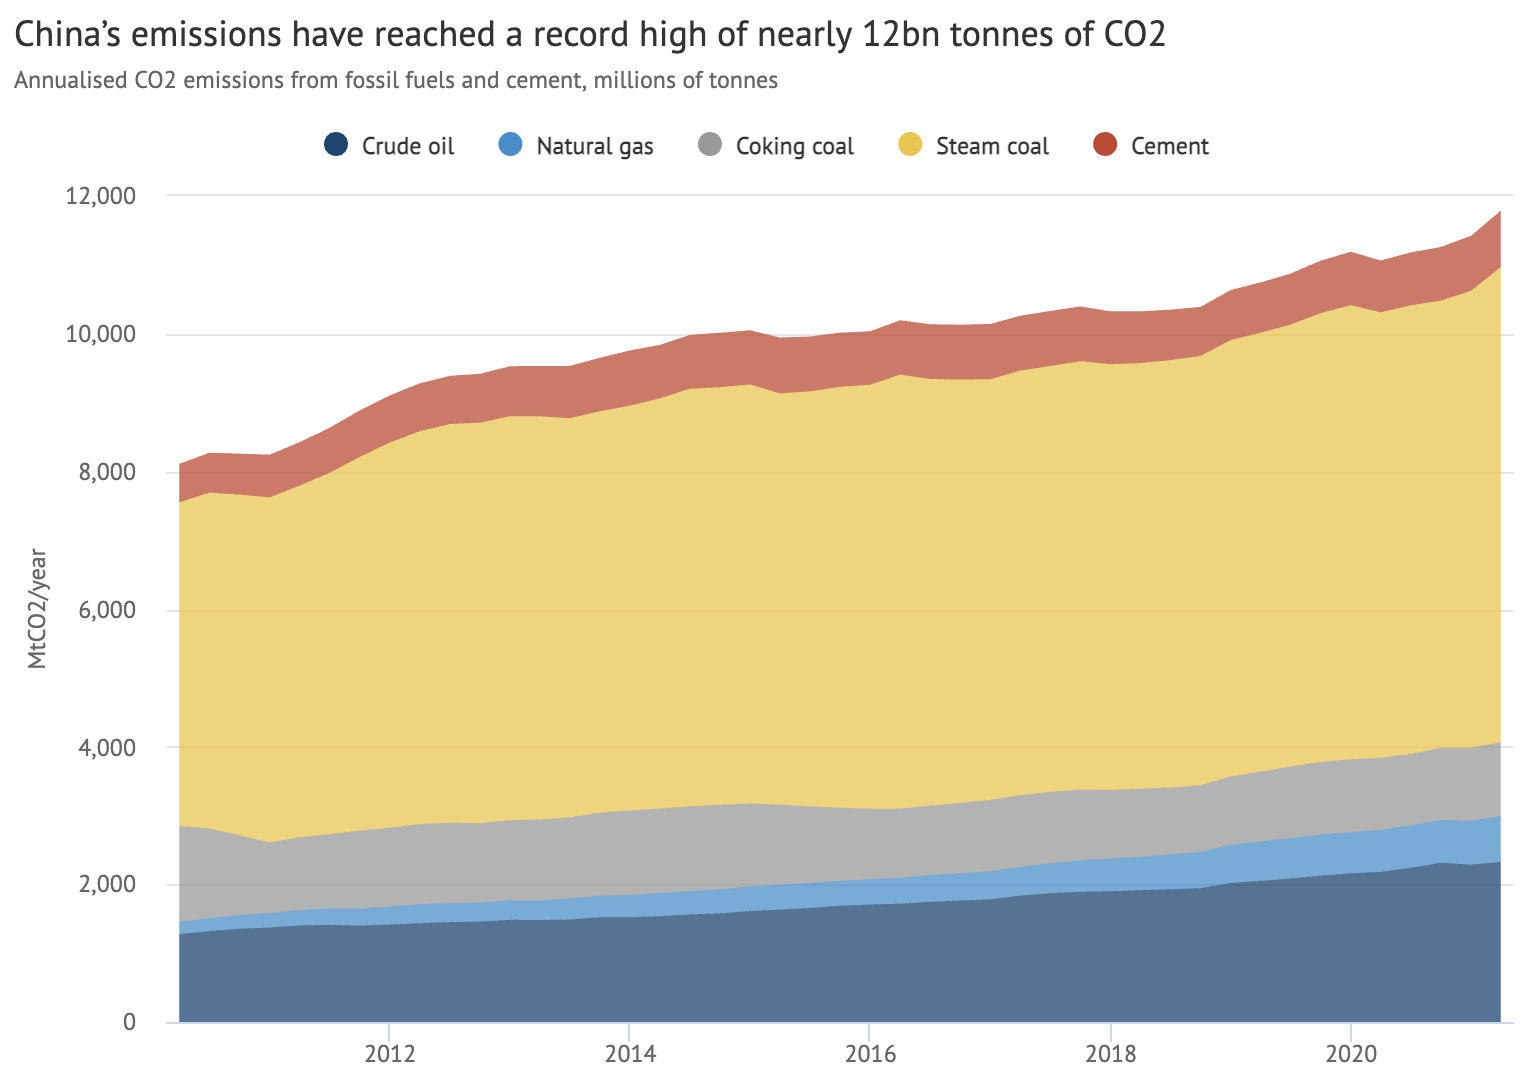
Annualised Chinese CO2 emissions from fossil fuels and cement, by source, since 2010, millions of tonnes per year. Emissions are estimated from National Bureau of Statistics data on production of different fuels and cement, China Customs data on imports and exports and WIND Information data on changes in inventories, applying IPCC default emissions factors and annual emissions factors per tonne of cement production until 2018. Monthly values are scaled to annual data on fuel consumption in annual Statistical Communiques and to National Energy Administration data on coal and fossil gas consumption in the first quarter of 2021. Chart by Carbon Brief using Highcharts.
Emissions in the year to March 2021 grew by nearly 7% year-on-year and by 10% relative to the year to March 2019 – respectively, the fastest rates since 2012 and 2013.
Charting the sources of emissions growth
The reasons for such rapid emissions growth in China relate to the way the country has come out of the coronavirus pandemic on a wave of stimulus spending.
As Covid-19 lockdowns skew the baseline for year-on-year comparisons, however, this section will be comparing 2021 data to the corresponding periods in 2019.
This follows the practice of most current official statistical reporting and analysis in China.
On this basis, around 70% of the increase in emissions in the first quarter of 2021 was due to increased use of coal, with growth in oil demand contributing 20% and fossil gas demand 10%.
Some 60% of the increase in coal use came from the power sector, with the metals industry (15%) and the building materials sector (10%, cement and glass) the next largest contributors.
These figures are based on data on apparent coal and gas demand, and oil production and imports from the National Energy Administration and WIND Information.
In the power sector, total electricity generation in January-April 2021 increased by 11%, wind by 34%, nuclear 19% and solar 18%, based on National Bureau of Statistics data.
However, the share of non-fossil sources fell because hydropower output declined 8%, due to variations in rainfall. As a result, thermal power generation, dominated by coal, expanded 12%.
The expansion of thermal power delivered 73% of the growth in generation overall, meaning clean energy would have needed to grow almost four times as fast to cover the increase in demand.
Power demand was driven by industry, where demand grew 18%, accounting for 80% of growth and increasing its share, as reported by China Electricity Council.
Power demand in services grew at the same rate as in industry, and cargo and real estate were among the fastest-growing sectors, gaining on the back of expansion in construction and industry.
Consumer-facing downstream industries are reportedly struggling amid weak demand and high commodity prices.
The main driver of steel and other industrial expansion is real-estate construction.
Official figures show the area of floor space under construction increased by 13% in the first four months of 2021, compared with 2019.
A proxy of construction activity, the production of elevators, escalators and lifts increased by 85%, based on data from the National Bureau of Statistics as reported by WIND Information.
Steel industry emissions targets
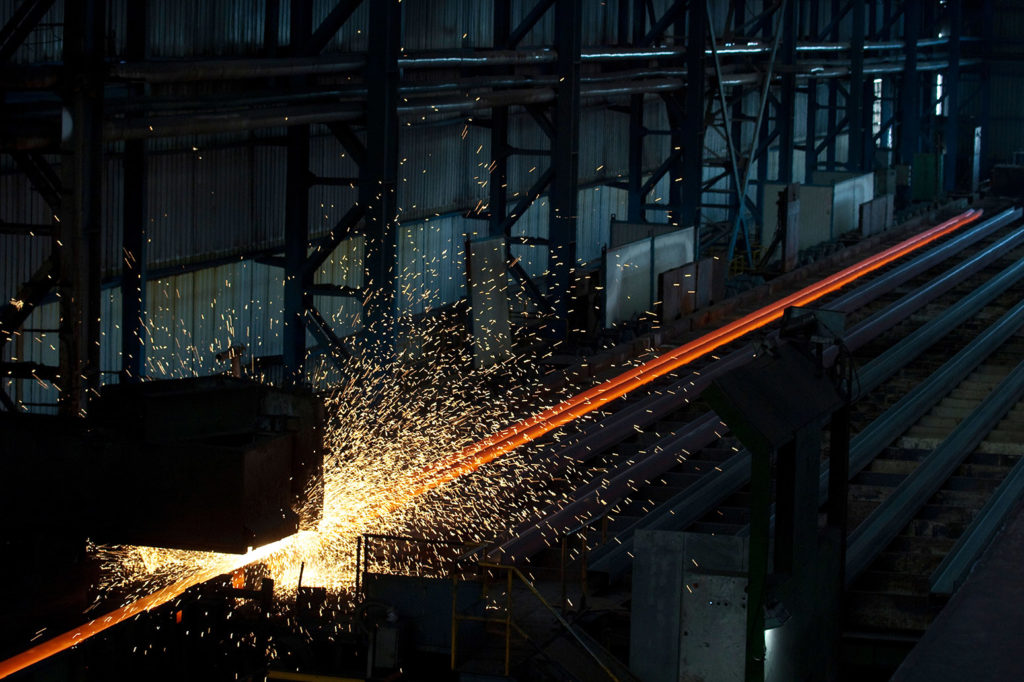
While emissions from China’s steel sector have been increasing rapidly in recent years, ambitious emissions reduction targets are being put in place for the industry.
These targets would involve the sector’s CO2 emissions peaking before 2025 and falling 30% from the peak by 2030.
The goals are the steel industry’s proposed response to the central government’s call for emissions from major energy-consuming industries to peak by 2025, achieve “steady” reductions by 2030 and “substantial” reductions by 2035.
The steel industry’s proposed targets have major significance for China’s emissions trajectory.
Based on coal and power consumption data cited above, the steel sector is responsible for more than 30% of total coal use in China and has been the main source of growth in demand.
The numbers cited in conjunction with the emissions target indicate that only direct emissions from iron and steel production are included, not electricity use for manufacturing of steel products or electric steelmaking from scrap. Yet, the target still has implications that also go beyond steel.
The plan to cut steel emissions is mainly predicated on a major increase in electric steelmaking from scrap metal, potentially reaching almost 40% of steel output by 2030.
This compares to the current share of electric steelmaking of just 10%.
If steel output volumes level off and the supply of scrap is fully used for steel production, this alone would be enough to deliver an almost 30% reduction in emissions from the sector – as 30% of primary steelmaking and direct emissions would be replaced with electric arc production.
The industry can play a role in stabilising or reducing steel demand, because higher quality steel reduces the amount needed in construction.
But the emissions reduction plan can only work if the current expansion of steel demand for construction slows down. This goes to the heart of China’s macroeconomic policy.
During the past five years, steel demand growth significantly exceeded government targets and forecasts: GDP growth was in line with targets, but was far more steel-intensive than expected.
Steel production in 2020 was 40% higher than projected in the previous five-year plan in 2016, for example. Steel production expanded by 31% over the period, while the GDP expanded 32%.
If the need for steel continues to grow as fast as China’s GDP, then total demand could rise more quickly than the level able to be supplied by increasing output from scrap. It would also be too large to be met by plans to pilot hydrogen and other non-coal-based steelmaking.
As a result, continued growth in steel demand at similar rates to GDP would lead to increases in coal-based steel supply and emissions, in spite of the sector’s proposed targets.
In 2007, major steel industry groups announced they were going to deliver a 100MtCO2 emission reduction through steel recycling and other measures. What actually happened is that steel output and CO2 emissions grew three-fold in the following decade, due to post-financial crisis stimulus.
The current steel industry emission reduction plan, therefore, rests on China realising its ambition for “high-quality” growth and economic transformation that is less reliant on construction, after the economic policy response to Covid-19 caused a setback to this effort.
One indicator that this could be possible comes from the steel sector proposals themselves.
Sign up to Carbon Brief's free "China Briefing" email newsletter. All you need to know about the latest developments relating to China and climate change. Sent to your inbox every Thursday.
The proposals highlight the fact that the total amount of steel embedded in China’s capital stock is close to the level where demand is saturated in most developed countries.
Meanwhile, however, the current increase in steel demand is already driving investment in new production capacity.
The largest increase in fixed asset investment in January-April took place in smelting and pressing of iron and steel metals, based on National Bureau of Statistics data accessed through WIND Information, increasing more than 60% from two years ago and even outpacing investment in medicine production.
Unless this investment is directed into electric steelmaking rather than more blast furnaces for coal-based steel, it could be difficult to meet the sector’s proposed emissions targets.
Five-year plan challenge
The acceleration in emissions growth poses a potential challenge for meeting China’s 2025 targets for energy intensity and non-fossil energy, set in the 14th five-year plan published in March.
The targets leave space for emissions to increase by around 5–10% from 2020 to 2025, depending on the GDP growth rate. Furthermore, the five-year period is seen as a crucial time window to pave the way for emissions to peak and start declining rapidly in the second half of the decade.
If CO2 kept going up at the current rate until the end of 2021 – an approximately 9% annual increase from 2019 – then there would be virtually no space for further emissions growth during 2022-2025, meaning emissions would have to stay flat or fall to meet the 2025 targets.
The International Energy Agency (IEA) projected a 6% increase from 2019 to 2021, which would also imply a slowdown to less than 1% per year emissions growth from 2022 onwards.
Achieving such a slowdown would require rebalancing the pattern of economic recovery.
The emissions-intensive recovery to date is due to an economic policy response and deeply embedded economic structures that benefit construction and industrial sectors in a downturn.
The pandemic response in the rest of the world has exacerbated the domestic situation by boosting Chinese industry through demand for exports.
Numerous Chinese analysts have noted the divergence between recent growth in real estate, major industries and exports on one hand and consumption on the other.
The government has created room for structural reforms by setting a GDP target for this year that is well below consensus forecasts and by not setting a target at all for the coming five years.
Furthermore, as noted in the analyst reports linked above, the retail and service sectors are starting to recover, reducing the need for construction spending to maintain GDP growth, while the credit-fuelled growth of the past year has led to renewed concerns about debt levels.
These factors could allow a clampdown on “low-quality growth”, directing investments and spending towards services and high-tech sectors, and lowering the energy intensity of growth.
If the government follows this approach, it should mean a tightening of construction and real estate spending that would bend China’s emissions trajectory downwards.
Data sources
Data for the analysis was compiled from the National Bureau of Statistics, National Energy Administration, China Electricity Council and China Customs official data releases, and from WIND Information, an industry data provider.
When data was available from multiple sources, different sources were cross-referenced and official sources used when possible, adjusting data from Wind Information to match.
CO2 emissions estimates are based on National Bureau of Statistics default calorific values of fuels and IPCC default emissions factors. Cement CO2 emissions factor is based on 2018 data.
For oil consumption, only data on oil products consumption was available so crude oil consumption is estimated from production and imports.
When official releases did not provide changes from 2019 to 2021, these are calculated from the linked release and previous iterations of the same regular release, although only the latest one is linked to.
-
Analysis: China’s carbon emissions grow at fastest rate for more than a decade