
Analysis: Fossil-fuel emissions in 2018 increasing at fastest rate for seven years
Zeke Hausfather
12.05.18Zeke Hausfather
05.12.2018 | 6:00pmHopes that global CO2 emissions might be nearing a peak have been dashed by preliminary data showing that output from fossil fuels and industry will grow by around 2.7% in 2018, the largest increase in seven years.
The new data, from researchers at the Global Carbon Project (GCP), is being published in Earth System Science Data Discussions and Environmental Research Letters to coincide with the UN’s COP24 climate summit in Poland. The rapid increase in 2018 CO2 output from fossil fuel use and industry follows a smaller 1.6% rise in 2017. Before that, three years of flat emissions output to 2016 had raised hopes that emissions had peaked.
This year, the largest increases have occurred in China, driven by government stimulus of the construction industry. US emissions have also increased markedly in 2018, after an unusually cold winter and hot summer helped to drive up energy demand.
Continued emissions growth in 2019 “appear[s] likely”, the researchers say, driven by rising oil and gas use and rapid economic growth. While some progress has been made, they add that the world has not yet reached the point where the energy system is being decarbonised fast enough to offset economic growth.
The increase in overall human-caused CO2 emissions may be smaller than the increase from fossil fuels and industry, the GCP says, up an estimated 0.7% in 2018. This is due to a reduction in land-use emissions offsetting some of the increase from fossil fuels.
Nevertheless, the 2018 increase in emissions puts the world even further away from meeting its climate change goals under the Paris Agreement.
Largest increase in seven years
The GCP is a group of international researchers who assess both sources and sinks of carbon. It has published an annual global carbon budget report since 2006.
Its newly released global carbon budget for 2018 provides estimates of CO2 from fossil fuel and industry in each country, as well as global emissions from changes in land use. It also estimates how CO2 has accumulated in the atmosphere and how much was absorbed by the land and oceans.
The figure below shows global CO2 emissions from fossil fuels, divided into emissions from China (red shading), India (yellow), the US (bright blue), EU (dark blue) and the remainder of the world (grey). Emissions are expected to rise to a new high of 37.15bn tonnes of CO2 (GtCO2) in 2018, with China and the US as the two largest emitters.
Annual CO2 emissions from fossil fuels and industry by major country and rest of world from 1959-2018, in billions of tonnes of CO2 per year (GtCO2). Note that 2018 numbers are preliminary estimates. Data from the Global Carbon Project; chart by Carbon Brief using Highcharts.After a rapid increase in global emissions of around 3% per year between 2000 and 2013, emissions only grew by 0.4% per year between 2013 and 2016. This was reversed over the last two years, with emissions growing by 1.6% in 2017 and expected to grow in 2018 by 2.7% (with an uncertainty range of between 1.8% and 3.7%).
Increases in 2018 driven largely by China
Much of the slowdown in the growth of global emissions from fossil fuels between 2014 and 2016 had been driven by a combination of reductions in the US and China, as well as relatively little growth in emissions in other countries.
However, in 2017 Chinese emissions grew, while declines in the US slowed. In 2018 China is expected to show substantial increases in emissions, with increases also expected in the US.
India’s emissions increased a bit more quickly in 2018 than over the past few years, while the EU’s emissions have remained relatively flat since 2014 and did not noticeably change in 2017 or 2018. The growth in emissions from the rest of the world has remained at around 0.25GtCO2 per year for the past three years.
The total emissions for each year between 2015 and 2018, and the countries that were responsible for the change in emissions, are shown in the figure below. Annual emissions for 2015, 2016, 2017 and estimates for 2018 are shown by the black bars. The coloured bars show the change in emissions between each set of years, broken down by country. Negative values show reductions in emissions, while positive values reflect emission increases.
Annual global CO2 emissions from fossil fuels (black bars) and drivers of changes between years by country (coloured bars). Negative values indicate reductions in emissions. Note that the y-axis does not start at zero. Data from the Global Carbon Project; chart by Carbon Brief using Highcharts.As 2018 is not yet over – and somewhat limited data is available – these projections are still subject to large uncertainties. The GCP will publish more complete 2018 numbers in early 2019 when all the data is available. However, it is clear that the rise in emissions from fossil fuels in 2018 will be the largest in quite some time.
China
China alone was responsible for just under half the global increase in CO2 emissions in 2018. Chinese emissions are projected to grow by 4.7% in 2018, with a wide uncertainty range from 2% to 7.4%.
Prof Corinne Le Quéré, director of the Tyndall Centre at the University of East Anglia and one of the lead scientists at the Global Carbon Project, tells Carbon Brief (video above) that the rise in Chinese emissions in 2018 was primarily driven by “government stimulus in the construction industry”, a sector which “emits lots of CO2”.
Le Quéré suggests that some of this projected increase is “probably temporary”, but also cautions that it is difficult to say what will happen to Chinese emissions in 2019. Early indications suggest the government is planning another multi-trillion stimulus next year.
US
The GCP projects that US CO2 emissions are likely to increase in 2018 by around 2.5% – with an uncertainty ranging from 0.5% to 4.5%. This represents a reversal after three years of consecutive emission declines.
Le Quéré points out that a large portion of the increase in US emissions was “associated with a cold winter followed by a hot summer, both of which use a lot of energy”. Power sector emissions continued to decline, with US coal consumption expected to reach a new low in 2018. However, these are somewhat offset by increases in industrial and transportation emissions driven by a growing economy.
Despite record sales of electric vehicle in the US – the total number just hit the 1m mark – there are nearly 12m more cars with internal combustion engines in the country than there were in 2008.
The GCP forecasts that US emissions will probably begin to decline again in 2019, as cheap gas, wind and solar continue to displace coal and temporary weather effects end.
European Union
EU emissions are expected to decrease by 0.7% in 2018 – with a range of -2.6% to 1.3%. While power sector emissions have continued to decrease, overall emission declines are more modest because increased use of petrol for transportation is offsetting decreased use of coal and gas for electricity generation.
After this modest decline in 2018, EU emissions would have returned to much the same level as in 2014. There have been no significant changes in EU CO2 output since then.
India and the rest of the world
India and other developing countries saw emission increases in 2018, due to economic growth that is “not yet decoupled” from greenhouse gas emissions, the GCP says.
India’s emissions are expected to increase by 6.3% in 2018 – with a range of 4.3% to 8.3% – and the rest of the world’s emissions are expected to increase by 1.8% – with a range of 0.5% to 3.0%.
Decarbonising, but too slowly
The increase in CO2 emissions from fossil fuels in 2018 leaves the world far from the trajectory needed to meet global climate goals. Yet the GCP report does contain a few proverbial silver linings. It points out that 19 countries representing 20% of the global total have significantly reduced CO2 emissions over the last decade.
As Le Quéré tells Carbon Brief, “we are in a very different situation than we were in just five years ago”. This is due to very large declines in coal use in the US and Europe and the rapid rise of cheap renewable energy.
Even China, which led the world in CO2 emissions increases in 2018, has much slower growth of coal use than a decade ago. There are some suggestions that global coal use may have peaked, though it is too soon to know for sure.
On the other hand, global oil and gas use is growing unabated. In particular, the world has been slow in addressing emissions from the transportation sector, as electric and other alternative-fuel vehicles have been slow in taking off. Le Quéré suggests that focusing on transport, buildings and industry will be critical for ensuring future emissions reductions.
Ultimately, while progress is being made on decarbonisation, it is happening at a slower rate than the global economy is growing, particularly in developing countries. As the GCP argues:
“Insufficient emission reductions in developed countries and a need for increased energy use in developing countries where per capita emissions remain far below those of wealthier nations will continue to put upward pressure on CO2 emissions. Peak emissions will occur only when total fossil CO2 emissions finally start to decline despite growth in global energy consumption, with fossil energy production replaced by rapidly growing low- or no-carbon technologies.”
The global carbon budget
Every year the GCP provides an estimate of the global carbon budget. It estimates both the release and uptake of carbon including emissions from fossil fuels and industry, emissions from land-use changes, carbon taken up by the oceans and land, and changes in atmospheric concentrations of CO2. This differs from the commonly used term “carbon budget”, referring to how much emissions are left to meet a climate target, such as avoiding 1.5 or 2C of warming.
The most recent budget, including estimated values for 2018, is shown in the figure below. Values above zero represent sources of CO2 – from fossil fuels and land use – while values below zero represent “carbon sinks” that remove CO2 from the atmosphere. CO2 emissions either accumulate in the atmosphere, or are absorbed by the oceans or land vegetation.
Annual global carbon budget of sources and sinks from 1959-2018. Note that the budget does not fully balance every year due to remaining uncertainties, particularly in sinks. 2018 numbers are preliminary estimates. Data from the Global Carbon Project; chart by Carbon Brief using Highcharts.Land-use changes, such as deforestation and fires, comprised 10.6% of total CO2 emissions in 2018, down a bit from 12.6% in 2017. The remaining 89% of emissions came from fossil fuels and industry. Total CO2 emissions increased by about 0.7% between 2017 and 2018, driven by higher fossil-fuel emissions but lower land-use emissions.
According to the GCP estimates, about 43% of CO2 emitted in 2018 accumulated in the atmosphere. The remainder was taken up by carbon sinks – 35% by the land and 23% by the ocean. Land uptake was unusually high in 2018 and one of the highest levels in the past few decades, though the cause of this is currently unclear, the authors tell Carbon Brief.
Atmospheric CO2 concentration are projected to increase by 2.2 parts per million (ppm), reaching 407ppm in 2018. This increase is close to the average increase over the past decade, despite record-high emissions. This is because the return to El Niño neutral conditions and an unusally large land sink.
Updating sources and sinks
The GCP’s new global carbon budget also includes updated estimates of sources and sinks based on changes in inventories and new research published since the last budget came out. The figure below, taken from the paper presenting the latest budget, shows the values used for every year from 2006 through to present.
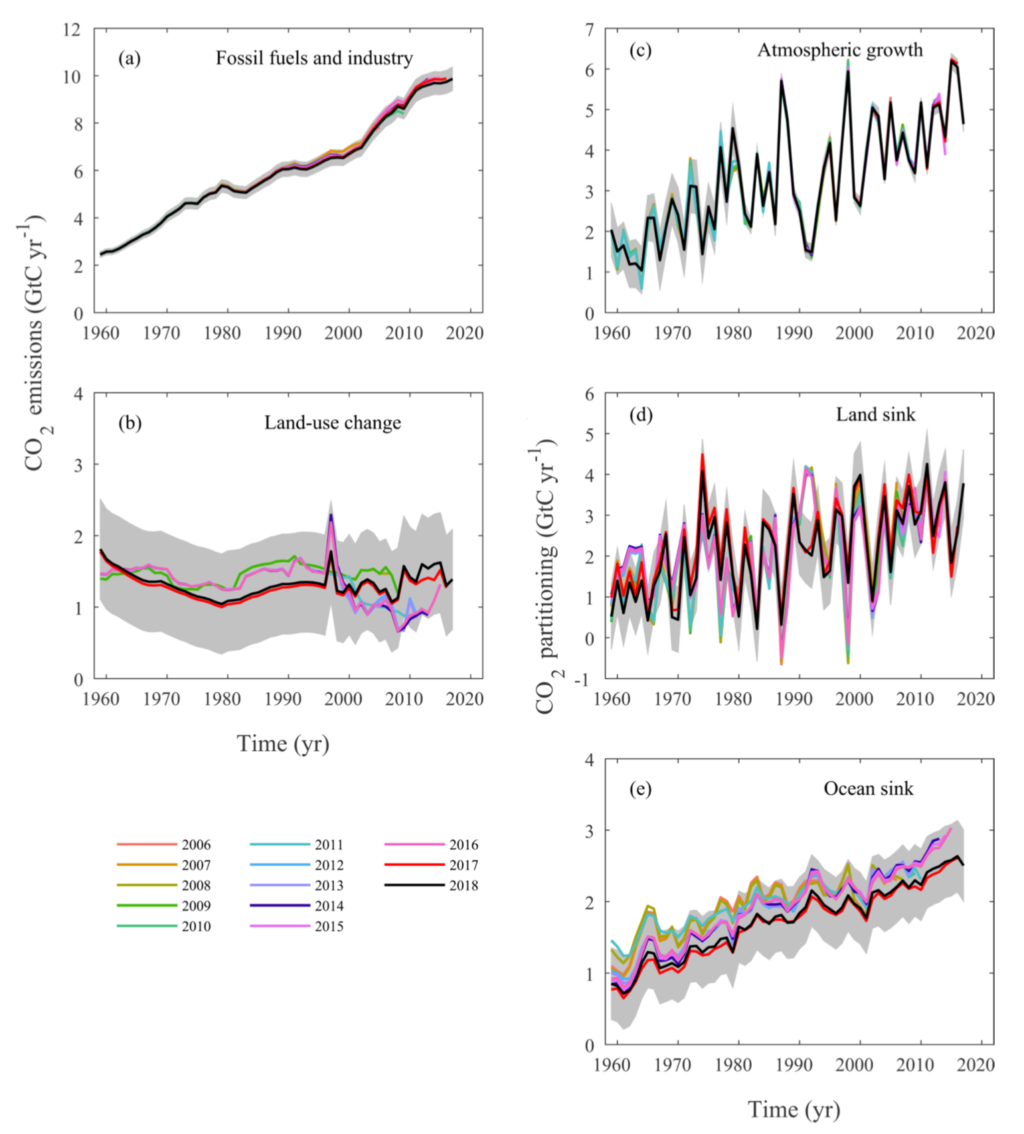
Global Carbon Project source and sink estimates in billions of tonnes of carbon (GtC) – note, not CO2 – for every Global Carbon Budget published between 2006 and 2018. Figure B4 from Le Quéré et al (2018).
Estimates of global fossil fuel and industry emissions were revised downwards by around 1.5% in recent years in the 2018 report compared to 2017, with larger declines of around 4% in Chinese emissions. This is due to a revision in the emission factors use for cement production and is particularly pronounced in China as they produce around 60% of the world’s cement.
Implications for meeting Paris Agreement targets
As previously discussed by Carbon Brief, there is a growing gap between emission reduction commitments made by countries to-date and what would be required to meet the Paris Agreement targets of limiting warming to 1.5C, or well below 2C above pre-industrial levels. Every year that emissions continue to increase makes this gap larger.
The figure below shows historical fossil fuel CO2 emissions in black, with 2018 emissions as a red dot. The various coloured lines show the well-below 2C scenarios (blue) and 1.5C scenarios (purple) produced by integrated assessment models in shared socioeconomic pathway number one. The thicker blue and purple lines represent the chosen “reference scenario” for each mitigation target.
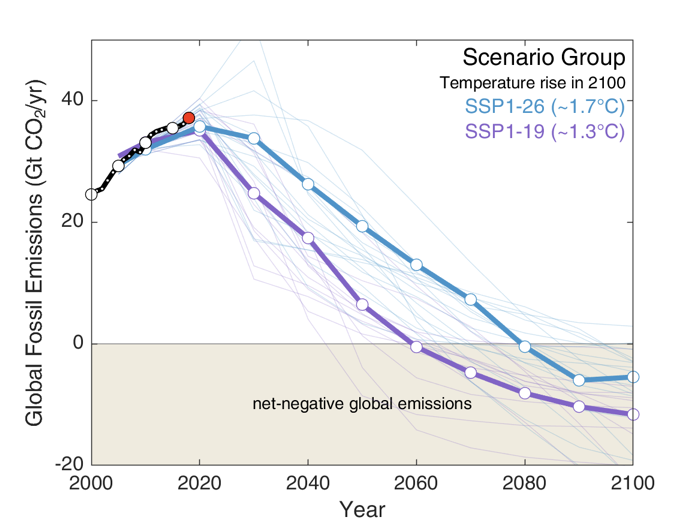
Historical fossil-fuel emissions (black), 2018 emissions (red), well-below 2C scenarios (RCP2.6 – blue) and below 1.5C scenarios (RCP1.9 – purple). Mitigation scenarios from integrated assessment models using shared socioeconomic pathway number one. Bold lines indicate the subset of scenarios chosen as a focus for running CMIP6 climate model simulations. Source: Figure 2 in the Jackson et al 2018
The increase in emissions in 2018 makes it more challenging for the world to meet its Paris Agreement goals. If emissions continue to increase over the next few years, the more ambitious mitigation targets – such as limiting warming to below 1.5C – may quickly move out of reach, at least in the absence of removal of CO2 from the atmosphere from planetary-scale deployments of as-yet-unproven negative emission technologies late in the century.
As Dr Glen Peters, a senior researcher Center for International Climate and Environmental Research (CICERO) in Oslo, says in a statement:
“The rise in emissions in 2017 could be seen as a one-off, but the growth rate in 2018 is even higher, and it is becoming crystal clear the world is so far failing in its duty to steer onto a course consistent with the goals set out in the Paris Agreement in 2015.”
Le Quéré et al. (2018) Global Carbon Budget 2018. Earth System Science Data Discussions. https://doi.org/10.5194/essd-10-1-2018
Jackson et al. (2018) Global Energy Growth Is Outpacing Decarbonization, Environmental Research Letters. https://doi.org/10.1088/1748-9326/af303
Figueres et al. (2018) Emissions are still rising: ramp up the cuts. Nature. https://www.nature.com/articles/d41586-018-07585-6
-
Analysis: Fossil-fuel emissions in 2018 increasing at fastest rate for seven years
-
CO2 emissions from fossil fuels accelerated in 2018 with a 3% rise