Analysis: How delegations at COP climate summits have changed over time
Robert McSweeney
10.27.21Robert McSweeney
27.10.2021 | 8:00amThe “Conference of the Parties” (COP) international summit is the biggest climate diplomacy event of the year.
Since the first COP was held in Berlin in 1995, the UN Framework Convention on Climate Change (UNFCCC) has gathered the international community together (almost) every year to assess and advance progress on tackling global warming.
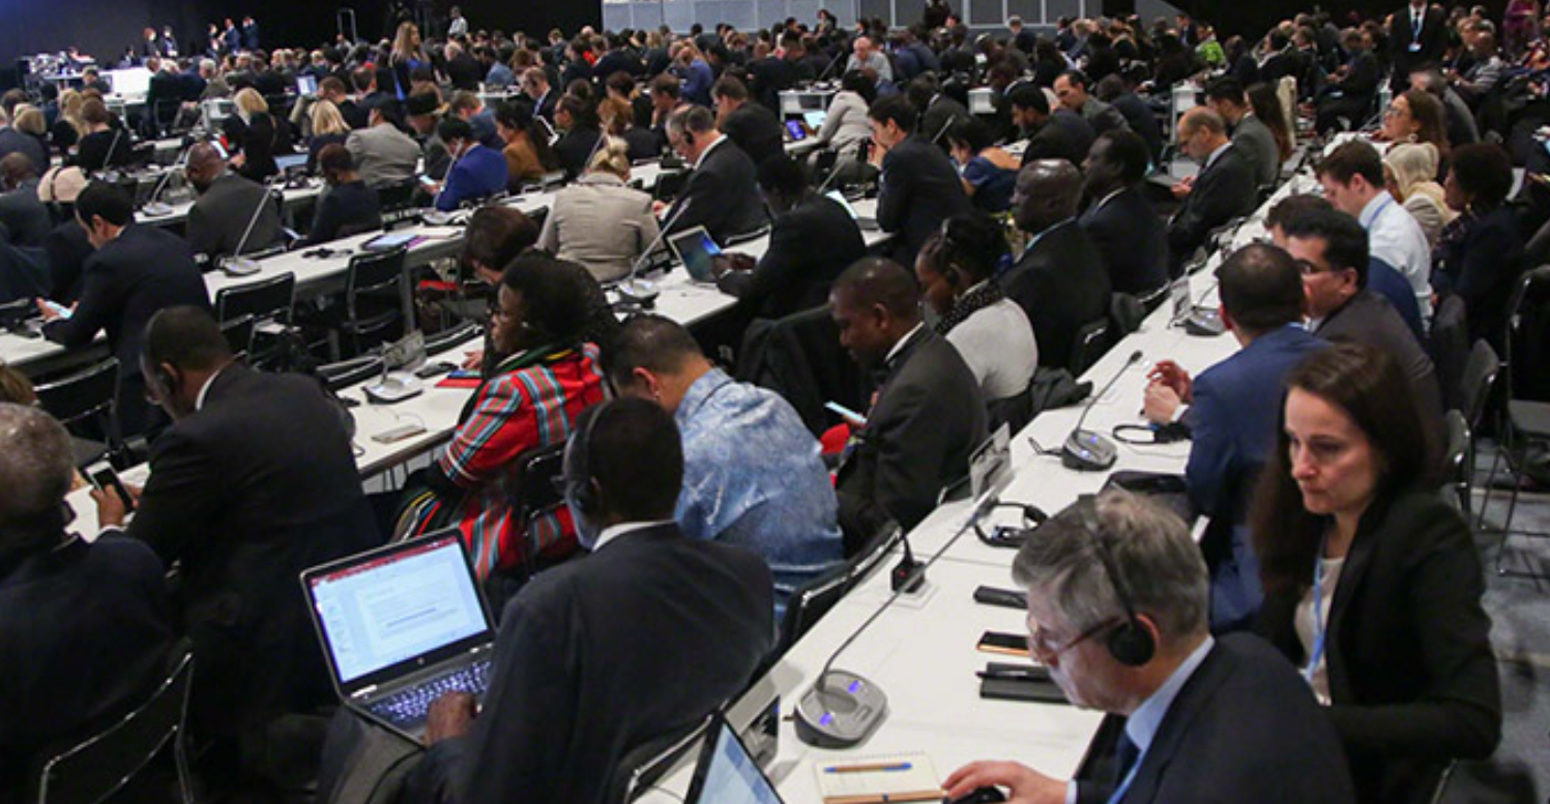
Each country brings its own delegation of politicians, negotiators and experts to discuss and agree – or not – a way forward with other countries. The two-week talks are also attended by thousands of observers and members of the press.
As action on climate change has gained international attention, these COPs have grown in prominence. But how have the number of participants and the makeup of delegations changed over the past 25 years?
For the first time, Carbon Brief reveals the biggest delegations, the best-attended COPs and how the gender balance of delegations has shifted over time.
The analysis reveals, for example, that Brazil tends to bring the largest delegation, Morocco once brought a named delegation of almost 1,600 people, and Libya’s delegation is, on average, 99% male.
Rising participation
For each COP, the UNFCCC typically publishes a provisional list of participants during the summit and a final list once it has concluded (occasionally followed by corrections). The figures analysed in this article all refer to the final, corrected lists.
The chart below shows the overall totals for the three categories of meeting participants: representatives of parties to the Convention and observer states; representatives of observer organisations; and members of the press.
Parties are nation states – plus the European Union – that have ratified the Convention and play a full part in negotiations. Observer states have not completed ratification.
Observer organisations are further divided into the UN System and its specialised agencies, intergovernmental organisations (IGOs), and non-governmental organisations (NGOs). They have access (pdf) to plenary sessions and some of the deliberations around the draft text, but not the smaller “informal informal” discussions.
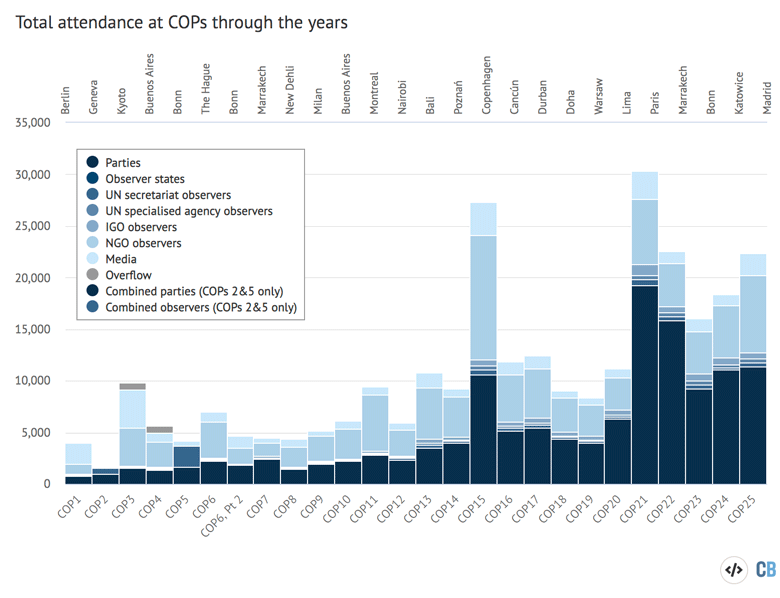
The chart highlights that the number of participants has generally increased over the 26 COPs to date. The average total attendance across the first 10 COPs (including both meetings of the two-part COP6) is around 5,000. In contrast, the average across the last five COPs is almost 22,000 participants.
Peaks in COP attendance can be seen for COP21 (30,372) in Paris and COP15 in Copenhagen (27,301). The build up to both of these summits came with expectations of formally agreeing a replacement for the Kyoto Protocol. While COP15 fell short with the “weak” Copenhagen Accord, COP21 saw the successful acceptance of the Paris Agreement – the final details for which will continue to be negotiated at COP26 next week.
A report (pdf) published earlier this year by the European Capacity Building Initiative (ECBI) identified a pattern of participant numbers essentially doubling after the COPs where new treaties were expected – Kyoto (1997), Copenhagen (2009) and Paris (2015). It also notes that “after Copenhagen, the UNFCCC secretariat began capping participant numbers of NGOs and media”.
The ECBI also found that participant numbers have increased in tandem with the workload of negotiators:
“It turns out that the total number of agenda items addressed in the different bodies during a COP or mid-year SB [Subsidiary Bodies] session is indeed significantly correlated with the number of party participants attending these sessions.”
The mix of party and observer states has also gradually shifted throughout the history of the COP as more and more states ratified the Convention. The first COP had 117 party states and 53 observers. By COP3, the number of party states jumped up to 155 and since COP11 there have never been fewer than 180 parties present.
For the vast majority of COPs, there has been only a handful of observer states – and never more than three since COP14. “Holy See” – the city-state of the Vatican – has been ever-present as an observer throughout the COPs. While others – such as the State of Palestine, Iraq, Turkey, Somalia and South Sudan – have all featured at times.
(At the Paris COP in 2015, one of the Vatican’s diplomats said the Holy See was considering ratifying the UNFCCC in order to sign the – then still under negotiation – Paris Agreement. Until that happens, Holy See will continue to hold observer status. It is also a permanent observer to the UN, more generally, where it can participate in discussions, but not vote.)
The number of participants from the media has fluctuated throughout the history of the COPs. COP1 and COP3 had 2,044 and 3,712 representatives, respectively. (The UNFCCC has not reported media numbers for COP2). For the following 10 COPs, the number of media representatives generally clocked in at between 500 and 1,000. And the last five COPs have seen a step up in media numbers, averaging 1,700. As with party delegates, there are noticeable peaks in media participants at COP15 (3,221) and COP21 (2,798).
Named participants
In addition to the overall participant totals, the UNFCCC also provides a partial breakdown of each party and observer delegation by name.
These named lists do not include all participants. There are also party “overflow” delegates, which can number several thousand at an individual COP. The ECBI (pdf) explains:
“These badges were first introduced at COP3 and allow parties to nominate individuals without their name appearing on the official list of participants.”
The chart below shows how the total number of named party delegates has changed throughout the history of the COP. This has increased from around 1,000 at COP1 and COP2 up to an average of more than 8,000 over the past five COPs. Again, peaks can be seen at COP15 and COP21.
The totals are presented for male (orange) and female (purple) delegates. The lines on the chart show what percentage of the average delegation is male (orange) and female (purple) – highlighting how the gender balance across the delegations has changed with time. (See the section below for more details.)
(It should be noted that the gender balances presented here are based on the titles designated by UNFCCC – such as M, Mr and Sr for male participants and Ms, Mme and Sra for female – and not by Carbon Brief. On the few occasions that the UNFCCC did not include a title, Carbon Brief found the usual gender of a participant’s first name as determined by the genderize.io app. Carbon Brief recognises that gender is not best categorised using a binary “male” or “female” label and appreciates that the methods used to determine participant gender could result in inaccuracies.)
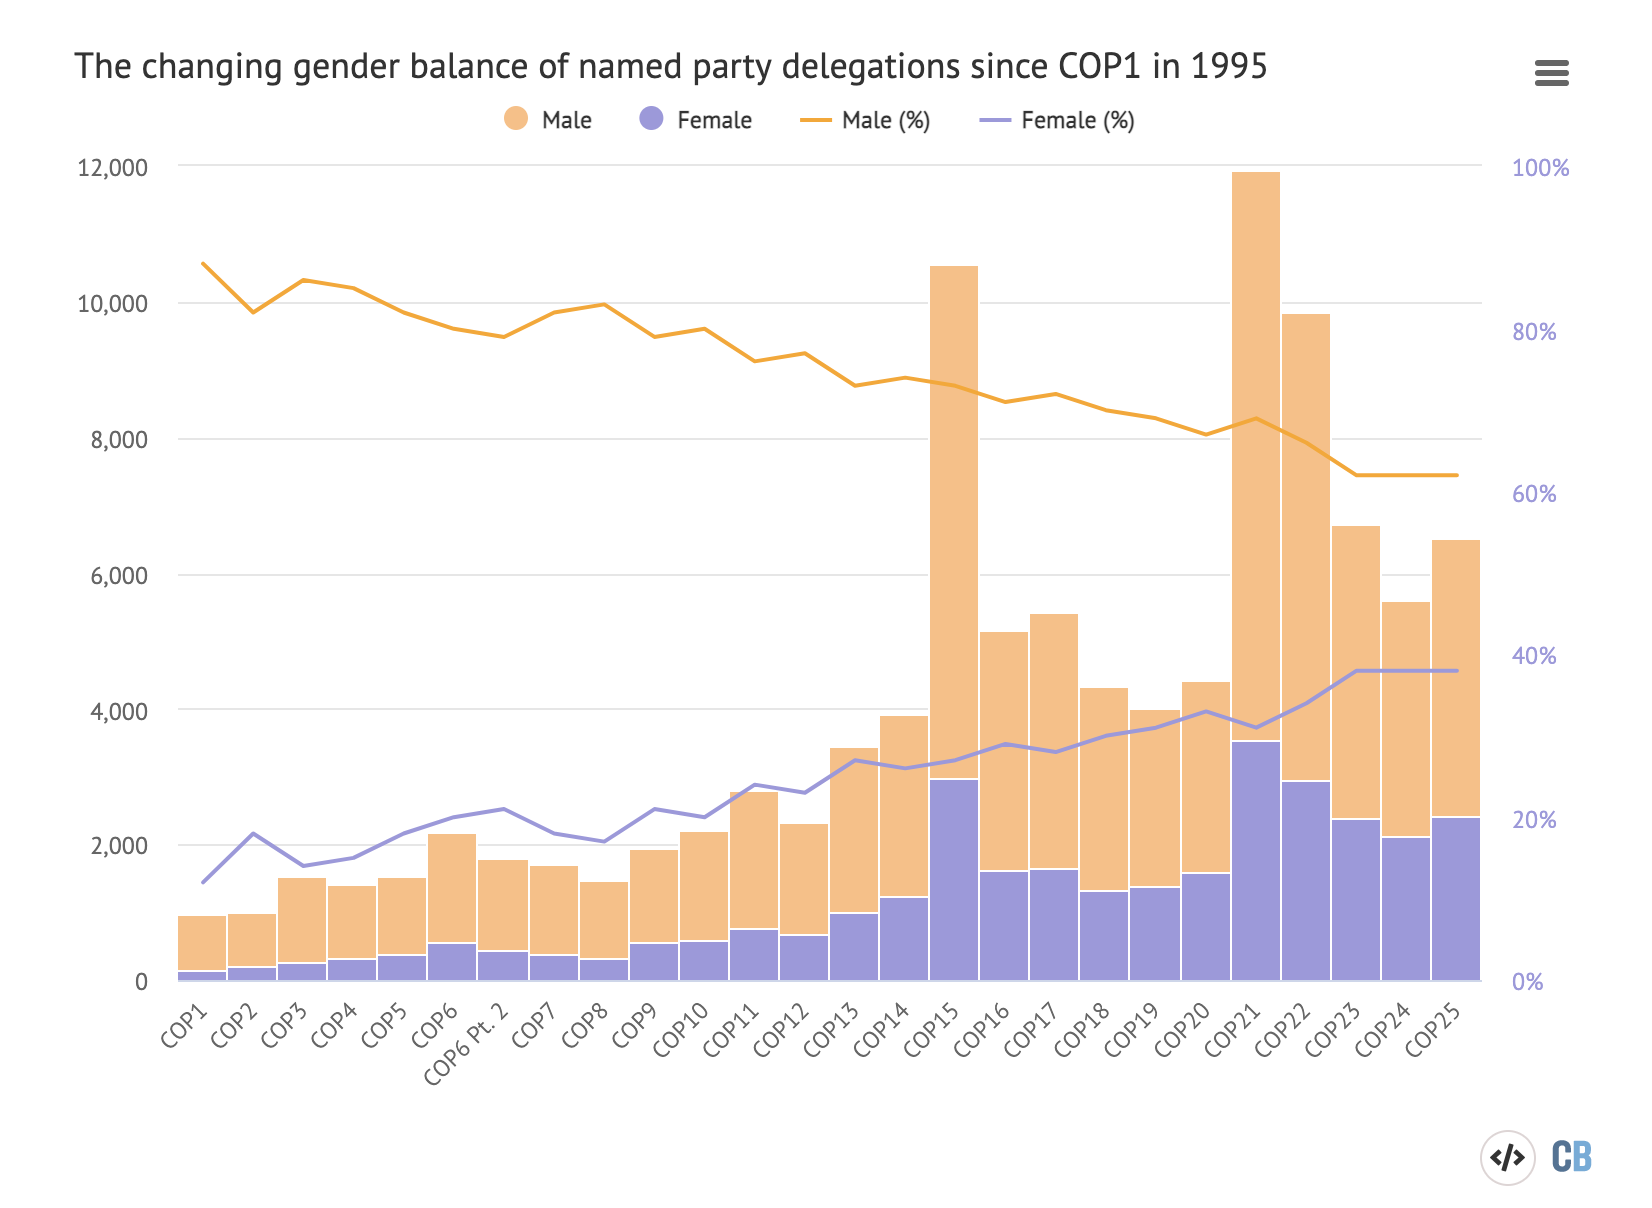
The average size of a named delegation has increased from an average of eight people at the first five COPs to around 40 at the most recent five.
Of course, delegations can be much larger. Unsurprisingly, the biggest are frequently from the host country – examples include Japan at COP3 in Kyoto (165 people), Canada at COP11 in Montreal (326) and Peru at COP20 in Lima (269). Perhaps the most extreme case is the Morocco delegation of 1,591 at COP22 in Marrakech.
Such a huge delegation means that, when looking at the number of named participants across all COPs, Morocco has the second largest average delegation (110 participants). Brazil comes in first (141), with France (107), Canada (99) and Japan (94) rounding off the top five.
Brazil also has also brought the largest named delegation the most times across the COPs (seven times), followed by Japan (three) and Germany, the US, Morocco and Poland (two).
(It is worth noting that some countries allocate a portion of their party badges – known as “pink” badges at COPs – to NGOs, which can artificially inflate the size of their official delegation.)
Gender imbalance
The average gender balance across all the named delegations has gradually become less unequal over time. At COP1, delegations were, on average, 88% male and 12% female. This imbalance has declined somewhat, with each of the last three COPs seeing an average balance of 62% male to 38% female.
Across all COPs, the average balance of named delegations is 75% male to 25% female, equivalent to three men for every woman.
The most male-dominated delegations include Libya (99%-1%, on average), Mauritius (98%-2%) and Eritrea (98%-2%).
Eight parties have an average named delegation that is more female led. This includes two island states – the Cook Islands (38-62%), St Kitts and Nevis (39%-61%) – several European nations – Bulgaria (41%-59%), Latvia (46%-54%), Finland (49%-51%) and Albania (49%-51%) – and two Central Asian countries – Kyrgyzstan (46%-54%) and Uzbekistan (47%-53%). With the exception of Finland – which has an average named delegation of 41 – these parties all have an average delegation size in the single figures.
Of the G7 nations, the UK has the most balanced average delegation (59%-41%), followed by Canada (61%-39%) and the US (63%-37%). Japan’s average delegation is the most unequal by some distance (83%-17%).
The table below shows the average named delegation size and gender balance for each party. The table is sorted by delegation size by default, but users can click on the different column headers to change this. The search function can be used to find specific parties.
Interactive table of average named party delegation size and gender balance (averaged across all COPs). Bars show numbers of male (orange) and female (purple) participants in average delegation. Table is sorted by delegation size by default, but users can click on the column headers to change this. Table by Tom Prater for Carbon Brief.Methodological note
It should be noted that some countries have changed since the COP summits began in 1995. Some have changed their names – such as Swaziland becoming Eswatini and the Czech Republic becoming Czechia – while others have changed more fundamentally, such as the breakup of Yugoslavia.
For the purposes of this analysis, the most recent name is used for each country. Where a country has changed its formation, all versions are included. For example, “Serbia and Montenegro” was a party state from COP9 to COP11, but since COP12, “Serbia” and “Montenegro” have been represented as individual states.
Additional research by Sylvia Hayes.