Analysis: How Trump’s rollback of vehicle fuel standards would increase US emissions
The Trump administration’s plans to rollback vehicle fuel-economy standards could increase emissions from the light vehicles sector by 13%, a Carbon Brief analysis shows.
The increase could reach 85m tonnes of CO2 (MtCO2) in 2035, compared to a scenario where rising Obama-era standards remain in force.
The Trump administration plans are due to be finalised this summer and would freeze fuel standards at 2020 levels.
This move is sure to be challenged in court action led by the state of California, which has historically had the power to set its own vehicle standards and has a large number of other states following its lead. It is currently unclear if California could maintain its ability to independently regulate CO2 emissions from vehicles in the face of federal opposition.
If the standards are successfully rolled back, however, the impact could be sizeable, Carbon Brief analysis shows. The 85MtCO2 increase in annual CO2 emissions by 2035 would be equivalent to the current yearly emissions of Bangladesh.
Looming legal battle
When the Clean Air Act was passed into law in the US in 1970, California already had more stringent clean air regulations than the newly enacted national standard, the result of years of battling smog in the Los Angeles region.
To prevent the new federal rules from overriding California’s existing regulations, the state was given the authority to issue its own air pollution rules as long as they exceed federal standards. Other states can also choose to adopt California’s stricter rules – and 12 other states along with the District of Columbia currently do this.
The Trump administration is currently seeking to rollback the Obama vehicle fuel standards, freezing the minimum miles-per-gallon standard for newly sold light cars at 2020 levels of 37 miles per gallon for cars, down from a target of 54.5 miles per gallon by 2025. (Light trucks and sports utility vehicles – SUVs – have somewhat lower fuel-economy targets that would also be frozen). California has opposed this change, committing to maintain high fuel-economy standards as a way of reducing CO2 pollution.
This has set up a major legal showdown between the Trump administration and California, with the federal government threatening to deny California’s authority to set its own standards, a move that would inevitably end up in the courts. If California prevails, it would create a situation where the vehicle market was bifurcated, with about half the US population living in states with very different vehicle standards than the other half. Canada also recently agreed to follow California’s lead.
Vehicle manufacturers, some of whom initially pressed to relax fuel-economy standards, have recently urged the Trump administration to negotiate with California, arguing that a split market would be a “nightmare scenario”.
At the same time, a number of political activists who reject climate science have been lobbying the administration to move forward with the fuel standards rollback – even in the face of industry opposition. The administration appears to be moving forward with the plan, with the US Environmental Protection Agency (EPA) expected to finalise a plan to freeze fuel-economy standards over the summer.
Major climate impacts
If the Trump administration succeeds in its freeze, it would have substantial impact on CO2 emissions. Transportation recently surpassed electricity generation as the single largest source of US emissions, responsible for around 36% of total CO2 emissions in 2018. Fuel economy is one of the major mechanisms the government has to reduce emissions in the sector.
Carbon Brief has analysed what would happen to US emissions if the administration succeeds in freezing fuel-economy standards and preventing California from maintaining its own set of more stringent rules.
The figure below, adapted from an analysis by the Rhodium Group, shows the expected effects of both the Obama fuel-economy standards (in blue) and the proposed Trump administration freeze (in red) on new vehicles.
Estimated new vehicle fuel standards under the current Obama standards (blue) and proposed Trump administration freeze (red) under the EIA 2018 Annual Energy Outlook reference oil price scenario. Values are shown for the average of all light vehicles, which includes cars, SUVs, and light trucks. Adapted from Figure 1 of the Rhodium Group analysis; chart by Carbon Brief using Highcharts.The analysis in the chart accounts for market forces and technological innovation, so there is still some improvement even in the absence of federal regulations, though a sizable gap remains between the Obama standards and proposed Trump administration freeze. Miles per gallon is assumed to remain nearly flat after 2025 in the absence of any new fuel-economy standards, as oil prices remain near current levels.
The scenario shown here is for a “reference” oil-price scenario from the US Energy Information Agency (EIA) 2018 Annual Energy Outlook, where oil prices stay close to current levels. Rhodium also provides a detailed look at what might happen under much cheaper or more expensive oil prices.
In this analysis, under the Obama standards the average fuel economy for new light vehicles would reach 45 miles per gallon (mpg) by 2025, flattening after that in the absence of new policies. Under the proposed freeze, new vehicle fuel standards would only reach 38mpg by 2025.
New vehicle sales are only part of the story, however, as they only make up a small portion of all vehicles on the road at any given time. About half the cars currently on the road in the US are more than 10 years old and around 6% are more than 20 years old. To calculate the impact of the proposed fuel-economy freeze across the US vehicle fleet, Carbon Brief uses vehicle fleet age data from the EIA, estimating what share of light vehicles on the road come from different model years (see methodology at the end for details).
The figure below shows the resulting average fuel standards across all light vehicles on the road for each year. The effects of the fuel-economy freeze are smaller here, particularly early on, as it takes time for vehicles meeting the new standards to replace older, less efficient models.
Estimated average light vehicle fuel standards under the current Obama standards (blue) and proposed Trump administration freeze (red). Based on new vehicle fuel standard estimates in the prior figure, and a vehicle age distribution from the EIA. Chart by Carbon Brief using Highcharts.Across all light vehicles, the Obama rules would have seen fuel standards increase from around 29mpg today to 34mpg by 2025 and 42mpg by 2035. Under the proposed freeze, fuel standards would increase to just 33mpg by 2025 and 37mpg by 2035. These differences are notably smaller than for new vehicles, reflecting the challenge that older models pose for rapidly decarbonising the transportation sector.
To estimate the impact a fuel-economy freeze would have on CO2 emissions, Carbon Brief then assumes that the average miles travelled per person in the US remains constant over the next 15 years, with overall vehicle miles increasing modestly due to population growth.
The figure below shows the resulting annual CO2 emissions from light vehicles under the Obama standards (blue) and Trump freeze (red) in the top panel, along with the difference between the two in the bottom panel.
Estimated light vehicle CO2 emissions under current Obama standards (blue) and proposed Trump administration freeze (red), along with the difference between the two, in millions of tonnes of CO2 (MtCO2). Based on the data in the prior two figures, and an EPA estimate of CO2 emissions per gallon of fuel. Chart by Carbon Brief using Highcharts.A Trump administration freeze of fuel-economy standards would increase US emissions by around 85m tonnes of CO2 (MtCO2) per year by 2035. This would represent a 13% increase in light vehicle emissions compared to a world where the Obama standards remained in place.
Put another way, this represents an increase in overall transportation emissions of around 5% and overall economy-wide CO2 emissions of 1.7%.
It would also likely impact emissions and vehicle fuel standards beyond the 2035 time horizon modelled here, though that would depend in part on the policies of future administrations
If California succeeds in keeping its own standards, the picture would change considerably. It might not make sense for vehicle manufacturers to maintain two separate sets of vehicles for different markets in the US, so the more strict California standard might end up becoming the de facto national standard – even if the administration freezes fuel-economy rules at the federal level. However, what exactly would happen remains unclear and would be difficult to effectively model.
Vehicle fuel-economy standards are one of the major levers that the federal government has to regulate CO2 emissions. If the Trump administration succeeds in freezing the standards and denying California’s waiver, it would represent perhaps the most significant action to date that it has taken to rollback emissions reductions.
Methodology
Average new light vehicle fuel-economy estimates – covering cars, SUVs and light trucks – for both the Obama standards and proposed Trump administration freeze were taken from the Rhodium Group analysis, “Sizing Up a Potential Fuel Economy Standards Freeze”, which was published in May 2018. The reference oil-price scenario from the Energy Information Agency (EIA) 2018 Annual Energy Outlook was used to simplify the analysis, though readers are encouraged to read the full Rhodium Group report to see additional oil-price scenarios.
The age curve of US vehicles was estimated based on the 2017 distribution of vehicle vintage from the EIA, assuming that age distribution remained fixed across the period examined. The figure below, from the EIA, shows the share of household vehicles of different ages.
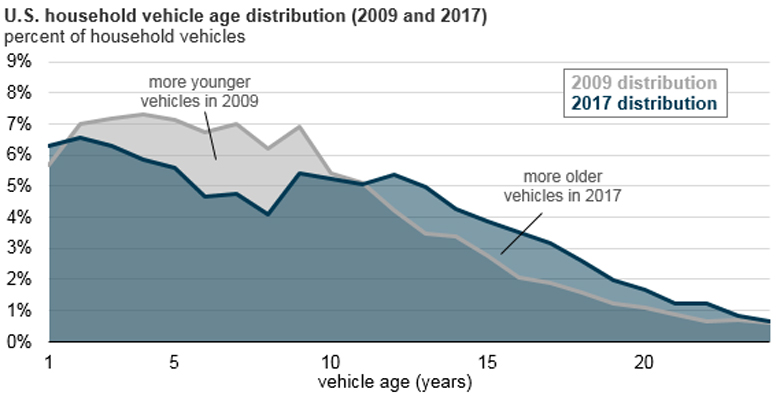
Average light-vehicle fuel standards was calculated based on new vehicle fuel-economy numbers from the Rhodium Group analysis and the EIA’s vehicle age curve, assuming that vehicles of all ages had similar use profiles (in other words that newer vehicles were not driven more). This assumption was made in the absence of any readily available estimates of the relationship between light vehicle age and miles driven.
CO2 emissions from light vehicles under both the Obama standards and Trump administration proposed freeze were calculated by assuming that per-capita light vehicle miles travelled remain constant at 2017 levels – and that the US population increases over time. Historical (and 2017) light vehicle miles travelled were taken from the Department of Transportation’s Bureau of Transportation Statistics. Population projections through 2035 were taken from US Census’s 2017 National Population Projections Dataset.
Gallons of fuel consumed were calculated by dividing total light vehicle miles travelled by average light vehicle miles per gallon. CO2 emissions were calculated assuming 8.89kg CO2 per gallon of fuel, based on data from the US EPA.