Analysis: UK emissions fall 2.4% in 2025 as coal hits 400-year low
Multiple Authors
03.05.26Multiple Authors
05.03.2026 | 6:03pmThe UK’s greenhouse gas emissions fell by 2.4% in 2025 to their lowest level in more than 150 years, according to new Carbon Brief analysis.
The biggest factors were gas use falling to a 34-year low and coal use dropping to levels last seen in 1600, when Queen Elizabeth I was on the throne and William Shakespeare was writing Hamlet.
These shifts were helped by record-high UK temperatures, elevated gas prices, the end of coal power in late 2024 and a sharp slowdown in the steel industry.
Other key findings of the analysis include:
- The UK’s greenhouse gas emissions fell to 364m tonnes of carbon dioxide equivalent (MtCO2e) in 2025, the lowest level since 1872.
- Coal use roughly halved, with more than half of this due to the end of coal power and another third due to closures and other issues in the steel industry.
- Gas use fell by 1.5% to the lowest level since 1992, with roughly equal contributions from cuts in heat for buildings and industry, more than offsetting a small rise in gas power.
- Oil use fell by 0.9%, despite rising traffic, helped by more than 700,000 new electric vehicles (EVs), electric vans and plug-in hybrids on the nation’s roads.
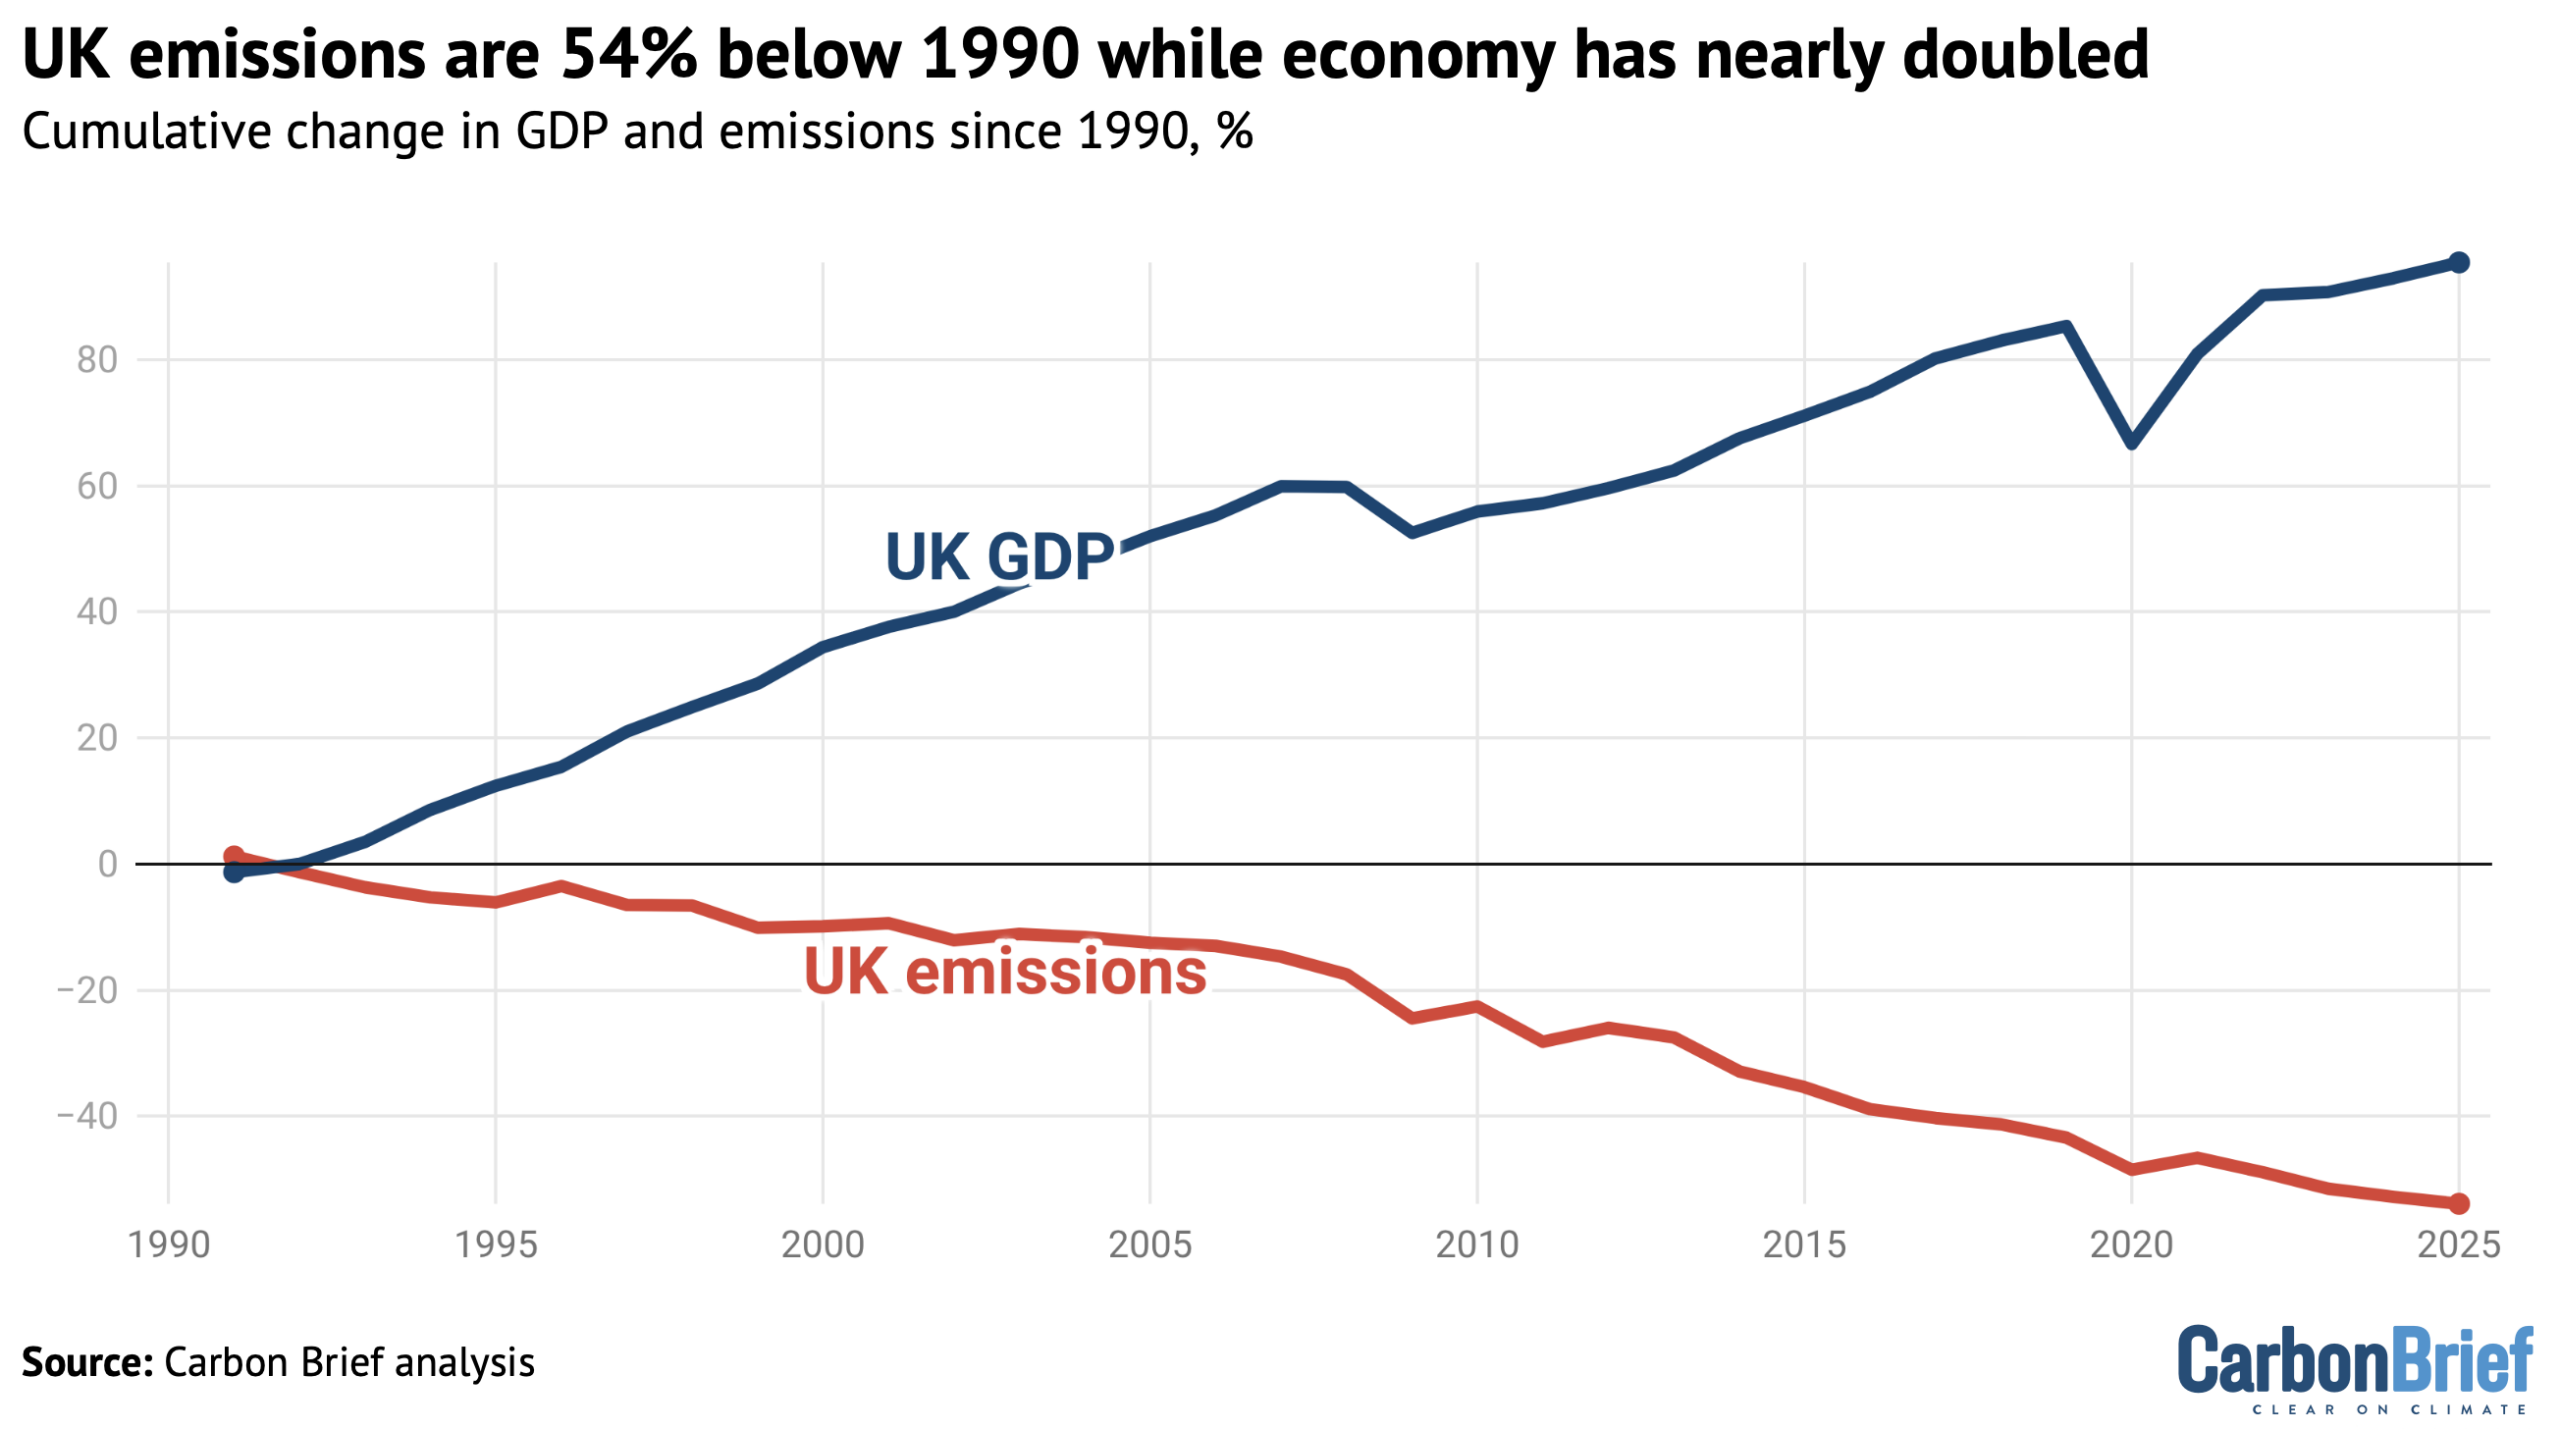
- The UK’s emissions are now 54% below 1990 levels, while its GDP has nearly doubled.
The 2.4% (8.9MtCO2e) fall in emissions in 2025 was only slightly more than half of the 15MtCO2e cut needed each year on average until 2050, to reach the UK’s legally binding net-zero target.
The analysis is the latest in a decade-long series of annual estimates from Carbon Brief, covering emissions during 2024, 2023, 2022, 2020, 2019, 2018, 2017, 2016, 2015 and 2014.
Emissions fall to 150-year low
The UK’s territorial greenhouse gas emissions – those that occur within the country’s borders – have now fallen in 27 of the 36 years since 1990.
(The recent fall in territorial emissions has not been “offset” by a rise in the amount of CO2 embedded in imports, which has stayed relatively constant since around 2008.)
Apart from brief rebounds after the global financial crisis and the Covid-19 lockdowns, UK emissions have fallen every year for the past two decades.
The latest 9MtCO2e (2.4%) reduction takes UK emissions down to 364MtCO2e, according to Carbon Brief’s analysis, which is 54% below 1990 levels.
This is the lowest since 1872, as shown in the figure below.
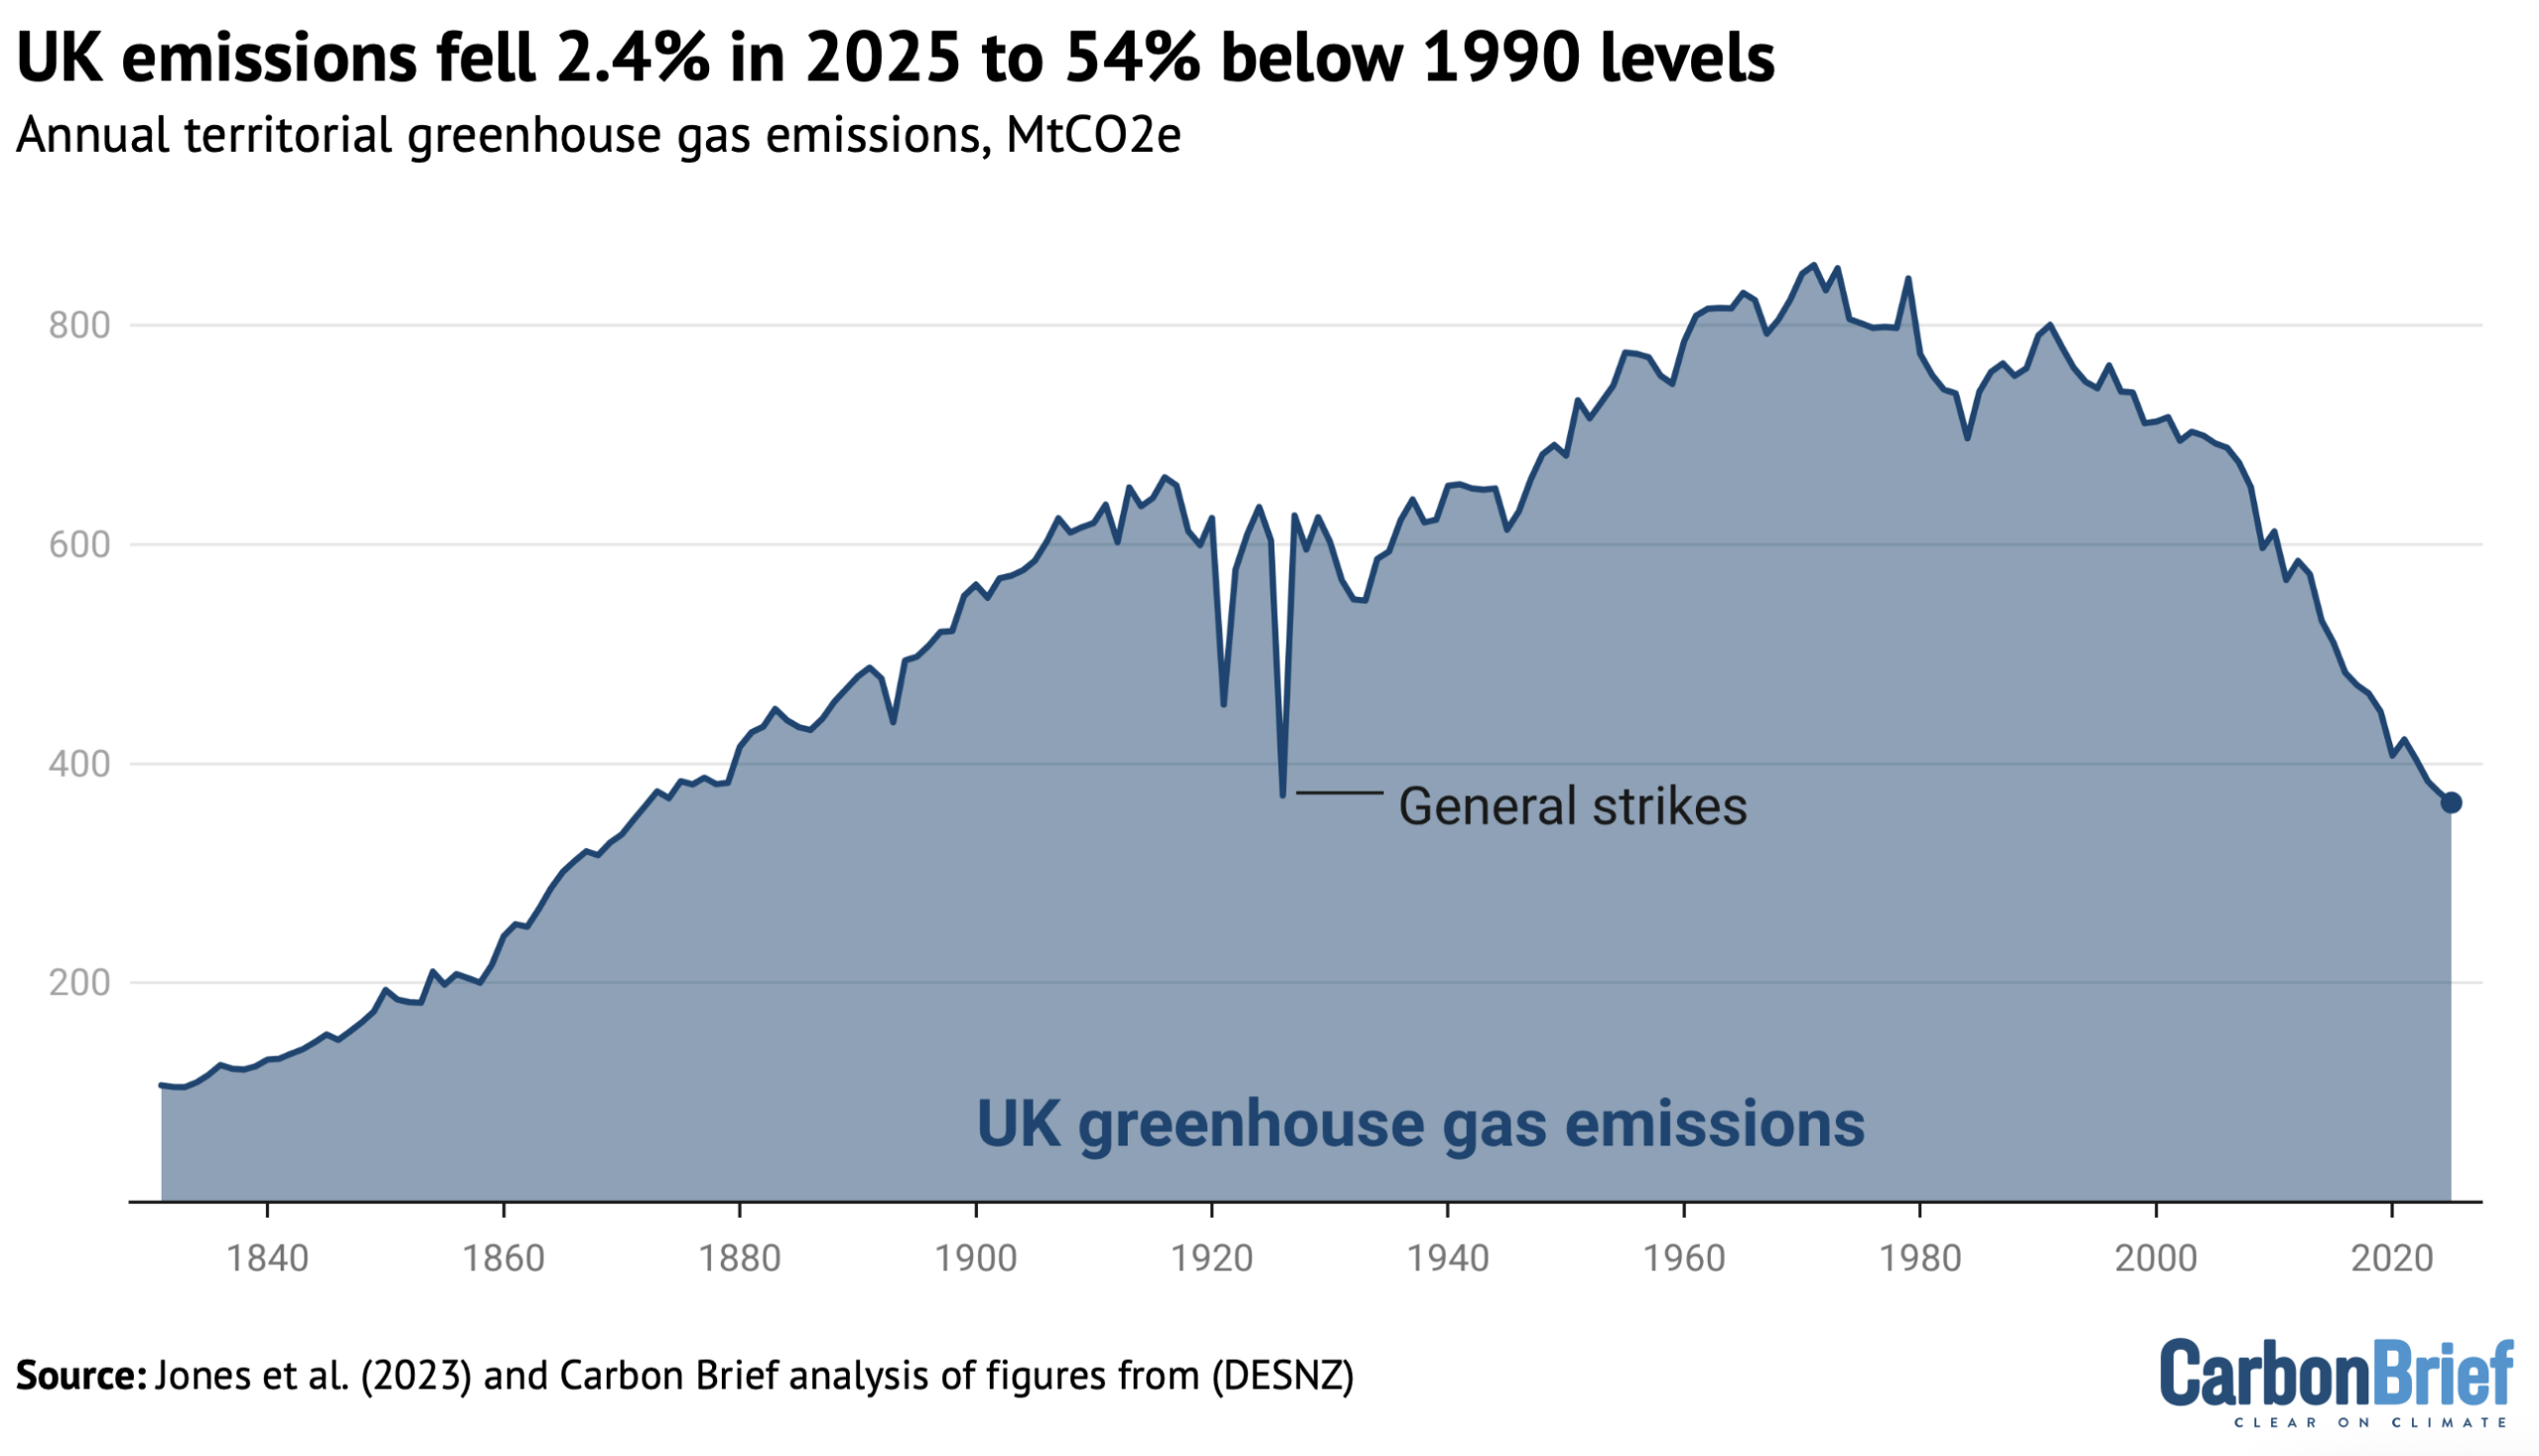
The latest fall puts UK emissions below the level seen during the 1926 general strike, when the nation’s industrial base was brought to a standstill.
It means that UK emissions are now at sustained lows not seen since Victorian times.
Nevertheless, emissions will need to continue falling in order to meet the UK’s legal climate goals and its net-zero target, which is part of international efforts under the Paris Agreement to stop dangerous warming.
Record lows for coal and gas
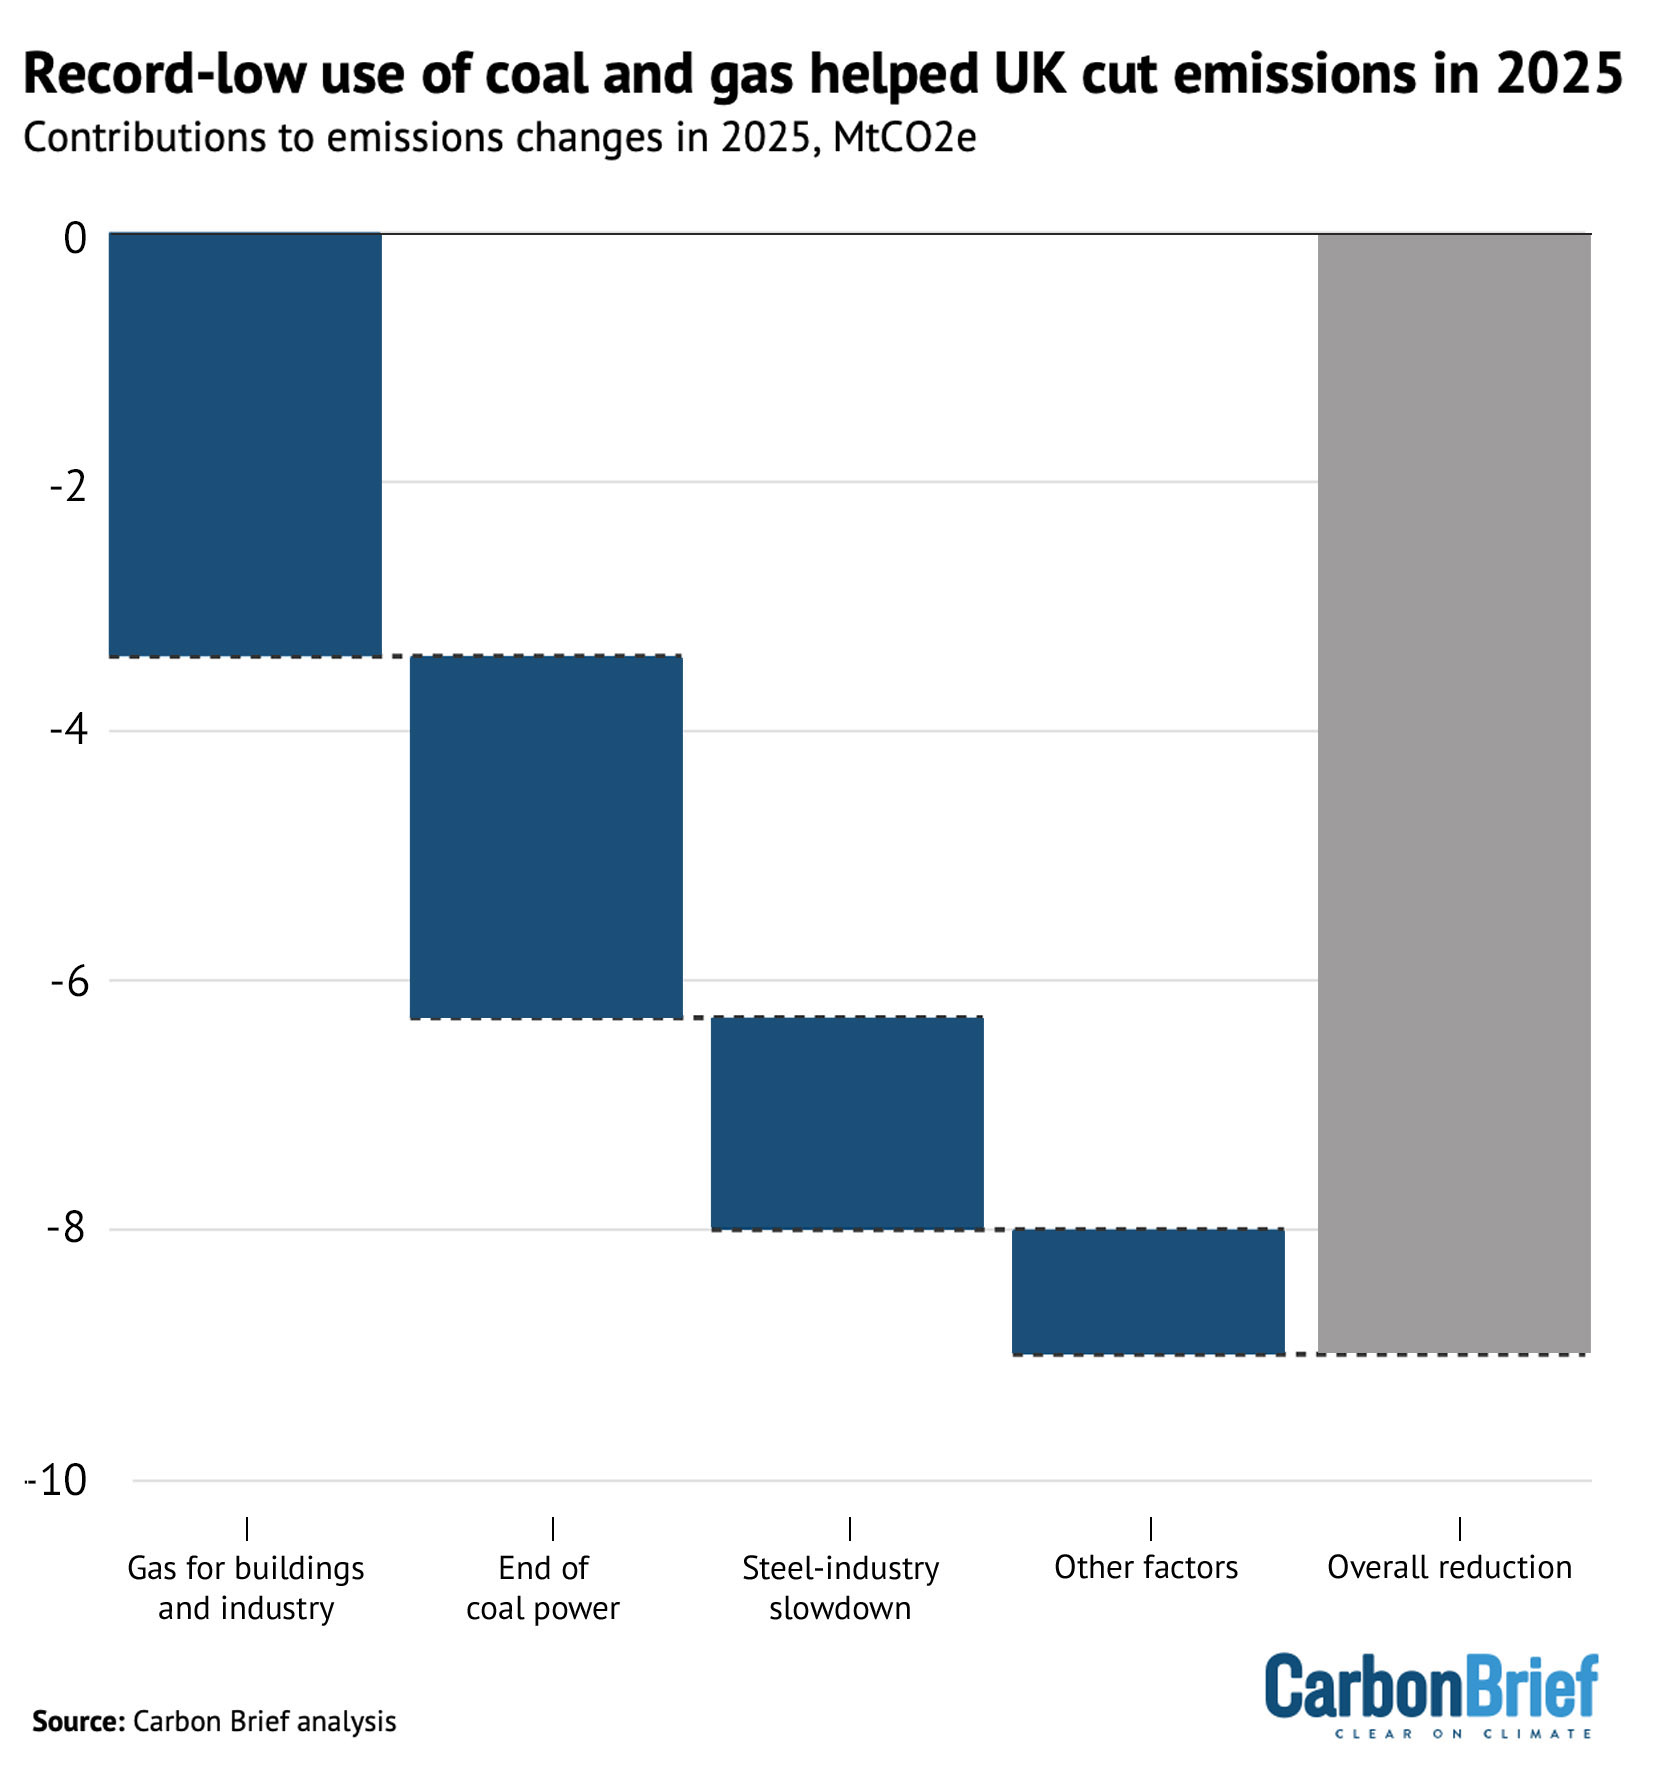
The key factors in driving down UK emissions in 2025 were coal and gas use falling to their lowest levels since 1600 and 1992, respectively.
For gas, this was mainly down to lower demand from building heat and from industry, likely at least partly related to record-high temperatures and elevated gas prices. For coal, this was a combination of the end of coal power and a steel-industry slowdown, as shown below.
These were not the only factors driving the change in UK emissions in 2025.
The UK saw record generation from renewable sources, particularly wind and solar, but a further decline in nuclear generation, the end of coal power and an increase in electricity demand for the second year running meant that gas-fired power output also went up slightly.
In the transport sector, demand for oil fell by 0.9% year-on-year, even though traffic levels went up by around 1%, according to provisional figures through to September 2025.
This partly reflects the changing makeup of vehicles on the road.
By 2024, there were 2.8m fewer diesel vehicles than there were in 2019, a trend likely to continue due to falling diesel car sales. In contrast, there are now nearly 3m EVs, plug-in hybrids or electric vans on the nation’s roads, making up 5% of the car fleet overall and 2% of vans.
These electrified vehicles are cutting UK emissions by more than 7MtCO2 every year, according to Carbon Brief analysis, with the 700,000 new EVs in 2025 alone saving nearly 2MtCO2.
Drivers with EVs saved a total of £2m in lower fuel costs in 2025, the analysis shows, as EVs are much more efficient and, therefore, cheaper to run than petrol or diesel vehicles. This amounts to more than £700 per EV per year and more than £1,100 for each electric van.
Despite falling demand for oil-derived fuels and the impact of the growing EV fleet, Carbon Brief estimates that the UK’s oil-related emissions actually increased by 0.2% in 2025. This is largely down to a shift in the amount and type of biofuel blended into diesel and petrol at the pump.
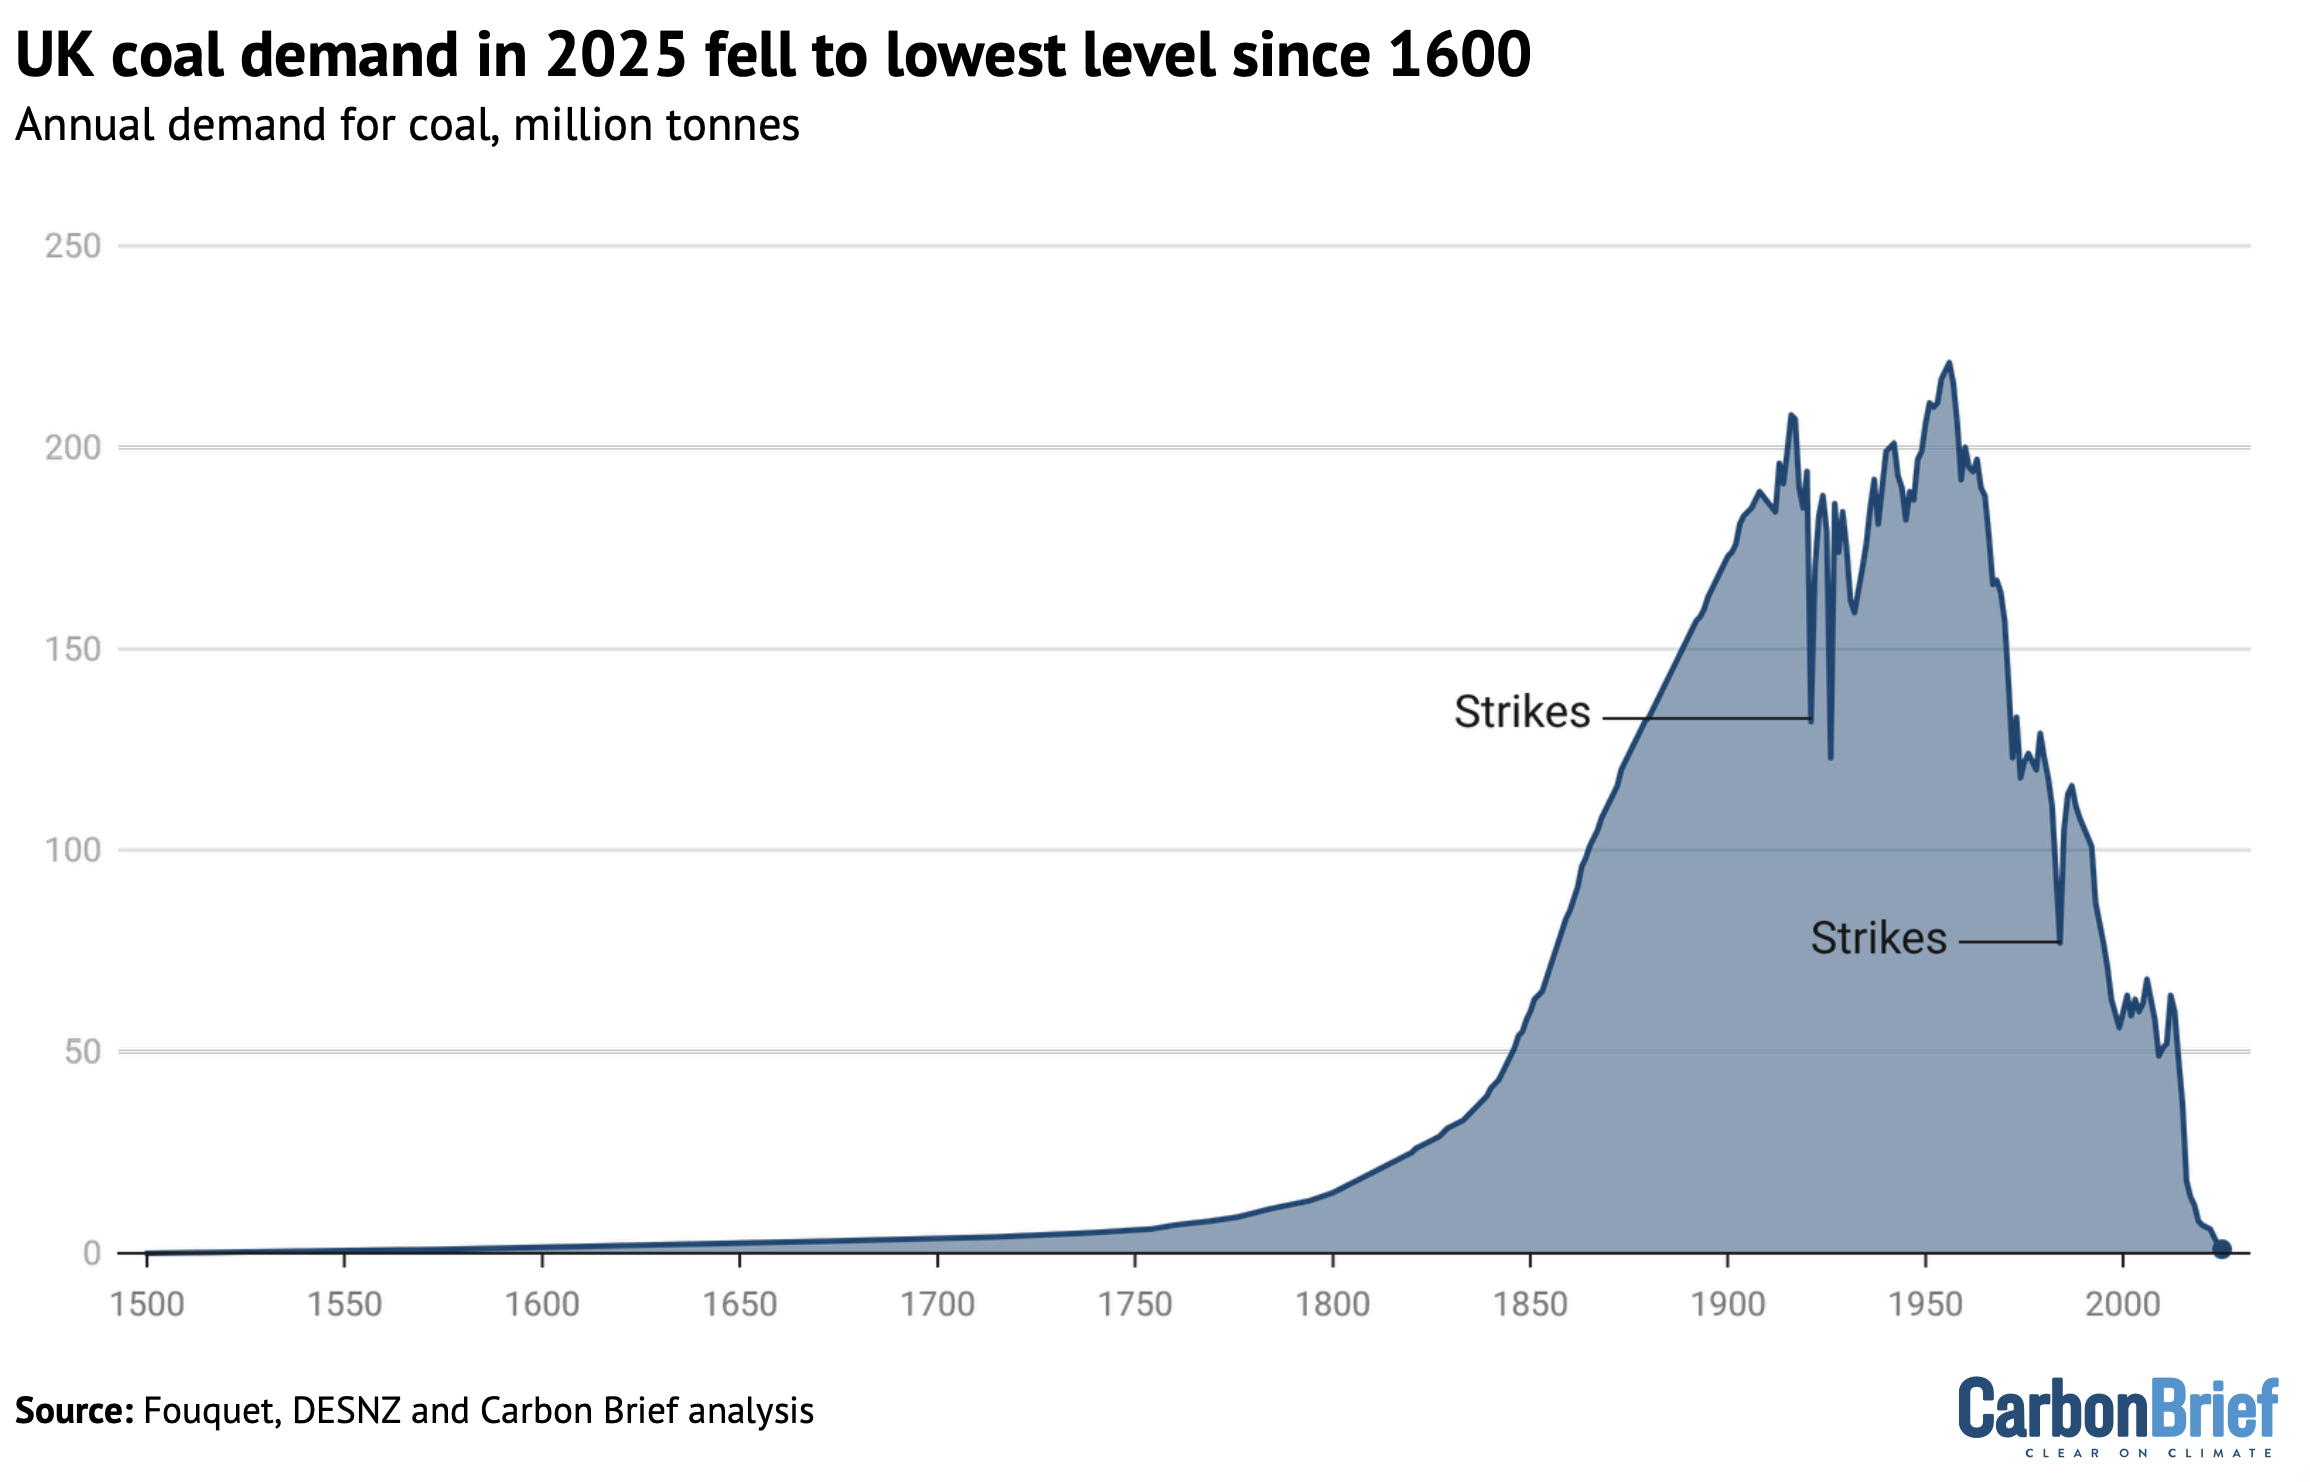
Coal falls to lowest level in 400 years
There have been dramatic declines in UK coal use over the past decade, in particular resulting from the phaseout of coal-fired electricity generation.
UK coal demand fell by another 56% in 2025 to just under 1m tonnes (Mt). This is down 97% from the 37Mt burned in 2015 and is 99.6% below the peak of 221Mt in 1956.
As shown in the figure below, coal demand is now at the lowest level since 1600, when Elizabeth I was the queen of England and Ireland.
(It was during her five-decade reign that coal had become the country’s main source of fuel, following an Elizabethan “energy crisis” triggered by a lack of wood for making charcoal.)
The UK’s last coal-fired power plant, at Ratcliffe-on-Soar in Nottinghamshire, closed down on 30 September 2024. It had run at low levels that year, but still burned some 0.7m tonnes of coal. The end of coal power contributed nearly three-fifths of the fall in demand for the fuel in 2025.
There has also been a marked reduction in UK steel production in recent years, particularly since the closure of two of the nation’s last blast furnaces at Port Talbot in south Wales in 2024.
The last blast furnaces in the country are at the British Steel plant in Scunthorpe in Lincolnshire, which had been due for closure in early 2025 until the government stepped in to keep it open.
The slowdown in coal-based steel production accounts for around a third of the decline in UK coal use in 2025, but only 14% of the drop in the past decade, which was mainly due to coal power.
Globally, the steel industry is facing intense competition in an oversupplied market, with a growing “glut” that has driven down prices. At the same time, the industry in the UK has ageing equipment and expensive electricity, which UK Steel says is largely a result of high gas prices.
The Port Talbot site is being converted to “electric arc furnace” (EAF) steelmaking, which does not rely on coal. The same shift is under discussion for the Scunthorpe site. Analysis from thinktank Green Alliance suggests EAFs would be the cheapest option for both sites.
Gas falls to lowest level in 34 years
There have also been dramatic declines in UK demand for gas over the past 15 years. After another 1.5% drop in 2025, gas use is now at the lowest level since 1992, as shown below.
This means gas demand is now similar to when the UK began its “dash for gas” in the early 1990s. Starting in 1991, this period saw a wave of new gas-fired power stations being built. It was triggered by a change in regulations to allow the use of gas to generate electricity, advances in turbine technology, a period of low gas prices and the privatisation of the UK electricity system.
In total, UK gas demand has fallen by nearly two-fifths since 2010. Half of this overall reduction is due to a 50% fall in gas-fired electricity generation, which has been displaced by falling demand and renewable sources. Another third of the overall reduction is from home heating, where demand has dropped due to more efficient gas boilers and improved insulation.
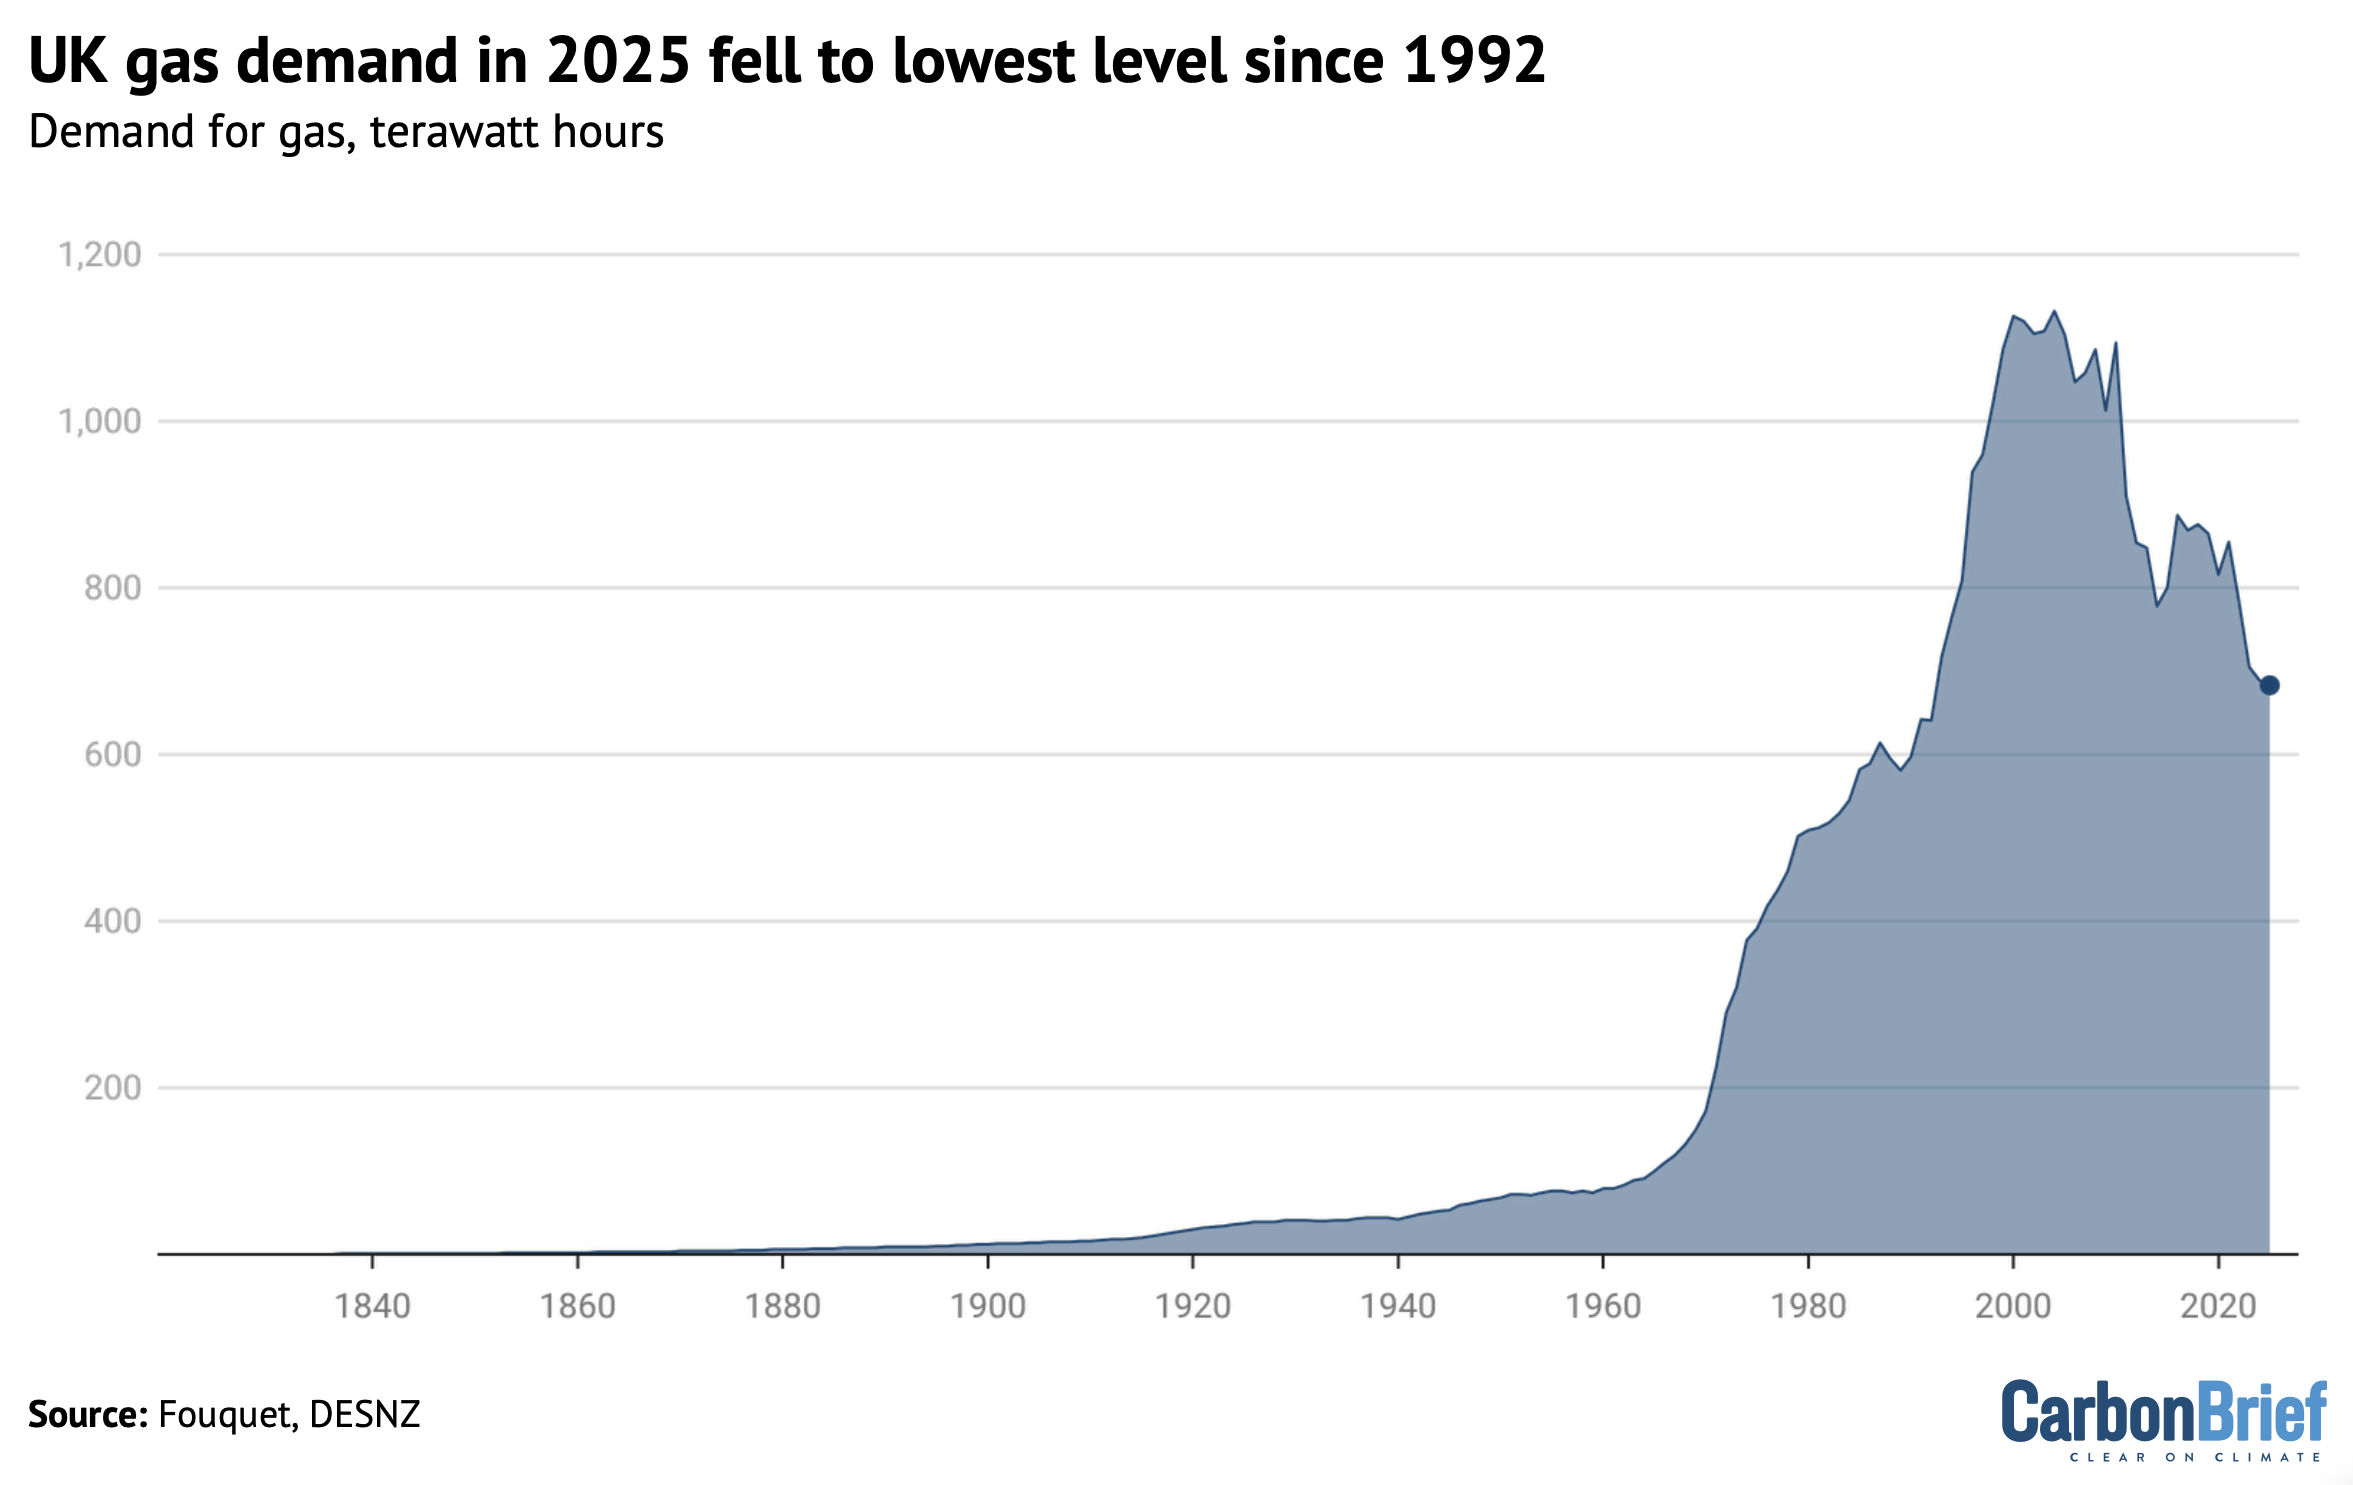
In 2025, the 1.5% reduction in gas use was caused by roughly equal contributions from lower demand for building heat and from industrial users.
This was helped by 2025 being the hottest year on record, with high gas prices likely also a factor.
Gas prices have remained significantly above the levels seen before Russia’s invasion of Ukraine in 2022. At the start of March 2026, UK gas prices roughly doubled as a result of the conflict in the Middle East triggered by the US and Israeli attacks on Iran.
Whereas the UK’s fleet of EVs is already having a significant impact on emissions, domestic heat pump sales remain at relatively low levels, particularly compared with other European nations.
After a 25% year-on-year increase in 2025, there were still only 125,000 heat pump sales in the UK. These new installations will have cut UK emissions by around 0.2MtCO2 in 2025 relative to gas heating, shows Carbon Brief analysis.
By the end of 2025, the UK had a total of around 450,000 domestic heat pumps, generating total savings of roughly 0.7MtCO2 after accounting for the increase in electricity demand.
The 2.3m domestic heat pumps expected by 2030 in the National Energy System Operator’s “future energy scenarios” would save the UK around 4.5MtCO2 per year.
Emissions continue to decouple from growth
In total, UK greenhouse gas emissions in 2025 fell to 54% below 1990 levels, the baseline year for its legally binding climate goals.
Since then, the UK economy has nearly doubled in size, with GDP growing by 95% according to data from the World Bank, as shown in the figure below.
Transport remains the single-largest sector, accounting for around 30% of UK emissions, followed, in order, by buildings, agriculture, industry and electricity generation.
The majority of emissions cuts over recent decades have come in the power sector – formerly, the UK’s largest emitter – as coal has been phased out and renewables have replaced gas.
This is set to change over the next 10-15 years. The rise of EVs is set to make transport the largest source of emissions cuts from now until 2040, according to the Climate Change Committee.
While industrial emissions have also declined significantly since 1990, falling some 74% by 2025, the size of UK manufacturing output has also roughly doubled.
Despite the progress in cutting emissions to date, the UK has a long way to go if it is to meet its climate goals in the future, including the yet-to-be legislated seventh “carbon budget”, covering the years 2038-2042, as well as the 2050 net-zero target.
Emissions would need to fall by 15MtCO2e each year until 2050 on average, in order to meet the net-zero target. Meeting the UK’s 2035 international pledge under the Paris Agreement, a 78% reduction below 1990 levels, emissions would need to fall by 22MtCO2e per year.
These figures can be compared with the 9MtCO2e cut achieved in 2025. Emissions did, in fact, fall by an average of 15MtCO2e per year over the past decade – and by an average of 13MtCO2e per year since the turn of the century.
Methodology
The starting point for Carbon Brief’s analysis of UK greenhouse gas emissions is preliminary government estimates of energy use by fuel. These are published monthly, with the final month of each year appearing in figures published at the end of the following February. The same approach has accurately estimated year-to-year changes in emissions in previous years (see table, below).
Annual change in UK greenhouse gas emissions, %
| Year | Official figures | Carbon Brief | Difference |
|---|---|---|---|
| 2010 | 2.5 | 2.7 | 0.1 |
| 2011 | -7.2 | -7.7 | -0.4 |
| 2012 | 3.1 | 3.6 | 0.6 |
| 2013 | -2.1 | -4.1 | -2.0 |
| 2014 | -7.4 | -7.5 | -0.1 |
| 2015 | -3.8 | -3.7 | 0.0 |
| 2016 | -5.4 | -5.7 | -0.3 |
| 2017 | -2.4 | -2.0 | 0.4 |
| 2018 | -1.6 | -1.7 | -0.1 |
| 2019 | -3.6 | -3.9 | -0.3 |
| 2020 | -8.9 | -8.8 | 0.1 |
| 2021 | 3.6 | 3.5 | -0.1 |
| 2022 | -4.3 | -3.6 | 0.7 |
| 2023 | -5.0 | -5.2 | -0.2 |
| 2024 | -2.7 | -3.0 | -0.3 |
| 2025 | -2.4 |
One large source of uncertainty is the provisional energy use data, which is revised at the end of March each year and often again later on.
Emissions data is also subject to revision in light of improvements in data collection and the methodology used, with major revisions in 2021 and more minor changes in early 2026.
The latest changes to the DESNZ emissions methodology have led to 2% reduction in baseline 1990 emissions, but the impact on recent years is minimal.
This does not affect the UK’s carbon budgets, which are set in terms of tonnes of emissions over a five-year period, rather than a percentage reduction compared with 1990 levels.
The table above applies Carbon Brief’s emissions calculations to the comparable energy use and emissions figures, which may differ from those published previously.
Another source of uncertainty is the fact that Carbon Brief’s approach to estimating the annual change in emissions differs from the methodology used for the government’s own provisional estimates. The government has access to more granular data not available for public use.
Carbon Brief’s analysis takes figures on the amount of energy sourced from coal, oil and gas reported in Energy Trends 1.2. These figures are combined with conversion factors for the CO2 emissions per unit of energy, published annually by the UK government. Conversion factors are available for each fuel type, for example, petrol, diesel, gas and coal for electricity generation.
For oil, the analysis also draws on Energy Trends 3.13, which further breaks down demand according to the subtype of oil, for example, petrol, jet fuel and so on. Similarly, for coal, the analysis draws on Energy Trends 2.6, which breaks down solid fuel use by subtype.
Emissions from each fuel are then estimated from the energy use multiplied by the conversion factor, weighted by the relative proportions for each fuel subtype.
For example, the UK uses roughly 50m tonnes of oil equivalent (Mtoe) in the form of oil products, around half of which is from road diesel. So half the total energy use from oil is combined with the conversion factor for road diesel, another one-fifth for petrol and so on.
Energy use from each fossil fuel subtype is mapped onto the appropriate emissions conversion factor. In some cases, there is no direct read-across, in which case the nearest appropriate substitute is used. For example, energy use listed as “bitumen” is mapped to “processed fuel oils – residual oil”. Similarly, solid fuel used by “other conversion industries” is mapped to “petroleum coke” and “other” solid fuel use is mapped to “coal (domestic)”.
The energy use figures are calculated on an inland consumption basis, meaning they include bunkers consumed in the UK for international transport by air and sea. In contrast, national emissions inventories exclude international aviation and shipping.
The analysis, therefore, estimates and removes the part of oil use that is due to the UK’s share of international aviation. It draws on the UK’s final greenhouse gas emissions inventory, which breaks emissions down by sector and reports the total for domestic aviation.
This domestic emissions figure is compared with the estimated emissions due to jet fuel use overall, based on the appropriate conversion factor. The analysis assumes that domestic aviation’s share of emissions is equivalent to its share of jet fuel energy use.
In addition to estimating CO2 emissions from fossil fuel use, Carbon Brief assumes that CO2 emissions from non-fuel sources, such as land-use change and forestry, are the same as a year earlier. The remaining greenhouse gas emissions are assumed to change in line with the latest government energy and emissions projections.
These assumptions are based on the UK government’s own methodology for preliminary greenhouse gas emissions estimates, published in 2019.
Note that the figures in this article are for emissions within the UK measured according to international guidelines. This means they exclude emissions associated with imported goods, including imported biomass, as well as the UK’s share of international aviation and shipping.
The Office for National Statistics (ONS) has published detailed comparisons between various approaches to calculating UK emissions, on a territorial, consumption, “environmental accounts” or “international accounting” basis.
The UK’s consumption-based CO2 emissions increased between 1990 and 2007. Since then, however, they have fallen by a similar number of tonnes as emissions within the UK.
Bioenergy is a significant source of renewable energy in the UK and its climate benefits are disputed. Contrary to public perception, however, only around one-quarter of bioenergy is imported.
International aviation is considered part of the UK’s carbon budgets and faces the prospect of tighter limits on its CO2 emissions. The international shipping sector has a target to at least halve its emissions by 2050, relative to 2008 levels.