Analysis: Why coal use must plummet this decade to keep global warming below 1.5C
Simon Evans
02.06.20Simon Evans
06.02.2020 | 8:00amThe next 10 years are crucial for tackling climate change, with widespread recognition that CO2 emissions must fall 45% by 2030 to keep global warming below 1.5C.
Yet global emissions are expected to continue rising, despite the pledges made by every country of the world under the 2015 Paris Agreement. This ambition gap is getting larger over time.
New Carbon Brief analysis of scenarios gathered by the Intergovernmental Panel on Climate Change (IPCC) and other data, shows that the ambition gap is particularly large for coal. Emissions from coal fall by around four-fifths this decade on a 1.5C pathway, twice as fast as for oil or gas.
Moreover, CO2 from burning coal must still be roughly halved over the next 10 years to keep warming “well-below 2C” at the lowest cost, the analysis shows.
Carbon Brief’s animation, below, shows how coal, oil and gas emissions change in just one pathway to keeping warming below 1.5C. This article explains where the numbers come from and how they change if the world chooses other – or less ambitious – routes to limiting warming.
Record emissions
The 2015 Paris Agreement aims to keep global temperatures “well-below 2C” above pre-industrial levels and to “pursue efforts” to stay within 1.5C. But, as UNEP and others have repeatedly highlighted, there is a yawning gap between the actions countries are taking and what would be required to meet the Paris targets.
As the last decade came to a close in 2019, the world’s CO2 emissions from burning fossil fuels had reached a record high, as the chart below shows (solid lines). Although coal is now the single largest contributor (black), emissions from oil (orange) and gas (blue) are rising fast.
Global emissions from coal (black line), oil (orange) and gas (blue), in billions of tonnes of CO2, between 1959 and 2019 (solid lines). Expected emissions for each fuel during the 2020s (shaded) are shown with dotted lines, based on the International Energy Agency (IEA) World Energy Outlook 2019 “Stated Policies Scenario” (STEPS). Source: Global Carbon Project, IEA WEO2019 and Carbon Brief analysis. Chart by Carbon Brief using Highcharts.
If governments stick with their existing policies and pledges, then fossil-fuel emissions are expected to continue rising this decade, according to the International Energy Agency (IEA). The dotted lines in the chart above show how it expects those emissions to change by 2030.
Decade of action
In an effort to raise global ambition, UN secretary-general António Guterres has called for the 2020s to be a “decade of action” towards goals on climate and sustainable development. He has given particular attention to coal, calling for an end to new coal-fired power stations after 2020.
Before the COP26 climate summit in November, countries are expected to raise the ambition of their Paris pledges (nationally determined contributions, NDCs). At COP25, they agreed on the “urgent need to address the [ambition] gap” as they update or recommunicate their NDCs this year.
Of the various ways to measure this ambition gap, one increasingly common refrain is that CO2 emissions need to fall to 45% below 2010 levels by 2030, to stay below 1.5C. This is an average of 53 least-cost pathways to 1.5C, developed in integrated assessment models (IAMs), and included in the Intergovernmental Panel on Climate Change (IPCC) special report on 1.5C (SR15).
Less widely understood are the very uneven implications for coal, oil and gas. To stay below 1.5C, emissions from coal need to fall around twice as quickly in the 2020s as those from oil and gas, according to Carbon Brief analysis of all relevant pathways in the SR15 database.
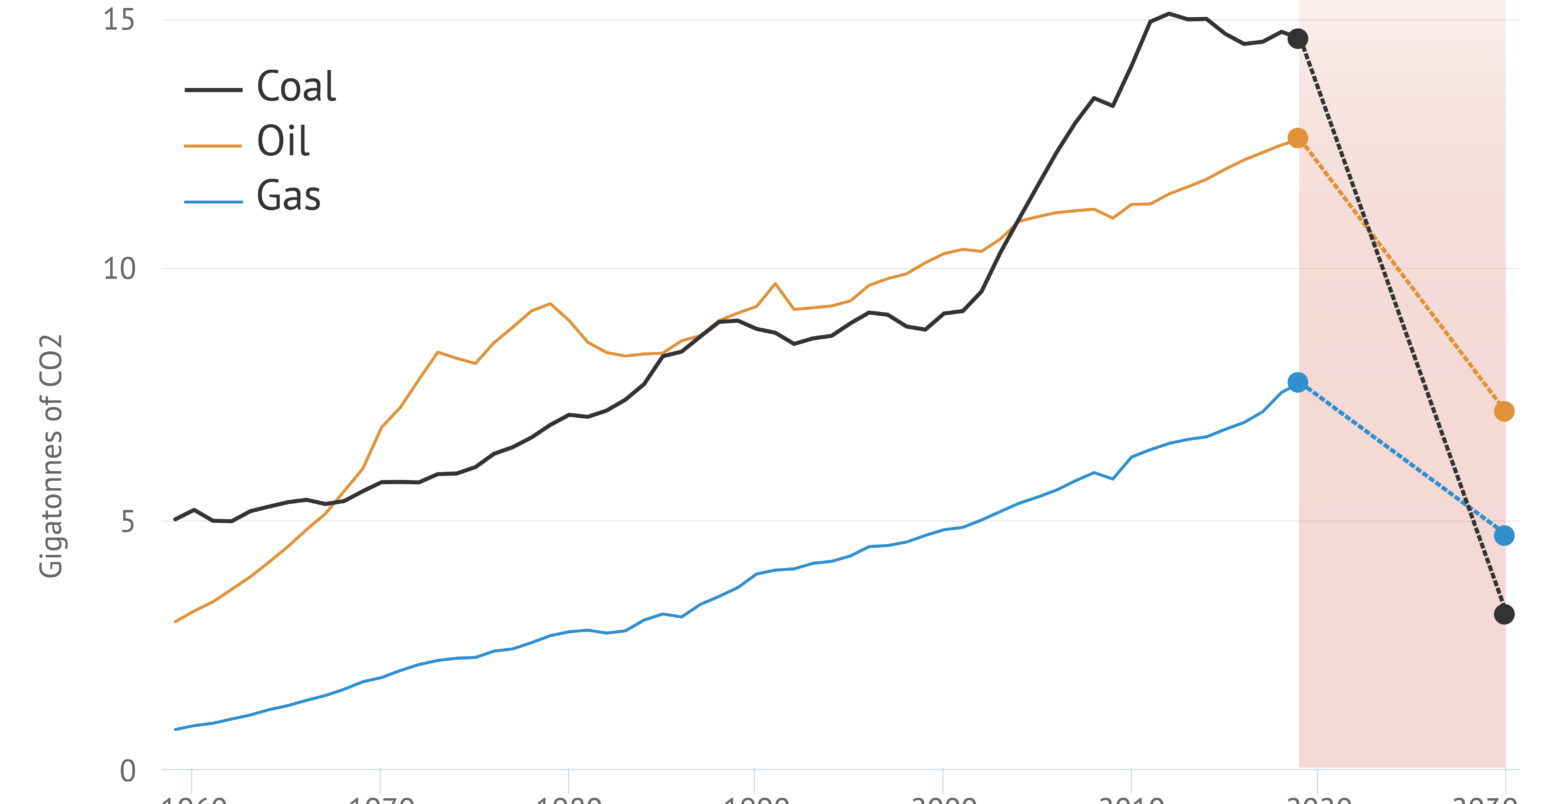
The chart below shows one such pathway towards 1.5C, the “P1” scenario from SR15. In this scenario, coal emissions fall by four-fifths from 2019 to 2030 (79%, dashed black line) while oil (44%, orange) and gas (39%, blue) each drop by around two-fifths.
Global emissions from coal (black line), oil (orange) and gas (blue), in billions of tonnes of CO2, between 1959 and 2019 (solid lines). The dotted lines in the shaded area show emissions from each fuel in the “P1” scenario, from the IPCC special report on 1.5C (SR15). Sources: Global Carbon Project, IPCC SR15 and Carbon Brief analysis. Chart by Carbon Brief using Highcharts.
It is difficult to visualise the challenge of cutting global coal emissions by four-fifths within 10 years. The amount of CO2 released by coal burning each year would need to fall from around 14bn tonnes (GtCO2) in 2019 to just 3GtCO2 in 2030, an annual reduction of 1GtCO2.
To put this in perspective, it would be equivalent to closing every coal-fired power station in the US in 2020, then doing the same again every year until 2030. The cumulative 11GtCO2 cut by 2030 is more than the estimated 10GtCO2 released by every coal plant in the world in 2019.
Although these are very large numbers, it is worth noting that the US has already halved its emissions from coal power, which fell from around 2GtCO2 in 2010 to 1GtCO2 in 2019. Similar reductions have been made in the EU, in percentage terms, with a fall of one fifth in 2019 alone.
Different paths
There are – at least in theory – many different routes to staying below 1.5C. The chart and animation above are based on just one pathway to 1.5C, the “P1” scenario from the IPCC SR15.
One reasonable question to ask is: does coal use fall by four-fifths this decade in all scenarios? Another question is: are there ways to stay below 1.5C that entail less extreme reductions in the use of the fuel?
In short, coal emissions fall extremely fast this decade in all pathways to 1.5C – and roughly twice as fast as emissions from oil and gas. There are several reasons why this should be the case.
First, the remaining carbon budget for 1.5C is extremely small, equivalent to around eight years of current emissions. Coal is the single largest contributor to emissions today and it emits far more CO2 per unit of energy than oil or gas, so it must inevitably fall quickly to keep warming below 1.5C.
Second, the more rapid reductions in coal emissions in the least-cost pathways to 1.5C reflect the availability of economically attractive alternatives that can be deployed in IAMs – and in the real world – including wind, solar and other zero-carbon sources of electricity. Notably coal plants around the world are facing financial difficulties, with loss-making operations from Europe to China.
The chart below shows the range of emissions from coal (black wedge), oil (orange) and gas (blue) this decade, in SR15 scenarios that stay below 1.5C with “no or low overshoot”. This means pathways with at least a 33% chance of staying below 1.5C throughout this century and at least a 50% chance of keeping temperatures to less than 1.5C above pre-industrial levels in 2100.
Global emissions from coal (black line), oil (orange) and gas (blue), in billions of tonnes of CO2, between 2000 and 2019 (solid lines). Currently expected emissions for each fuel during the 2020s (shaded) are shown with dotted lines, based on the International Energy Agency (IEA) World Energy Outlook 2019 “Stated Policies Scenario” (STEPS). The coloured wedges show the range of emissions for each fuel in “no or low overshoot” 1.5C scenarios from SR15, filtered to exclude unsustainable use of bioenergy. Sources: Global Carbon Project, IEA WEO2019, IPCC SR15 and Carbon Brief analysis. Chart by Carbon Brief using Highcharts.
Note that the chart excludes pathways reliant on higher levels of bioenergy or bioenergy with carbon capture and storage (BECCS) that are likely to be unsustainable, according to the IPCC special report on 1.5C.
For bioenergy, this was based on a limit of 100 exajoules (EJ) of primary energy in 2050, as set out in section 4.3.1.2 of the report. For BECCS, the limit was 5GtCO2 of annual CO2 removals in 2050, as discussed in section 4.3.7 of the report.
In the pathways to 1.5C shown in the chart above, coal emissions fall by 67-78% this decade (25th to 75th percentile range). In contrast, oil emissions in 2030 range from 4% to 38% below 2019 levels and gas emissions fall by 9-39% this decade.
(If pathways using unsustainable levels of bioenergy are included in the analysis, then the models cut emissions from oil and gas slightly faster over the next decade. This could reflect the use of biofuels to replace petrol and diesel or biomass to replace gas heating, for example.)
The chart above suggests that the IAMs, when given a target to stay below 1.5C and given constraints on unsustainable use of bioenergy, see low-carbon alternatives to coal as more cost-effective and, therefore, more rapidly deployable than for oil and gas.
By implication, there may be an assumption entered into the models by their operators that, for example, electric vehicles (EVs) remain more costly than combustion-engine cars during the 2020s or that charging infrastructure is limited and that adoption rates are, therefore, low.
Alternatively, the implication may be that even a relatively rapid rollout of EVs would initially have limited impact on emissions from oil. If in spite of the model scenarios, oil emissions end up being cut more quickly in the real world, then emissions from coal or gas could be cut more slowly, while still staying within a 1.5C budget.
Alternatively, the shift towards SUVs and other factors could make it even harder to decarbonise oil use, meaning more effort is needed on coal and gas. The point is that staying within any particular carbon budget at lowest cost entails trade-offs, which the IAMs are designed to help us navigate.
More warming
If the 1.5C limit is breached, as many expect is likely, then it stands to reason that emissions from global coal use could fall more slowly than in the scenarios set out above. How much more slowly?
The main long-term goal of the Paris Agreement is to limit warming to “well-below 2C”, an ill-defined target that is open to interpretation. One reasonable proxy is to look at the scenarios labelled “lower 2C” in the IPCC SR15 database, which was the basis for Carbon Brief’s analysis.
“Lower 2C” pathways are those considered “unlikely” to breach 2C, meaning the probability is no more than 33% – and their average (median) peak warming this century is 1.7C. In contrast, “higher 2C” scenarios have no more than a 50% chance of exceeding 2C and an average (median) peak of 1.9C.
In “lower 2C” scenarios filtered to exclude unsustainable levels of bioenergy, coal emissions fall by 42-70% this decade (25th-75th percentile), as the chart below shows (black wedge). Again, this is far faster than for other fossil fuels, with oil emissions in 2030 ranging from 2% below to 13% above 2019 levels (orange) and gas between 9% below and 19% above 2019 (blue).
Global emissions from coal (black line), oil (orange) and gas (blue), in billions of tonnes of CO2, between 2000 and 2019 (solid lines). Currently expected emissions for each fuel during the 2020s (shaded) are shown with dotted lines, based on the International Energy Agency (IEA) World Energy Outlook 2019 “Stated Policies Scenario” (STEPS). The coloured wedges show the range of emissions for each fuel in “lower 2C” scenarios from SR15, as a proxy for “well-below 2C”, and filtered to exclude unsustainable use of bioenergy. Sources: Global Carbon Project, IEA WEO2019, IPCC SR15 and Carbon Brief analysis. Chart by Carbon Brief using Highcharts.
Notably, emissions from coal are expected to be far greater than the “well-below 2C” range, given current government policies and pledges. This points to a significant ambition gap that needs to be closed, if even the less ambitious Paris warming limit is to be respected.
Although oil and gas emissions appear to be within the range of well-below 2C scenarios during the 2020s, they are currently expected to continue rising thereafter. Staying well-below 2C would require oil and gas emissions to start falling by the 2030s, as the chart below shows.
Global emissions from coal (black line), oil (orange) and gas (blue), in billions of tonnes of CO2, between 2010 and 2019 (solid lines). Currently expected emissions for each fuel during the 2020s and 2030s (shaded) are shown with dotted lines, based on the International Energy Agency (IEA) World Energy Outlook 2019 “Stated Policies Scenario” (STEPS). The coloured wedges show the range of emissions for each fuel in “lower 2C” scenarios from SR15, as a proxy for “well-below 2C”, and filtered to exclude unsustainable use of bioenergy. Sources: Global Carbon Project, IEA WEO2019, IPCC SR15 and Carbon Brief analysis. Chart by Carbon Brief using Highcharts.
The analysis above breaks down the significant ambition gap between government policies and pledges, and the required cuts in emissions from each fossil fuel to keep global warming below 1.5C or well-below 2C.
This analysis shows that the ambition gap is particularly large for coal, given model assumptions around relative costs to mitigate emissions from each fuel and from each sector.
Whether or not those assumptions are correct, the range of scenarios expose the choices ahead, trading off faster cuts in emissions from one fossil fuel or another, and between lower levels of warming or more extreme temperatures.
Either action to tackle emissions from fossil-fuel burning must be rapidly stepped up, or the global community must accept warming beyond the levels deemed dangerous in the Paris Agreement – as adopted by consensus among more than 190 countries in 2015.
-
Analysis: Why coal use must plummet this decade to keep global warming below 1.5C