Archive photos reveal Greenland’s contribution to sea level rise
Robert McSweeney
12.16.15Robert McSweeney
16.12.2015 | 6:00pmUsing a “treasure trove” of aerial photos of Greenland, a new study claims to solve a long-standing gap in scientific evidence – how much ice has disappeared from the Greenland ice sheet over the past century.
The findings suggest meltwater from Greenland has added 25mm to global sea levels between 1900 and 2010, and the ice sheet is now losing ice at more than twice the rate it was during the 20th century, the researchers say.
‘A big problem’
According to the latest report from the Intergovernmental Panel on Climate Change (IPCC), the Greenland ice sheet has been contributing between 0.25mm and 0.41mm per year to global sea levels since 1993.
Scientists estimate these figures based on satellite data, says Prof Kurt Kjær from the Natural History Museum at the University of Copenhagen, co-author of the new study in Nature. Measurements of ice sheet elevation changes indicate the volume of ice lost, and hence the contribution to sea levels, he tells Carbon Brief.
But before 1993 these satellites weren’t yet whizzing along above the Earth. So researchers need to look elsewhere for clues of ice sheet melt in the more distant past.
This isn’t straightforward, says Dr Beata Csatho, an associate professor of geology from the University at Buffalo, in an accompanying News & Views piece:
As a result, the IPCC doesn’t ascribe any contribution to sea levels from the Greenland ice sheet – nor from Antarctica’s – before the early 1990s in its assessment. This creates a gap in the global sea level budget. When scientists add up all the different contributions to sea levels – such as melting glaciers and ice sheets, and water expanding as it warms – and compare it to overall observed sea level rise, the two numbers don’t quite match.
But with the help of thousands of aerial photos of the ice sheet taken between 1978 and 1987, the new study aims to help close this gap.
Using the photos, recorded by the then Danish National Cadastre and Survey (now the Danish Geodata Agency, GST), the researchers have pieced together a digital reconstruction of the past and present elevations of the Greenland ice sheet. And knowing how much ice it has lost means knowing how much meltwater it has added to the oceans.
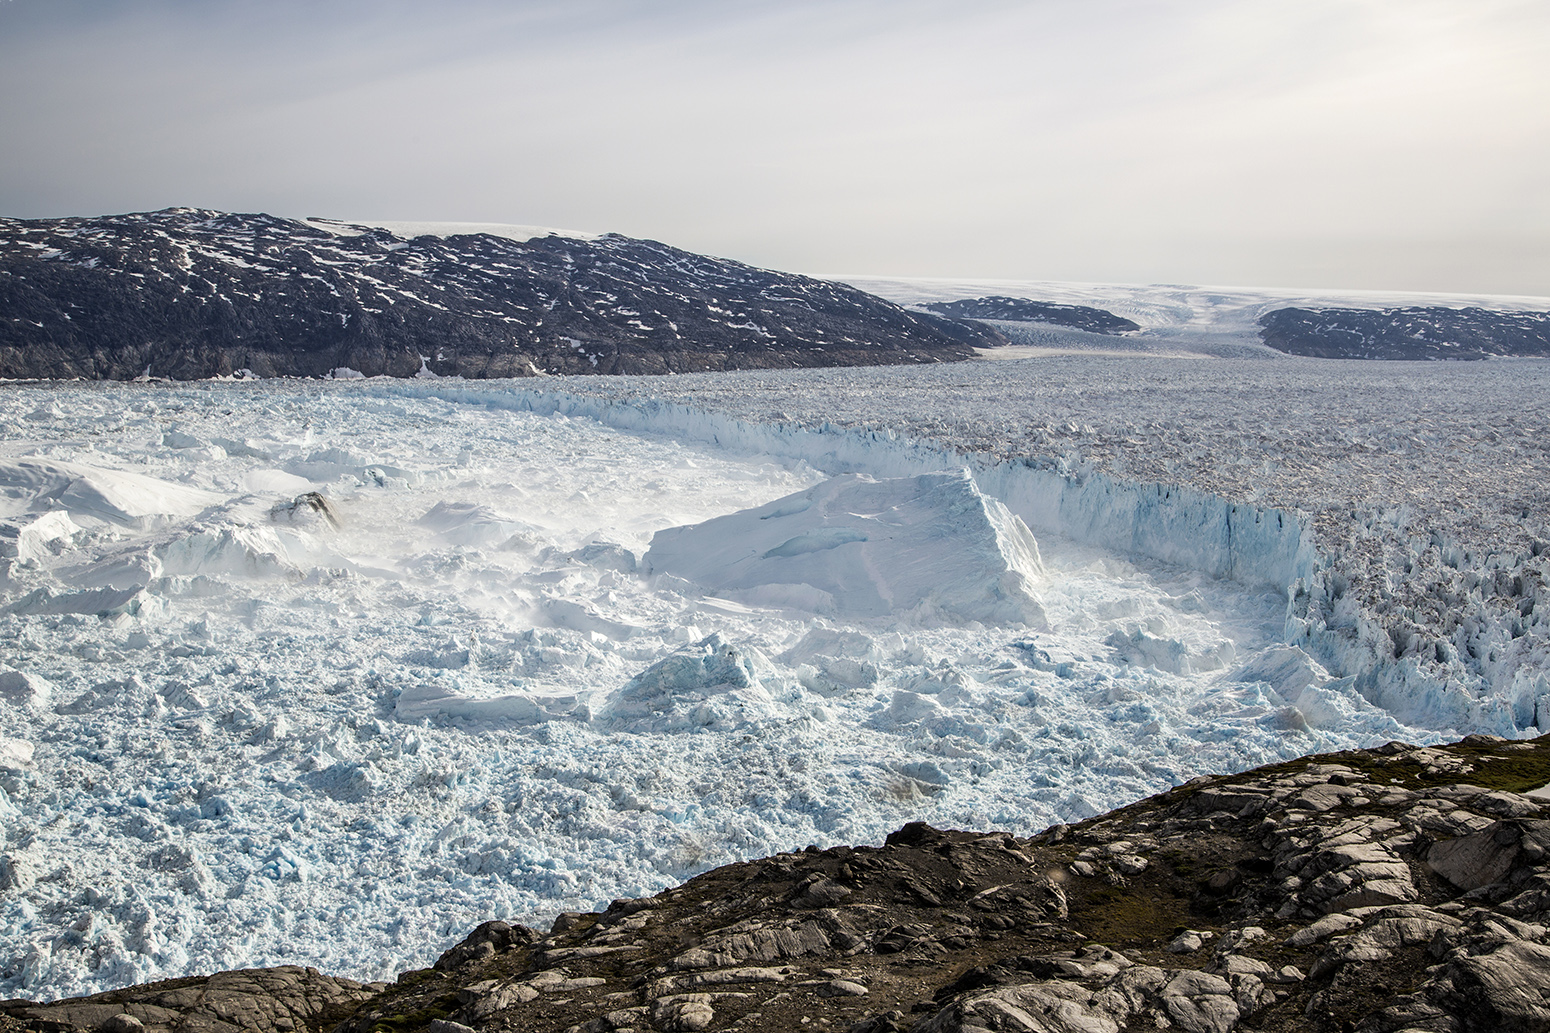
Helheim Glacier in Southeast Greenland. Credit: Nicolaj Krog Larsen, Aarhus University, Denmark.
Trimlines
So, how can photos be used to work out how much of Greenland’s ice sheet has melted?
You first have to go back to when the ice was growing and advancing. As glaciers inch across land and down valleys, they scrape away vegetation and rocks from their surroundings. When the glacier later melts and thins, it reveals an imprint of this erosion in what’s known as a “trimline”.
The animation below illustrates this process in action. It shows the retreat of the Kangerlussuaq glacier in eastern Greenland between 1900 and 2013, and the trimline that it left behind. The researchers know that the ice sheet and its glaciers were at their biggest for the last millennium around 1900, at the end of an extended period of cold conditions, referred to by some as the Little Ice Age.
Kangerlussuaq glacier. Credit: Kristian K. Kjeldsen, Natural History Museum of Denmark.Armed with aerial photos that reveal these trimlines, the researchers mapped the past and present sizes of the ice sheet in a 3D computer model. They then incorporated the recent satellite data to estimate how the ice sheet has changed through the 20th century.
Their results reveal not just how much ice Greenland has lost, but which areas are adding the most to sea levels.
Fast-flowing glaciers
Ice sheets gain mass by the accumulation of snowfall in the winter and lose it from surface melting during summer and the “calving” of icebergs that break off into the sea at their edges.
The maps below, from the new study, show the changes in surface elevation across Greenland back to 1900, according to these different processes. The middle row of maps shows the surface mass balance, with accumulation of snow in blue and melting of ice in red. The bottom row shows ice lost through calving at the edges of the sheet. The top row of maps is the overall change in ice mass – with the losses largely outweighing the gains.
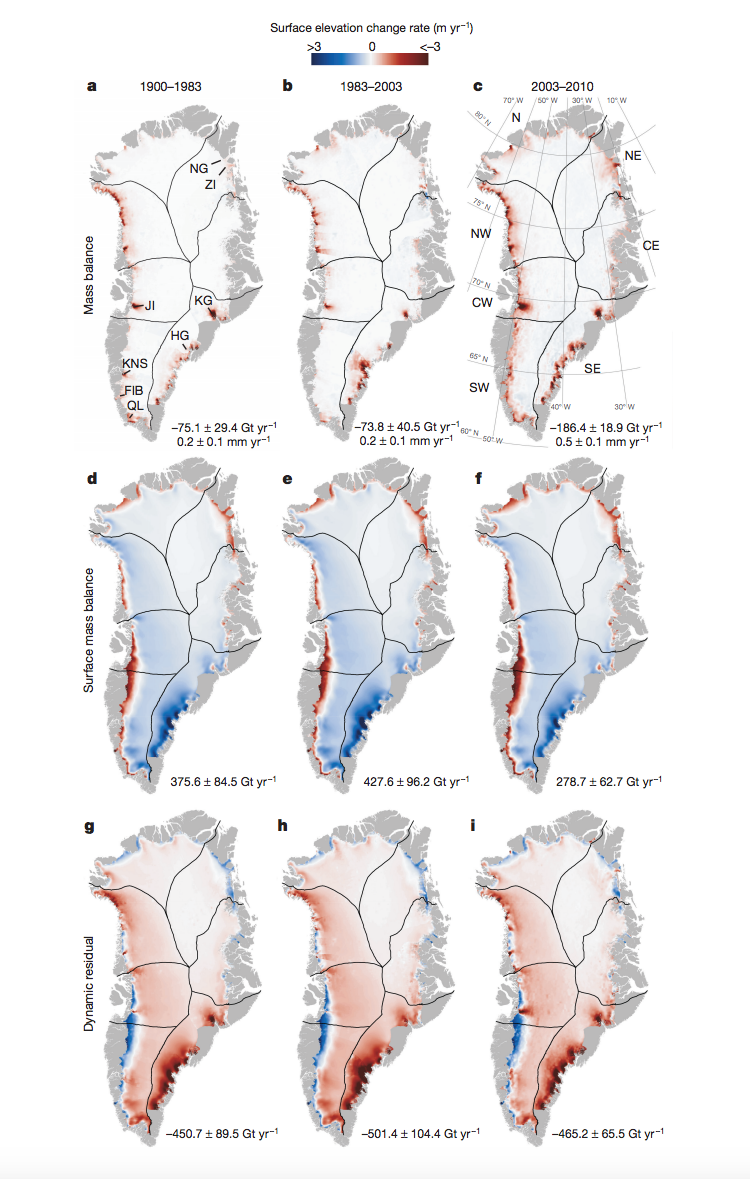
Surface elevation change rates in Greenland from 1900 to 1983 (left-hand maps), 1983-2003 (middle), and 2003-2010 (right-hand). Shading indicated gains (blue) and losses (red) of ice in metres per year. Maps show overall change in ice elevation (top row), surface mass balance (middle) and losses from calving (bottom). Figures below maps show change in ice mass in billions of tonnes per year for each process and time period.
The majority of this ice loss – between 52% and 83% – originates from southeastern and northwestern regions of the ice sheet, says lead author Dr Kristian Kjeldsen, also from the University of Copenhagen. He tells Carbon Brief:
The findings also show that the loss of ice from calving has remained more or less constant through the 20th century, says Dr Ruth Mottram, a climate scientist at the Danish Meteorological Institute who wasn’t involved in the study. She tells Carbon Brief:
Sea level rise
In total, Greenland’s ice sheet has lost around 9tn tonnes of ice between 1900 and 2010, the researchers say. This translates to adding around 25mm to global sea levels.
This is a “very credible result,” says Mottram:
Working out how Greenland has changed in the past will help scientists make robust estimates for the future, she adds:
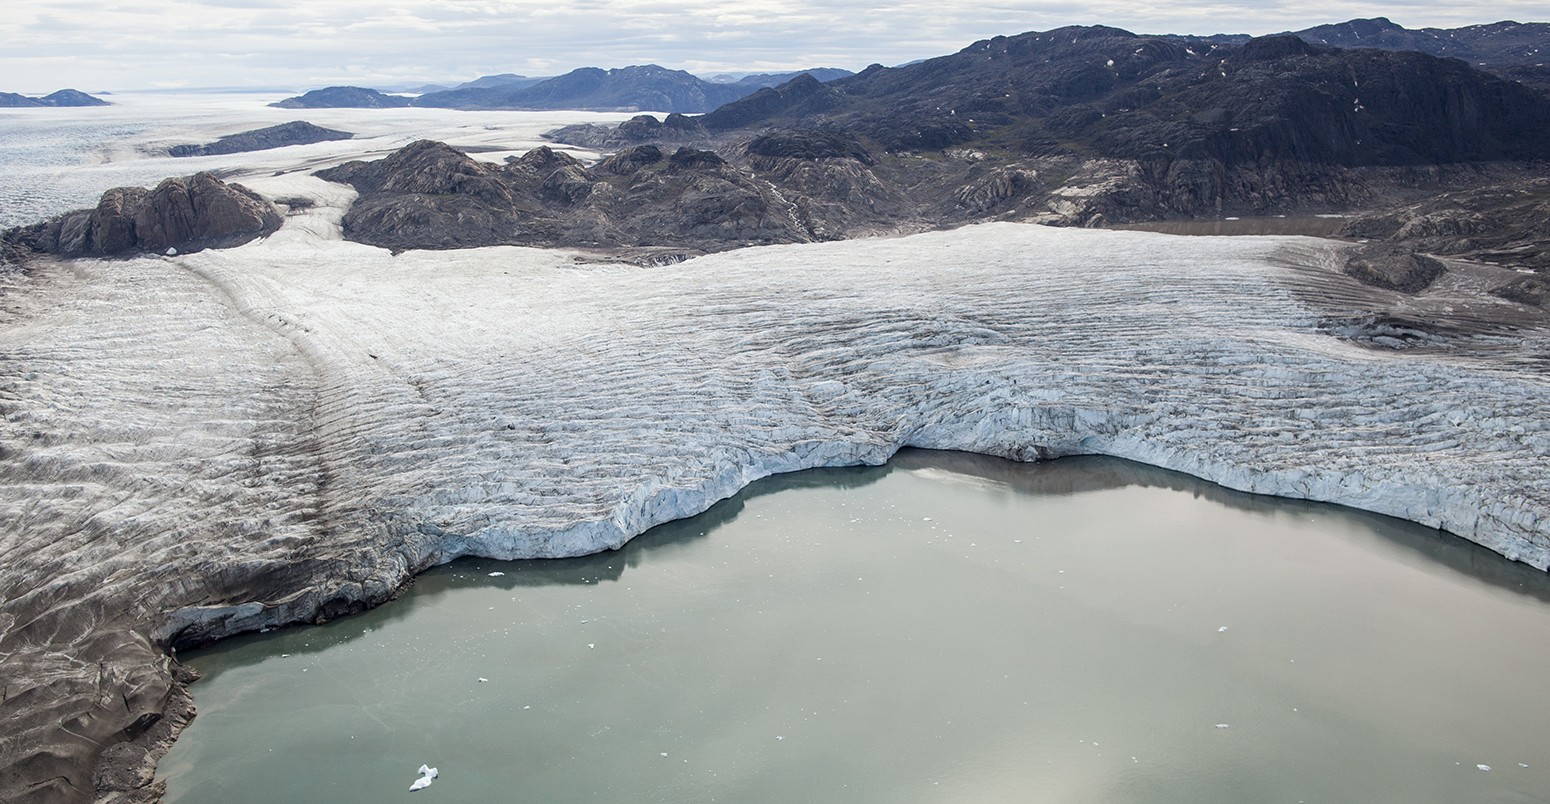
Main image: Upernavik Glacier in Northwest Greenland. Credit: Niels Jákup Korsgaard, Natural History Museum, Denmark.
Kjeldsen, K. K., Korsgaard, N. J. et al. (2015) Spatial and temporal distribution of mass loss from the Greenland Ice Sheet since AD1900, Nature, doi:10.1038/nature16183 & Csatha, B. M. (2015) A history of Greenland’s ice loss, Nature, doi:10.1038/528341a.