
This is a cross-post from the Climate Lab Book blog, written by Dr Ed Hawkins, associate professor in the Department of Meteorology at the University of Reading.
Imagine a ball bouncing down a bumpy hill. Gravity will ensure that the ball will head downwards. But, if the ball hits a bump at a certain angle it might move horizontally or even upwards for a time, before resuming its inevitable downward trajectory. This bouncing ball is an analogy for the behaviour of Arctic sea-ice.
Post based on Swart et al., Nature Climate Change
Arctic sea-ice melts in summer, reaching a minimum each September, before refreezing through the winter and a maximum extent in March. Over the past 35 years, the extent of September sea-ice has reduced by about 35% overall. But, this decline has not been smooth. The linear trend over the second half of this period is larger than over the first half, suggesting an acceleration, and in 2007 and 2012 the summer extent was dramatically lower.
Estimates of the volume of sea-ice suggest even larger reductions, although necessary historical observations of the thickness of sea-ice are less comprehensive and the uncertainties are greater than for extent. The CryoSat-2 and SMOS satellites are now measuring sea-ice thickness from space, but only during October-April because the presence of melt ponds on the ice in the melt season confuses the thickness retrieval. The available thickness data also shows year-to-year variations in the volume of Arctic sea-ice, similarly to the extent observations.
The extent minima of 2007 & 2012 caused much speculation in the media that we would soon see a summer which was ‘ice-free’ (this term is reserved for a year with less than 1 million km2 of sea-ice). However, other climate scientists were more cautious. Although a human influence on Arctic sea-ice has been detected, the weather in both 2007 and 2012 was particularly favourable for melting sea-ice, and there was no clear evidence that these weather patterns would continue each year.
In contrast, 2013 & 2014 had larger sea-ice extents than 2012, leading to some media speculation that there was a sea-ice recovery underway. Is this the case?
Back to the bouncing ball analogy – the hill represents the long-term downward trend in Arctic sea-ice due to increasing global temperatures and the bumps introduce changes from this smooth trajectory. These erratic bounces could be in either direction, causing an apparent acceleration or temporary reduction in melt rate.
Figure 1 shows the observed September Arctic sea-ice extent (black), a long-term linear decline (dashed black), and some deliberately chosen 8-year periods (colours). At various times there is no change, a sharp decline and apparent increases in extent, similarly to the ball bouncing erratically downhill.
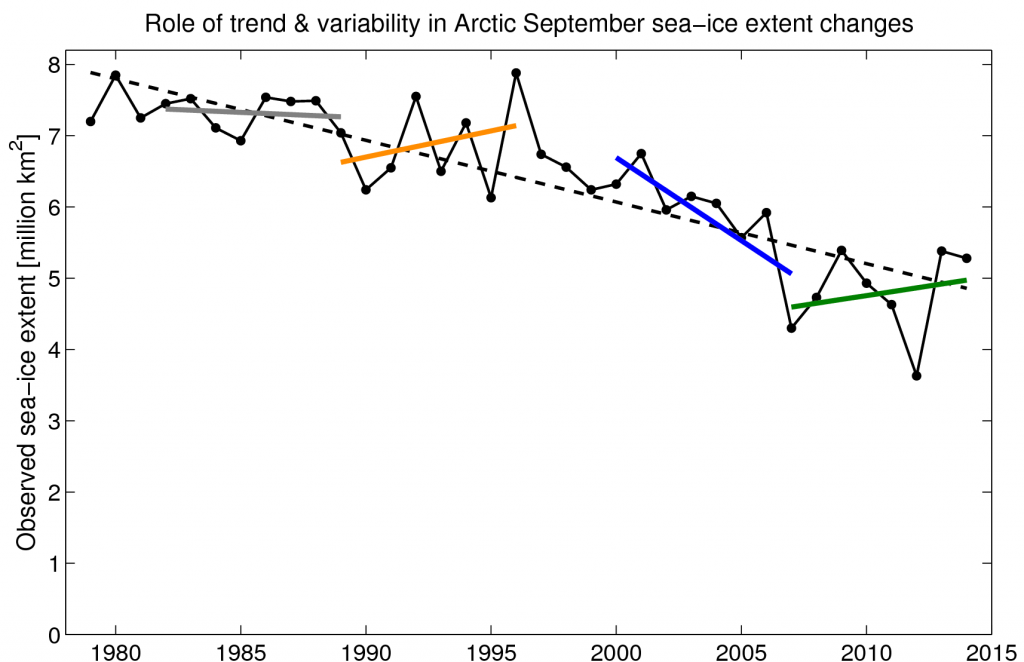
Figure 1: Observations (black) of Arctic sea-ice extent in September. The dashed black line represents the long-term linear trend and various deliberately chosen 8-year linear trends are shown in colours.
The most recent 8-year trend, starting from the extreme low of 2007, happens to show an upward trend. Does this mean the Arctic sea-ice is recovering? No – it is a bounce within a long-term downward trajectory. Similarly, the 2000-2007 trend could have been partly due to a bounce in the opposite direction. Kay et al. (2011) suggested that up to half of the sea-ice trend up to 2005 was due to natural variability, and Day et al. (2012) concluded that 5-30% of the recent trend could be due to variations in the Atlantic Ocean.
But what about the climate models? Stroeve et al. (2007) suggested that the CMIP3 global climate models (GCMs) were showing less dramatic reductions in sea-ice than the observations. The latest generation of GCMs (CMIP5) have some simulations which do reproduce the observed trend.
And, what do these GCMs say about the likelihood of the observed ‘bounces’ in Arctic sea-ice? Figure 2 shows the probability distribution of all 7-year trends from the CMIP5 historical simulations from 1979-2013. Short periods with no apparent sea-ice decline occur regularly in this period. Swart et al. demonstrate that periods of more than a decade with zero trend are not unusual and that they occur in the simulated future also.
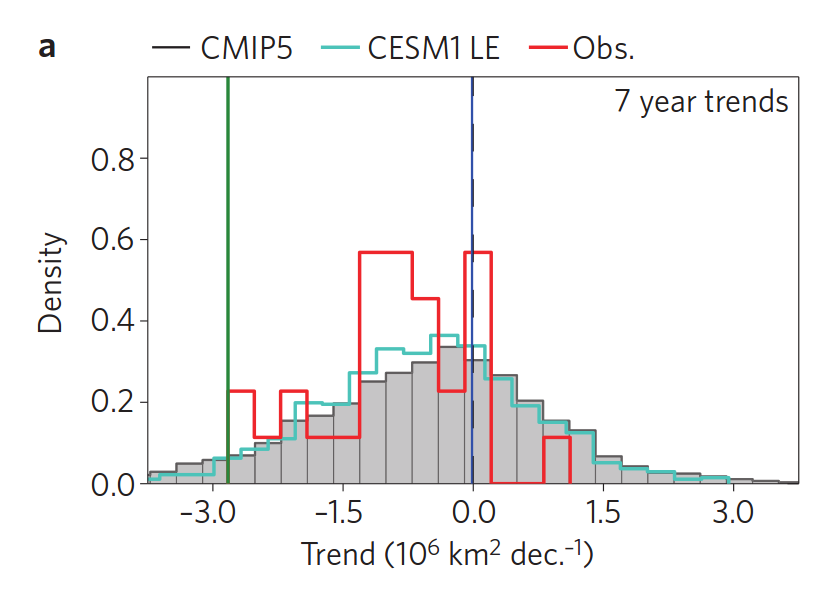 Figure 2: Distribution of 7-year linear trends in September Arctic sea-ice extent, for CMIP5 (grey), CESM Large Ensemble (cyan) and observations (red). The observed 2001-2007 and 2007-2013 trends are highlighted in green and blue respectively. Note that the Swart et al. analysis was done before the 2014 minimum so the paper uses 7-year trends and examines 2007-2013 and 2001-2007 as the two extreme cases.
The analysis was also repeated with a large (30 member) ensemble of simulations with the CESM GCM. In this case, the difference between the simulations is solely due to the experienced weather which varies from case to case. Interestingly, the range of trends seen in this single model is very similar to the entire range of CMIP5 GCMs, suggesting that a large fraction of this range is due to internal climate variability and not due to differences between the GCMs themselves.
When will the ball reach the bottom of the hill? The IPCC AR5 took the unusual step of only using five GCMs for its overall assessment of future Arctic sea-ice because many of the simulations were not deemed adequate. The IPCC concluded that it was likely that the Arctic would be reliably ice-free in September by 2050 (where ‘reliably ice-free’ means 5 consecutive years with less than 1 million km2 of sea-ice), assuming high future emissions.
The expected outcome is that the long-term decline in Arctic sea-ice will continue as global temperatures increase. There will be further bounces, both up and down. Individual years will become ice-free sometime in the 2020s, 2030s or 2040s, depending on future greenhouse gas emissions and the natural variations. But, even at the bottom of the hill the ball will continue to bounce – not every year will have zero ice in summer. The bounces will become smaller if global temperatures continue to increase, and other summer and autumn months will also become ice-free. However, in future scenarios with sharp reductions in greenhouse emissions, the Arctic sea-ice recovers slightly as global temperatures decline.
Main image: Frozen sea.
Thanks to Richard Betts who I first saw use the bouncing ball analogy for climate.