Arctic sea ice winter peak in 2021 is joint-seventh lowest on record
Ayesha Tandon
03.31.21Ayesha Tandon
31.03.2021 | 2:44pmArctic sea ice has reached its maximum extent for the year, peaking at 14.77m square kilometres (km2) on 21 March. This is the joint-seventh smallest winter peak – tied with 2007 – in a satellite record that spans more than four decades.
The provisional estimate from the National Snow and Ice Data Center (NSIDC) in Colorado shows that this year’s winter maximum extent is 870,000km2 smaller than the 1981-2010 average.
The NSIDC describes this year’s milestone as an “uneventful maximum”, but notes that it follows an “exceptional” year for sea ice. The Arctic’s summer minimum in September 2020 was the second lowest on record and the unusually slow rate of sea ice regrowth that followed led to record-breaking low levels of Arctic ice cover in October.
Meanwhile, at the Earth’s other pole, the Antarctic sea ice minimum clocked in at 2.83m km2 on 21 February – the 12th lowest in the satellite record.
‘Uneventful maximum’
Arctic sea ice extent changes throughout the year – growing during the winter before reaching its peak for the year in February or March, and then melting throughout the spring and summer towards its annual minimum, typically in September.
Scientists use satellite data to track the growth and melt of sea ice. This allows them to pinpoint the day that the ice hits its winter maximum extent and to record the size. This – along with the late-summer minimum – is one of the key metrics for tracking the “health” of the Arctic’s sea ice.
The plot below shows Arctic sea ice extent over this winter (blue line) compared to 2011-12 (green dashed) – 2012 being the year that saw the record low summer minimum – and the 1981-2010 average (grey). Arctic sea ice extent is measured as the area of the ocean that has at least 15% sea ice coverage.
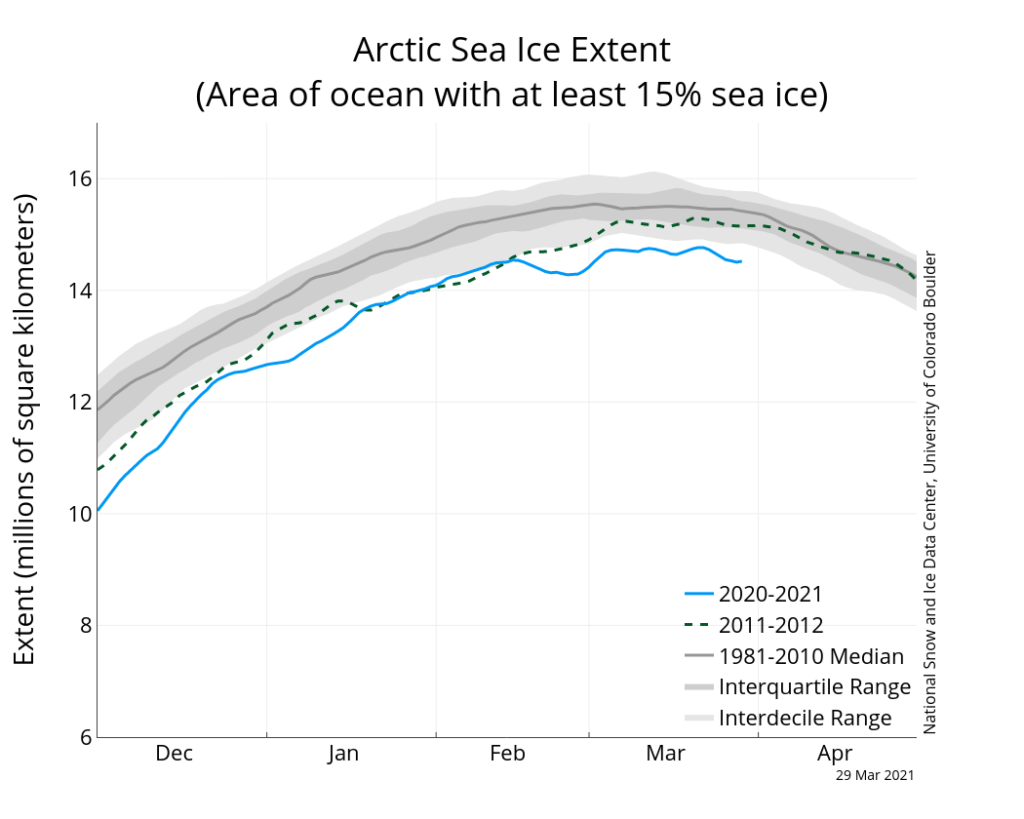
This year, early indications suggest that Arctic sea ice reached its annual maximum of 14.77km2 on 21 March – the joint-seventh lowest Arctic maximum on record.
This was an “uneventful maximum”, the NSIDC says, noting that it is 870,000km2 below the 1981-2010 average maximum and 360,000km2 above the lowest maximum, which was recorded in 2017.
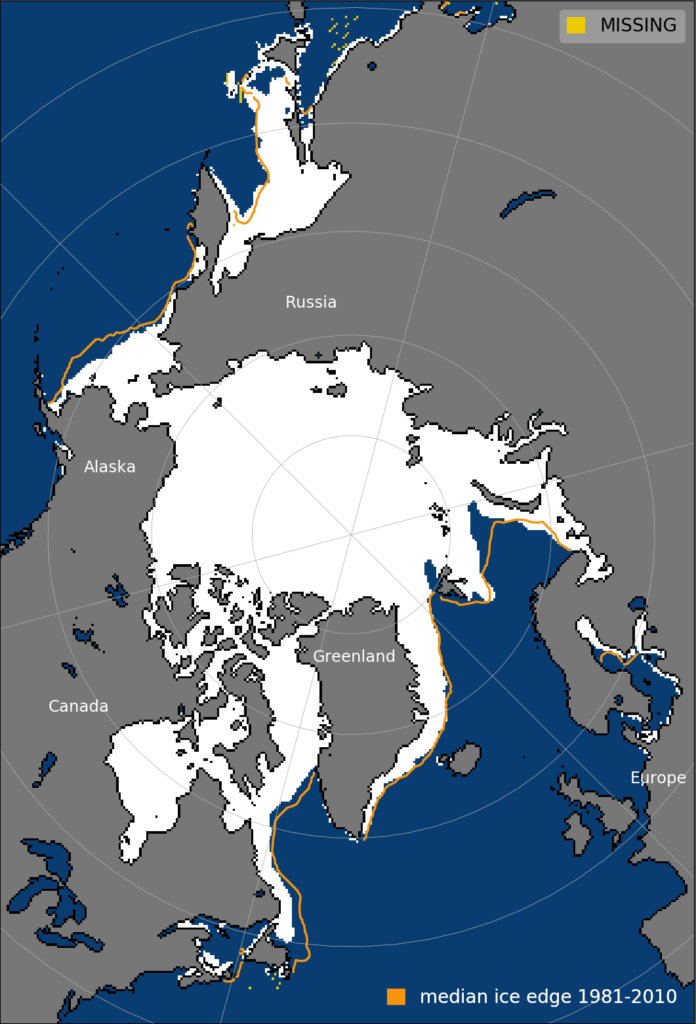
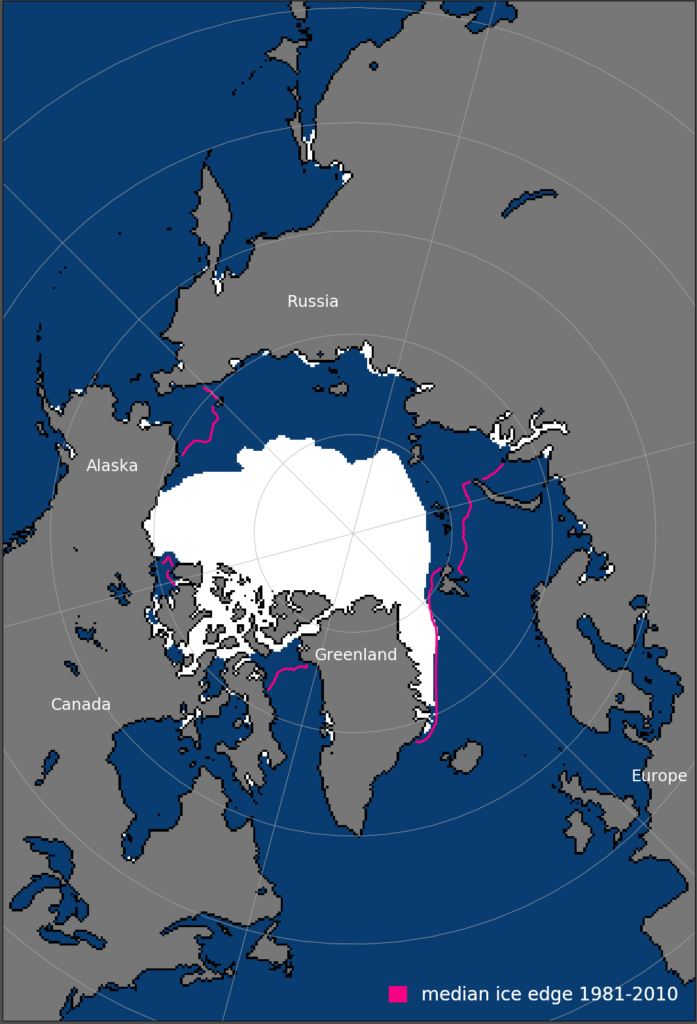
The image below shows sea ice extent on 21 March 2021 compared to the 1981-2010 average extent for that day – shown by the orange line.
“The sea ice maximum this year is not close to a record, but still quite low compared to any year prior to 2000,” explains Dr Ted Scambos, senior research scientist at NSIDC and lead scientist for their science team.
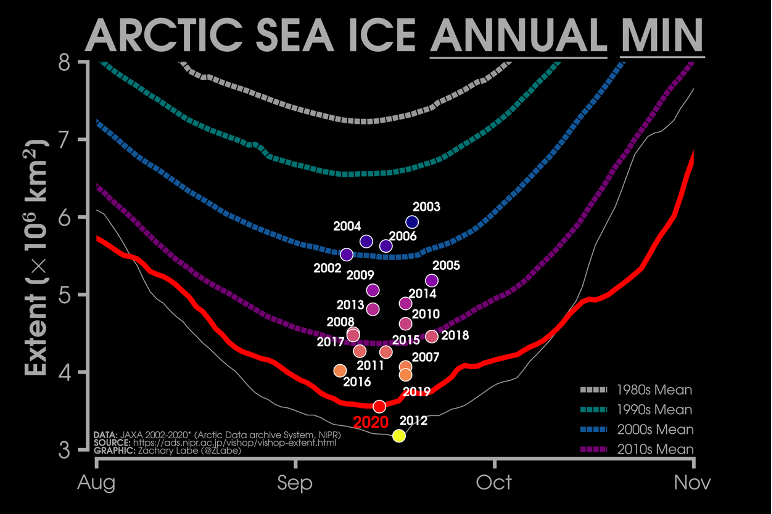
The graphic below – by Dr Zack Labe, a postdoctoral researcher at Colorado State University – shows the sea ice extent of every Arctic sea ice maximum since 1979. The red line shows the 2021 level.
“There is very little correlation between winter Arctic sea ice extent and the September annual minimum,” Labe tells Carbon Brief.
“We know that sea ice has this ability to recover following anomalously low minima, the same happened in 2008 and 2013,” adds Dr Isobel Lawrence – a research fellow at the Centre for Polar Observation and Monitoring at the University of Leeds. She tells Carbon Brief:
“It is because the extra heat that gets absorbed by the exposed ocean in the summer is released quickly in the autumn and winter, leading to rapid ice growth. It is a negative feedback mechanism which allows the ice pack to recover after extreme summer melt events.”
According to the NSIDC, the date of this year’s maximum falls nine days later than the 1981-2010 average date of 12 March.
An ‘exceptional’ year for sea ice
This year’s sea ice growth season kicked off with the second-lowest Arctic sea ice minimum on record – second only to 2012. The minimum was recorded on 15 September, when sea ice cover reached a minimum of 3.74m km2.
According to the NSIDC, this exceptionally low minimum sea ice extent was partly due to the strong positive phase of the Arctic Oscillation at the time, which caused wind patterns to transport ice from the Siberian coast, across the pole and out of the Arctic Ocean. This leaves thinner ice along the Siberian coast which is more prone to melting.
The 2020 sea ice minimum (red line) is shown in the chart below. Decadal average sea ice extents for preceding decades are shown by the dashed lines, while the dates and sea ice extents of the sea ice minimum in past years is shown by the coloured circles.
Arctic sea ice growth following the September minimum was “one of the slowest on record”, according to Labe. A record difference in Arctic sea ice extent compared to the 1981-2010 average was recorded on 24 October. Labe tells Carbon Brief that further sea ice records were broken that month:
“October 2020 sea ice extent and volume were both the lowest on record. At one point in mid October, satellites observed the largest Arctic sea ice anomaly ever recorded. The massive areas of open water in late fall contributed to anomalous warmth going into November across the Arctic, especially near the Siberian coast.”
The image below shows sea ice extent in October 2020 compared to the 1981-2010 average extent for that October – shown by the pink line.
“From 13 October into early November, the daily sea ice extent was the lowest for that day in the satellite record”, according to the NSIDC. The low sea ice extent left vast expanses of open water across the Arctic throughout November, which lost heat to the atmosphere and caused hotspots to form near the surface of the ocean.
The NSIDC adds that the near-surface air temperatures around these hotspots were locally more than 12C above the long-term November average. Meanwhile, air temperatures for November 2020 were above average over much of the Arctic Ocean – 4-6C above average over the Beaufort and Chukchi Seas, the northern Barents Sea, and the Laptev Sea.
Following the pattern of previous years, sea ice growth picked up in the final week of October. In fact, the NSIDC says that November 2020 recorded the fastest average daily growth rate on record, with particularly rapid growth in the first week when the upper ocean lost its remaining summer heat back to the atmosphere.
However, due to the exceptionally low levels of sea ice earlier in the year, the NSIDC says that both total November sea ice extent and daily sea ice extent in early December still clocked in as the second lowest on record.
In December, the Arctic Oscillation flipped from a strong positive mode to a negative mode, according to the NSIDC. The Arctic Oscillation describes how air pressure patterns are distributed over the Arctic region and the mid-latitudes of the northern hemisphere. According to NSIDC director Prof Mark Serreze, an expert on Arctic climate and weather:
“When the Arctic Oscillation flips from one mode to another, that represents a fundamental change in the circulation of the atmosphere, the way the winds blows.”
NSIDC scientist Dr Walt Meier adds:
“When the AO is in positive mode, the polar vortex is generally a neat, tight circle, with cold air and contemptible winter storms sent into timeout far away from civilisation. When the AO is in negative mode, the vortex is wavier, and unruly weather can run amok, setting snowfall records.”
This caused high pressure to develop over the Arctic Ocean, with a fairly strong “Beaufort Sea High” air pressure pattern – a high-pressure centre over the Beaufort Sea that is present mainly in winter. It also caused low pressure to form over the Atlantic and Pacific subarctic.
This pressure difference drove wind patterns that help to retain older and thicker ice in regions of the Arctic, says Prof Julienne Stroeve, a professor of polar observation and modelling at University College London and senior research scientist at the NSIDC. She tells Carbon Brief :
“The anomalously high pressure over the Beaufort Sea during part of the winter essentially reduced ice transport out of Fram Strait [the passage between Greenland and Svalbard] and helped to thicken ice in the Canadian sector.”
At the end of the year, the average Arctic sea ice extent for December 2020 was the third lowest in satellite record. “The Arctic climate was extraordinary in 2020, but the year ended with a less spectacular December,” the NSIDC says.
New year
Sea ice patterns have been somewhat less notable this year than last year. While sea ice extent tracked below average throughout January, by the middle of the month, extent rose above the 2011-2020 average, the NSIDC says. Overall, January 2021 clocked in at the sixth lowest January on record for sea ice extent.
While air temperatures were well above average on the Atlantic side of the Arctic in January, they were below average over Siberia, the NSIDC notes. Furthermore, there was a sudden stratospheric warming event early in the year which caused a weakening of the polar vortex, Labe tells Carbon Brief: (See Carbon Brief’s explainer for more details.)
“One interesting research question going forward is how the weakening of the polar vortex – following a sudden stratospheric warming event – in January may have influenced Arctic sea ice. While the polar vortex is located high in the atmosphere, it is indirectly connected to weather patterns closer to the surface that influence Arctic sea ice motion.”
February saw “an exceptionally strong clockwise Beaufort Gyre sea ice circulation”, consistent with the negative phase of the Arctic Oscillation, according to the NSIDC. This type of circulation pattern is sometimes associated with a wavy jet stream, it adds, and could have contributed to an outbreak of cold air in lower latitudes linked to the “deep freeze” in Texas.
The animation below shows how sea ice extent in early 2021 compares to 2007, 2012 and 2020. The year 2021 is shown by the moving yellow line, along with 2007 (pink), 2012 (white) and 2020 (blue). The stationary lines show decadal averages for the past four decades.
This year is in line with the expected trend, and “a good example of how year-to-year variability influences Arctic sea ice extent, despite the overall long-term declining trend”, Labe tells Carbon Brief.
Antarctica
While Arctic sea ice extent increases towards its annual minimum at the end of winter, the Antarctic follows the opposite pattern, decreasing to its annual minimum around the same time. This year, the Antarctic sea ice minimum clocked in at 2.83m km2 on 21 February, making it the 12th lowest in the satellite record.
When the Antarctic minimum sea ice occurred this year, the NSIDC was experiencing a data gap. According to the website, this was due to “a data loss by our source of passive microwave sensor data used to derive our concentration and extent estimates”. The sea ice extent for 20-21 February is based on interpolation from the surrounding days.
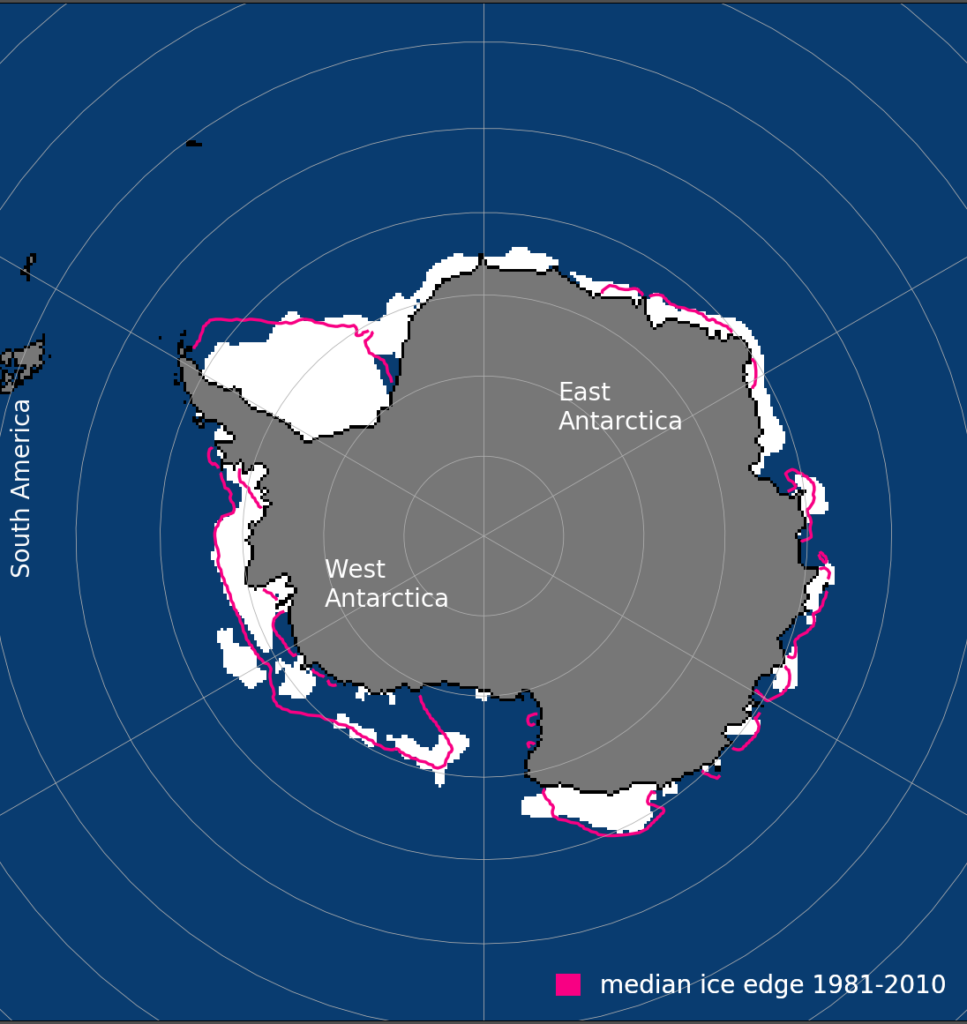
The image below shows the minimum Antarctic sea ice extent for the year, with the 1981-2010 average shown in pink. Below-average extents were present in the northern Weddell and eastern Ross Seas, while the Bellingshausen Sea and the Wilkes Land Coast were near average.
The NSIDC notes that this year’s Antarctic maximum is “far from the record low extent”, which was recorded in 2017.
Similarly, while Arctic sea ice grows throughout the new year towards its maximum extent, sea ice in the Antarctic declines. Last year, the maximum sea ice in the Antarctic was recorded on 28 September – the 11th highest in the satellite record.