Arctic sea ice winter peak in 2023 is fifth lowest on record
Arctic sea ice has reached its maximum extent for the year, peaking at 14.62m square kilometres (km2) on 6 March. It is the fifth smallest winter peak in the 45-year satellite record.
The provisional data from the National Snow and Ice Data Centre (NSIDC) shows that this year’s Arctic maximum extent was 1.03m km2 below the 1981-2010 average maximum.
While the past six months have been fairly uneventful in the Arctic, the Earth’s other pole has seen a record-breaking melt season.
Antarctic sea ice extent reached a new record low minimum of 1.79m km2 on 21 February, setting the record for a second straight year.
“For several months this year, global sea ice extent – Arctic plus Antarctic – has been at a record low,” one expert tells Carbon Brief.
Arctic winter peak
Arctic sea ice extent changes throughout the year – growing during the winter before reaching its peak for the year in February or March, and then melting throughout the spring and summer towards its annual minimum, typically around September.
Using satellite data, scientists can track the growth and melt of sea ice, allowing them to determine the size of the ice sheet’s winter maximum extent and to record the size. This – along with the late-summer minimum – is a key way to monitor the “health” of the Arctic sea ice.
The NSIDC’s announcement says that this year’s Arctic maximum extent of 14.62m is 1.03m km2 below the 1981-to-2010 average maximum extent – ranking as the fifth lowest in the satellite record. It adds that the date of the maximum this year, 6 March, was six days earlier than the 1981-to-2010 average date of 12 March.
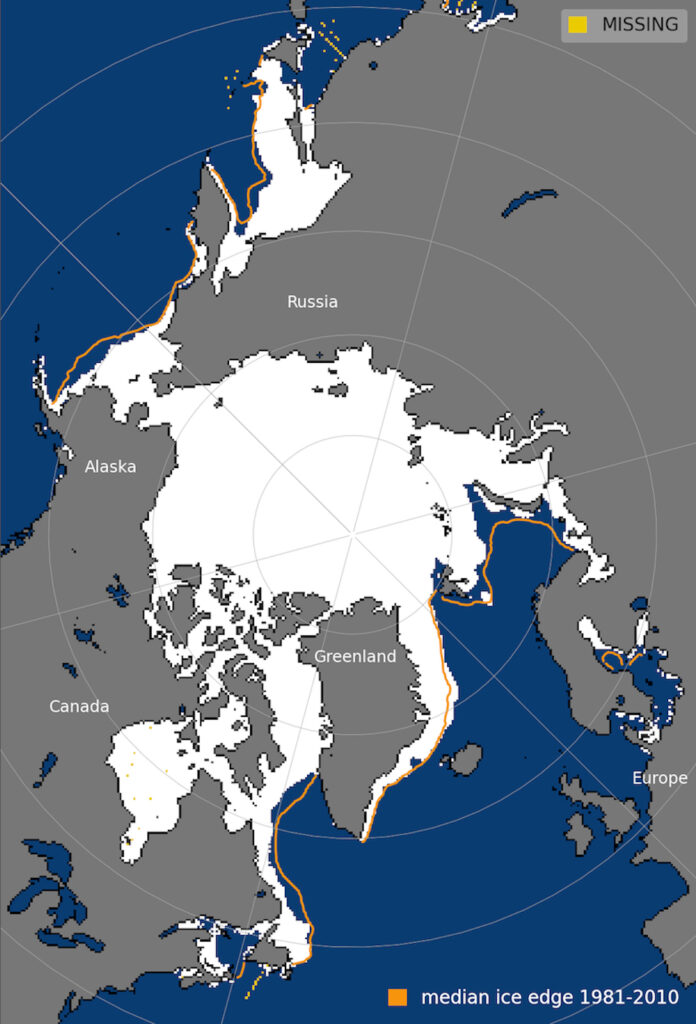
The plot below shows Arctic sea ice extent on 7 March, with the median sea ice extent for 1981-2010 shown by the orange line. (The 7 March image is being used due to missing data on the prior day’s map.)
This Arctic maximum is “another data point adding to our understanding of a dramatically changing place”, Dr Zack Labe – a postdoctoral researcher working at NOAA Geophysical Fluid Dynamics Laboratory and the Atmospheric and Oceanic Sciences Program at Princeton University – tells Carbon Brief.
He says:
“These effects are clearly linked to human-caused climate change and have major implications regionally across the Arctic.”
Dr Mark Serreze, director of the NSIDC, tells Carbon Brief that “for several months this year, global sea ice extent – Arctic plus Antarctic – has been at a record low”.
Freeze season
Looking back, Arctic sea ice extent reached its minimum extent for 2022 on 18 September, ranking as the joint 10th lowest minimum in a satellite record stretching back 45 years.
The start of October saw Arctic sea ice extent increase at a “below average rate”, according to the NSIDC. The East Siberian Sea was among the first regions to freeze up, while open sea persisted “for some time” in the Laptev sea.
However, in the last 10 days of month, the Laptev iced over and “ice extent rapidly increased”.
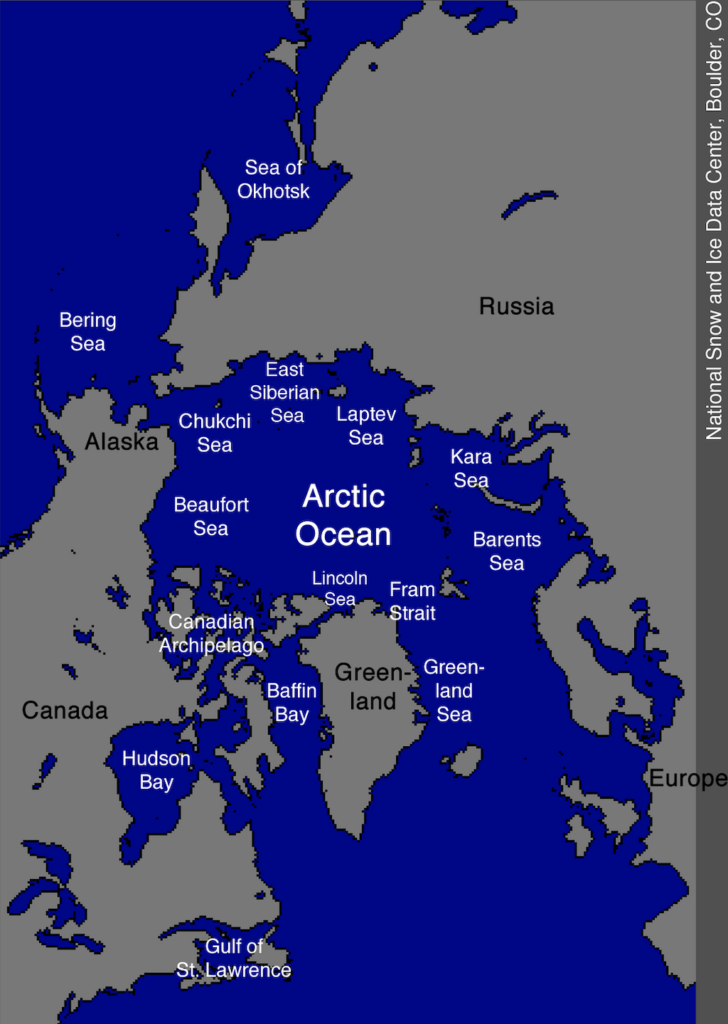
The map below shows the regional seas that make up the Arctic Ocean.
The NSIDC suggests that “the delayed freeze up in the Laptev Sea could be partly a result of ocean heating from the extended period of open water this past spring and summer”. Overall, October 2022 average Arctic sea ice extent was 6.61m km2 – the eighth lowest in the satellite record for the month.
November saw “near-average” Arctic sea ice growth – with fast growth in the first week balanced by slower growth over the rest of the month. Over northern Yukon and north-eastern Alaska regions, temperatures were about 4C above average.
However, the Siberian side of the Arctic experienced temperatures of 1-3C below average.
December saw similarly variable sea ice growth – with faster-than-average growth at the start of the month, which slowed as the month progressed, before picking up again later, according to the NSIDC. It adds:
“Over the last week of the month, ice growth was very slow, and – as a result – total extent at the end of December stood at fourth lowest in the satellite record.”
By the end of the month, the Hudson Bay – the inland sea indenting east-central Canada – was “almost completely iced over”, while in the Barents Sea, sea ice was “notably north of its average location”.
The new year brought temperatures of more than 6C above average near the Norwegian archipelago of Svalbard, the NSIDC says.
Labe tells Carbon Brief that differences in atmospheric pressure over the Arctic were, in part, responsible for the high temperatures:
“Much of this winter has been influenced by areas of low pressure across the Atlantic side of the Arctic Ocean, while higher pressure has been found closer to Siberia and the Central Arctic. This contributed to a weather pattern that favoured southerly winds bringing warm and moist air into the Arctic through the Barents Sea around Svalbard.
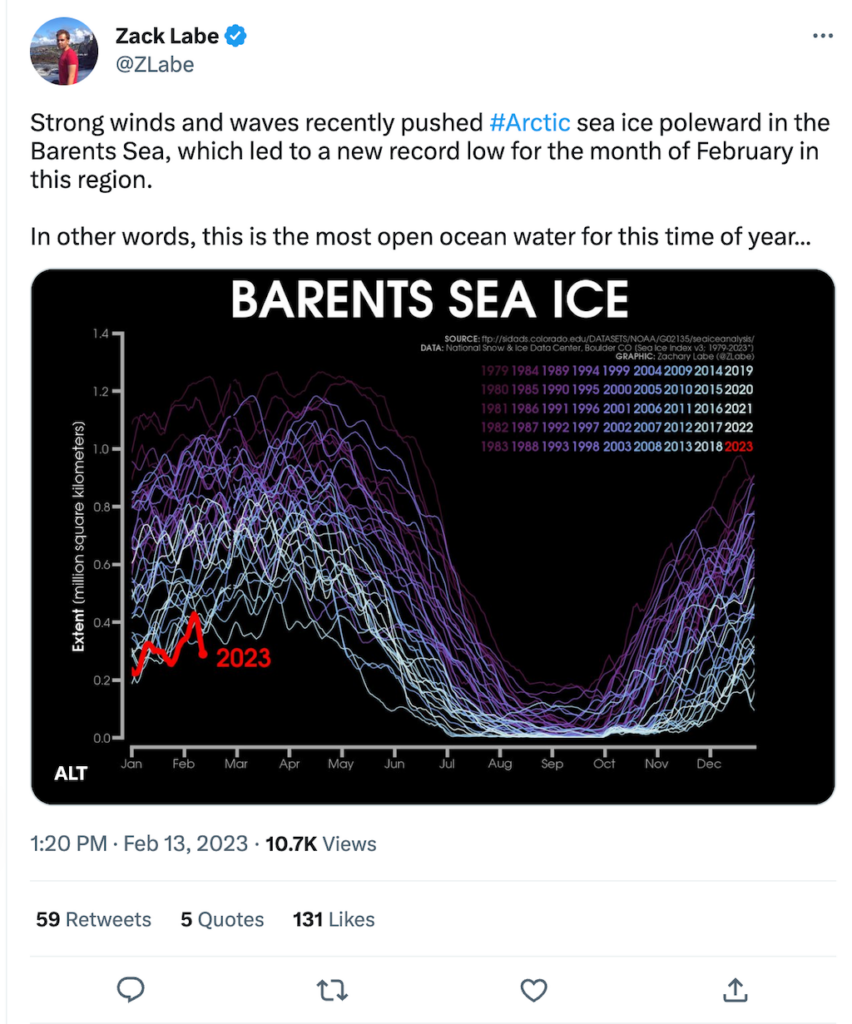
“This southerly flow, associated with high winds and waves from increased storm activity, then acted to push the sea ice poleward. This left behind wide areas of open ocean waters in locations that were normally sea-ice covered only a few decades ago.”
Serreze tells Carbon Brief that low sea ice extent in the Barents Sea region has been “a persistent feature of recent winter”. He says this “points to ocean effects – the warm Atlantic water that flows into the Arctic having a bigger effect on the winter ice cover than it used to”.
By the end of January, Arctic sea ice extent was the third lowest in the satellite record for the month, at 13.35m km2, the NSIDC says.
During February, the Arctic Oscillation was in a “strongly positive phase”, causing “unusually low sea level pressure over Svalbard, coupled with high pressure over the central Arctic Ocean and Siberia”, the NSIDC says. (The Arctic Oscillation describes how air pressure patterns are distributed over the Arctic region and the mid-latitudes of the northern hemisphere.)
Meanwhile, a sudden stratospheric warming (SSW) event drove sea ice growth across the Arctic.
Labe tells Carbon Brief that SSW events involve “a dramatic weakening of the polar vortex that sits high in the stratosphere”, but that they can also impact weather closer to the ground.
He adds that “some studies have quantified indirect links to regional sea ice anomalies in summer from SSW that occurred earlier in the winter”.
(For more on SSW events and the polar vortex, see Carbon Brief’s explainer.)
In the final full month before the winter peak, the February 2023 average Arctic sea ice extent was 14.18m km2 – the third lowest February in the satellite record – tracking at 1.12m km2 below the 1981-2010 average.
Antarctic record
The Antarctic has seen a more eventful year than its northern counterpart. Back in February 2022, Antarctica made headlines around the world when its sea ice extent dropped below 2m km2 for the first time in a satellite record that goes back to the late 1970s.
Antarctic sea ice continued to track well below average during its growth season, but saw a “spurt of growth” around September, according to the NSIDC. On 16 September, the Antarctic reached its annual maximum at 18.19 km2 – the fourth lowest maximum in the satellite record.
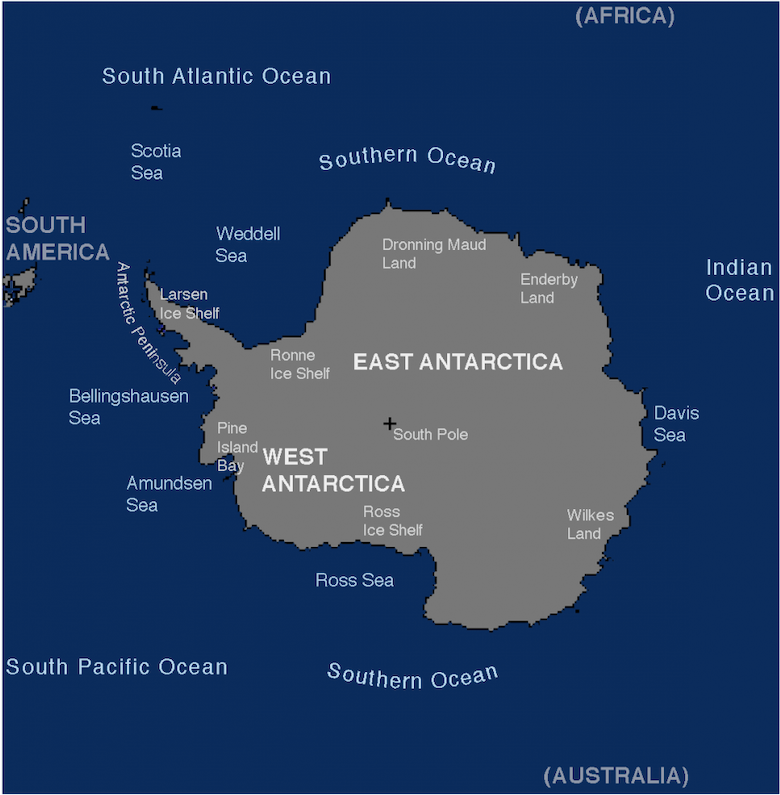
The map below shows the oceans and regional seas around Antarctica.
Through October, sea ice extent was “far below average” in the Bellingshausen Sea, along the west side of the Antarctic Peninsula, says the NSIDC. In contrast, extent was “far above average” in the Amundsen Sea, off West Antarctica, and the eastern Ross Sea, the deep bay that forms the southernmost part of the Southern Ocean.
This pattern is indicative of a strong “Amundsen Sea Low” – a low pressure centre off the coast of West Antarctica – according to the NSIDC.
Over November, seasonal warming drove a rapid decline in sea ice extent. The NSIDC explains the sea level pressure pattern over the area:
“A strong low over much of the Amundsen Sea and eastern Ross Sea has driven a clockwise air circulation that has brought warm air from the north onto the western Peninsula region, and cold air from the continental ice sheet northward in the Amundsen Sea.”
This caused a “somewhat unusual sea ice distribution”, in which the eastern portion of the Bellingshausen Sea was ice free for much of November, while ice extent in the Amundsen Sea – just west of the Bellingshausen – extended “much farther to the north than is typical”.
The new year saw Antarctic sea ice extent drop to record lows, the NSIDC says:
“The January 2023 average Antarctic extent of 3.23m km2 is the lowest January extent in the satellite record, below the previous January record low of 3.78m km2 set in 2017.”
A positive Southern Annular Mode – a pattern of air pressure that determines the wind circulation in the high southern latitudes – led to stronger-than-average westerly winds, which brought warm air to both sides of the Antarctic peninsula, the NSIDC says. By 13 February, Antarctic sea ice extent had dropped below 2m km2 for only the second time in the satellite record.
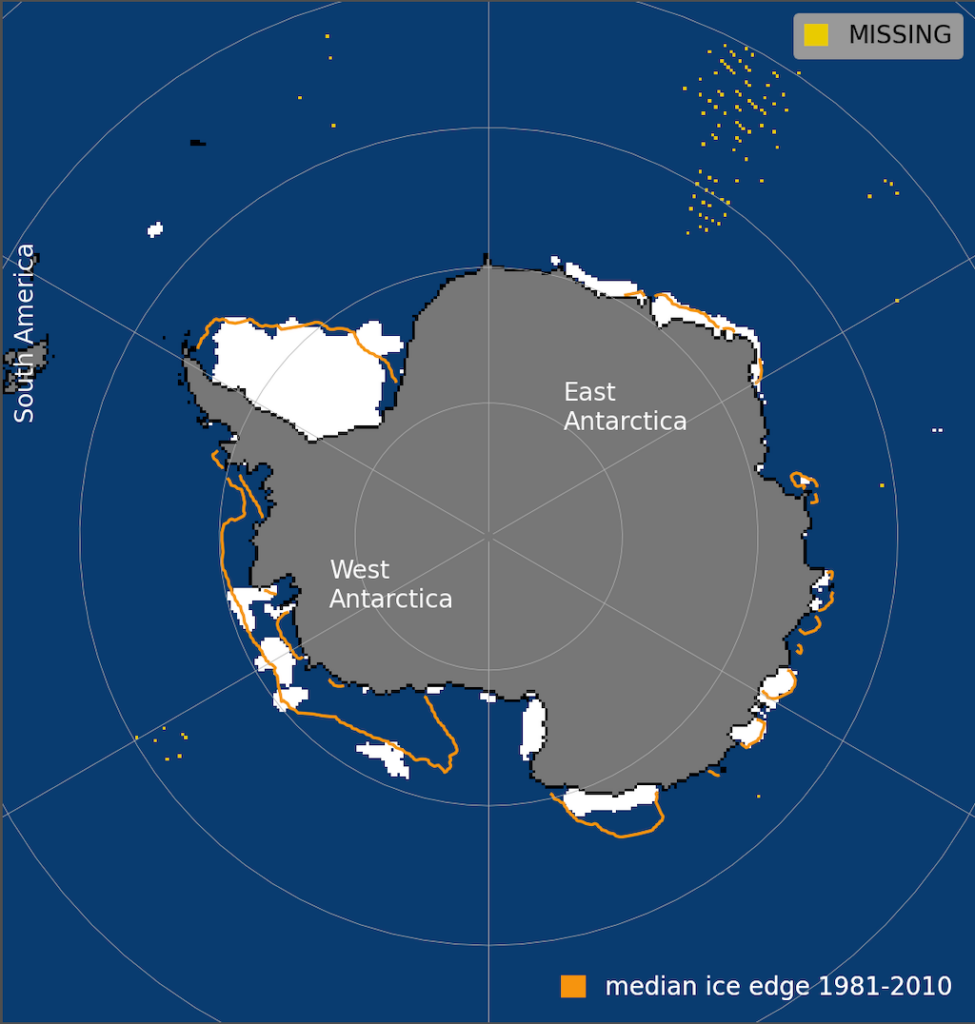
On 21 February, the Antarctic reached a new record low minimum of 1.79m km2 – setting the record for a second straight year. The minimum was 1.05m km2 below the 1981-2010 average Antarctic minimum extent and 136,000 km2 below the previous year’s record.
The map below shows Antarctic sea ice extent on 21 February 2023. The orange line shows the 1981-2010 average extent for that day.
This year’s record low Antarctic sea ice extent was covered widely in outlets including BBC News, the Guardian, the Independent, CNN and the Washington Post.
🚨 It's official —> "Antarctic sea ice recently reached its late-summer minimum, dropping below all previous minimum ice extents in the satellite record… reaching a minimum extent of 1.92 million square kilometers on 2/25/2022."
— Zack Labe (@ZLabe) March 9, 2022
See more from @NSIDC: https://t.co/ooLs7ofBgy pic.twitter.com/wcUVc4aivw
The NSIDC says of the Antarctic sea ice record:
“In recent years, 2017 and 2018 also reached very low extents, third and fourth lowest, respectively. With this series of low years, it is natural to speculate if there is now a downward trend. However, a trend computed over such a short time period is not especially meaningful. Note in this respect that 2013 through 2015 saw near record high minimum extents.”
Serreze tells Carbon Brief that Antarctic sea ice extent is “extremely variable, so it’s not sure how much we should read into this record low global sea ice extent”. (For more on the rise and fall of Antarctic sea ice, see Carbon Brief’s guest post from 2021.)
Since its record low extent, Antarctic sea ice extent has begun to grow – although it is still tracking at “record lows” for the time of year, the NSIDC says.