CO2 emissions from wildfires have fallen over past 80 years, study finds
Daisy Dunne
04.17.18Daisy Dunne
17.04.2018 | 4:00pmThe annual amount of CO2 emitted as a result of wildfires has fallen over the past 80 years, a new study finds.
The research finds that, over the past few decades, large areas of forest and savannah have been converted to cropland, meaning that the overall area that could be burned by wildfires has decreased.
However, this drop in wildfire emissions has not led to a large net drop in CO2 emissions from land use, the lead author tells Carbon Brief. This is because a rise in emissions from deforestation for cropland largely counteracted the decline in wildfire emissions over the past century.
The new research is “innovative”, but may overlook some factors, such as how wildfire severity has changed over time, other scientists tell Carbon Brief.
Feeling the burn
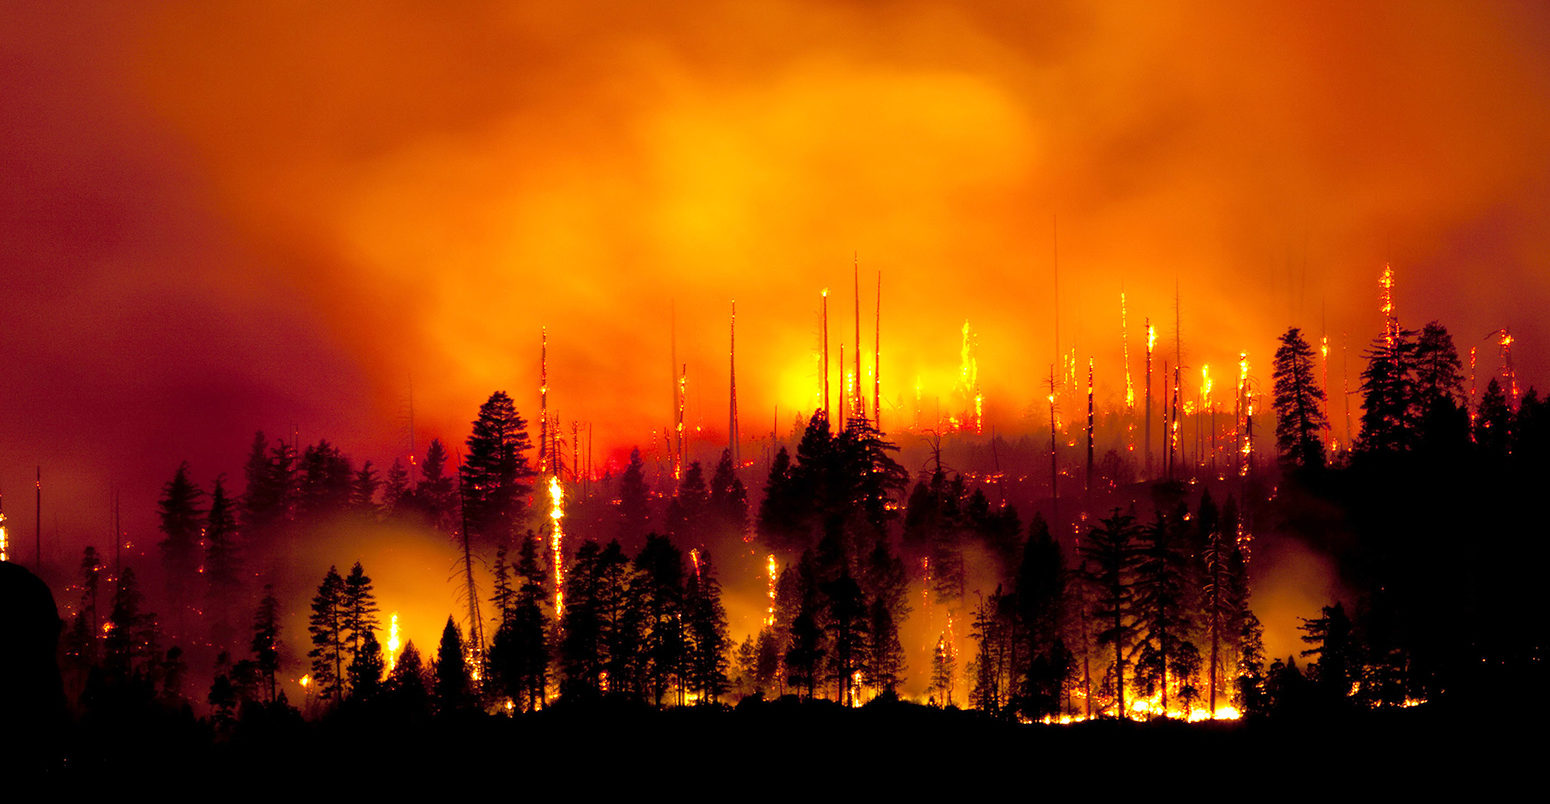
Most wildfires are triggered by humans – as much as 90% in the US, for example – while natural causes include lightning and lava. But the weather is the biggest driver of how far wildfires can spread. Temperature, humidity, rainfall and wind speed all play a role in providing the right conditions for a fire.
Wildfires play an important role in flammable ecosystems, such as forests, grasslands, savannahs, and shrublands. They can be managed to disperse plants, clear forests and promote grazing, or suppressed to protect human lives and property.
As plants burn, they release the carbon stored within their leaves, roots and trunks. This is why, on a large scale, wildfires can contribute CO2 to the atmosphere and, therefore, to the rate of climate change.
The new study, published in Nature Communications, estimates how annual wildfire emissions have been influenced by changes in land use and local population increases.
The research considers changes to wildfire emissions from unmanaged landscapes, such as forests, savannah and bushland. It does not consider peatland fires, which can lead to large releases of CO2.
It finds that the expansion of cropland into previously unmanaged areas has led to an overall decrease in the area burned by wildfires. This, in turn, has led to overall decrease in wildfire emissions.
However, this drop in emissions was largely counteracted by emissions from deforestation for cropland expansion, says lead author Dr Vivek Arora, a research scientist from the Canadian Centre for Climate Modelling and Analysis. He tells Carbon Brief:
“Our paper shows that, since the 1930s, increasing population densities and cropland area have led to a decrease in area burned by wildfires and an associated decrease in wildfires CO2 emissions.”
Looking back in time
For the study, the researchers used modelling to retrace annual wildfire emissions from 1850 to 2014.
As observed wildfires data from satellites only goes back to 1990s, the researchers used models to look further back in time and identify the influence of different factors that may have impacted wildfire emissions, says Arora:
“Models are mathematical representations of how nature works, but they are only as good as our understanding. However, they do allow us to go back in time – and into the future – and ask questions which we are not able to ask using observations alone.
“In this case, we asked how individual factors like increases in crop area and population densities over time have affected the global wildfire behaviour and what is the resulting effect on carbon uptake by land. These kind of model simulations allow us to tease out the effect of individual drivers.”
Inferring infernos
The chart below illustrates how wildfire emissions have changed from 1850 to 2014, according to the model results.
It shows the change in modelled fire emissions (right-hand axis of the chart) when only land use change is considered (orange line), when only changes to population density are considered (pink), and when the full range of factors are considered (red). Thick lines are used to shown 10-year averages.
For comparison, the black line shows actual annual fire CO2 emissions (left-hand axis) from 1997-2014. This satellite data was sourced from the Global Fire Emissions Database.
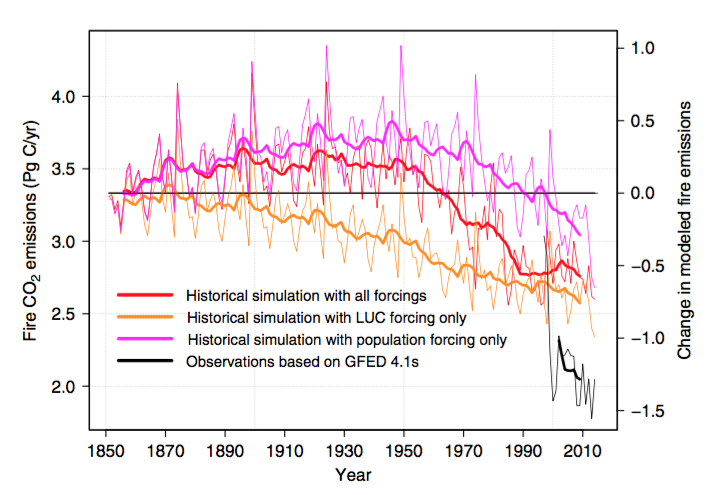
Historical simulations of global wildfire CO2 emissions from 1850-2014. Red shows fire emissions when a range of factors are considered, orange shows emissions when only land use change is considered and pink shows emissions when only changes to population density are considered. Black shows historical data taken from the Global Fire Emissions Database. Thick lines are used to shown 10-year averages. Source: Arora & Melton (2018)
The two largest factors influencing wildfire emissions included land use change, such as the conversion of forests to cropland, and local population increases, the researchers say.
In the model simulations with just land use change included, CO2 emissions fall most quickly. This is because expanding “permanent agriculture reduces the area potentially burned in natural and managed ecosystems”, the paper says.
Conversely, considering only the impact of changing population densities (pink line), CO2 emissions decline more slowly. This is because, as populations grow, they cause an increase in the number of wildfires, but also an increase in the number of fires that are successfully suppressed.
Changing landscape
When all factors are considered (red line), the simulations suggest that the point at which annual emissions start to decrease occurred at around 1950.
However, the research also finds that the ensuing decline is largely counteracted by a rise in emissions from deforestation over the same time period.
Despite these competing factors, the land continued to act as an overall carbon sink over the past few decades, says Arora:
“We show that the decrease in wildfires CO2 emissions associated with increasing population densities has led to an enhanced carbon uptake by land.”
In total, the global land area soaked up an average of around 477m tonnes of CO2 per year over the course of the study period, the study concludes. This is around equal to the annual CO2 emissions of Mexico.
Fanning the flames
The research is a good example of how models and observations can be combined to provide new insights into wildfires, says Prof Guido van der Werf from Vrije University in the Netherlands, who was not involved in the study. Van der Werf was part of a team that developed the Global Fire Emissions Database. He tells Carbon Brief:
“For me, one interesting aspect is that the carbon sink due to decreased fire is not so much in areas where the decline is largest but originates mostly from places with active fire suppression.”
However, one caveat of the new paper is that it does not consider whether wildfires have become more severe over the past few decades, says Prof David Bowman, a fire ecologist from the University of Tasmania, who was not involved in the study. He tells Carbon Brief:
“The entire argument hinges on area burned. Severity is the most important factor in understanding wildfire impacts – high severity forest fires are stand replacing [meaning that almost or all of the trees are killed] so a lot of carbon is lost.”
Previous research suggests that – at least in some parts of the world – wildfire severity has increased over the past few decades. The length of the wildfire season may also be increasing, research has shown.
On top of this, the conclusion that increases in population densities and deforestation lead to lower wildfire emissions may not hold true in all parts of the world, says Prof António Ferreira, coordinator at the Research Center for Natural Resources, Environment and Society in Portugal, who was also not involved in the study. He tells Carbon Brief:
“In the Mediterranean area, despite urbanisation and land use change to agriculture, the number of fires and burned area has increased immensely over the last few decades.
“We need a more elaborated model, with more variables. But the approach is innovative and is a step forward in linking fires to climate change.”
Arora, V. K. & Melton, J. R. (2018) Reduction in global area burned and wildfire emissions since 1930s enhances carbon uptake by land, doi:10.1038/s41467-018-03838-0
-
CO2 emissions from wildfires have fallen over past 80 years, study finds
-
Widescale conversion of forest to cropland has caused global wildfire emissions to fall