Eight charts show how ‘aggressive’ railway expansion could cut emissions
Jocelyn Timperley
01.30.19Jocelyn Timperley
30.01.2019 | 8:00amGlobal transport emissions could peak in the 2030s if railways are “aggressively” expanded, says the International Energy Agency (IEA).
Rail is among the most efficient and lowest emitting modes of transport, according to the IEA’s new report focusing on the opportunities it offers for energy and the environment.
In particular, urban and high-speed rail hold “major promise to unlock substantial benefits”, the report says, which include reducing greenhouse gas emissions, congestion and air pollution.
In a foreword to the report, Dr Fatih Birol, the IEA’s executive director, argues rail transport is “often neglected” in public debates about future transport systems. “Despite the advent of cars and airplanes, rail of all types has continued to evolve and thrive,” he says.
Carbon Brief takes a look at eight key charts from the report showing the status of rail in the world today – and how it could reduce emissions in future.
Energy-efficient rail
Rail transport is the most electrified transport sector, the IEA says. Globally, three-quarters of rail passenger movements and half of rail freight relies on electricity.
This means it is “uniquely positioned” to take advantage of the rise of renewables in the electricity mix.
It is also the most energy-efficient means of motorised passenger transport, and is far more efficient than road freight and aviation, as the chart below shows.
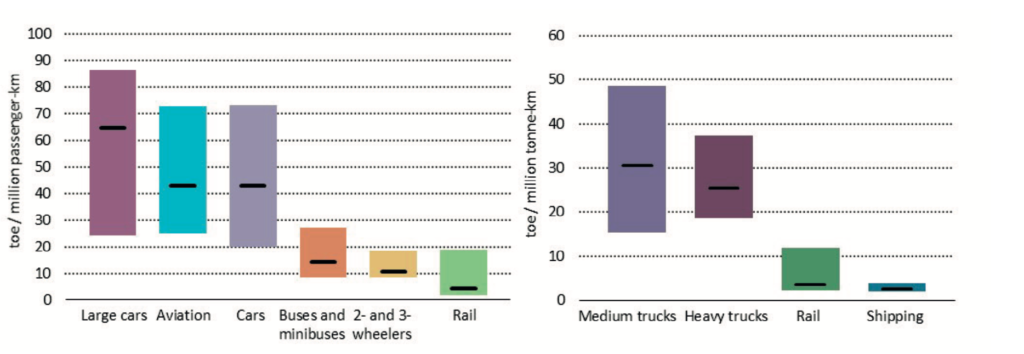
Energy intensity of different transport modes in 2017. The left-hand chart shows energy intensity of passenger transport, in tonnes of oil equivalent (toe) per million passenger km travelled. The right-hand chart shows energy intensity of freight transport, in toe per million tonne km transported. Source: IEA 2019.
Rail accounts for 8% of the world’s motorised passenger movements and 7% of freight transport, yet uses just 2% of the world’s transport energy demand, the report says.
Global rail energy demand has remained relatively constant in recent years, adds the report. Since 2000, it has fallen in the EU and Japan, increased in Russia, China and India, and stayed relatively constant in North America. Diesel freight trains account for roughly half of rail energy use, while electricity accounts for the rest.
It also acts as an “oil saver”, the IEA says. If all services performed by railways were instead carried by planes, cars and trucks, transport-related greenhouse gas (GHG) emissions would be 1.2bn tonnes of CO2-equivalent (GtCO2e) per year higher, the report says. This is equivalent to the CO2 emissions of the whole of Africa.
Low-emission rail
As it stands, around 0.3% of CO2 emissions from fossil fuels come from rail, says the report (this compares to around 2% for global aviation). However, the emissions from trains vary widely, depending on if they are powered by diesel or electricity, as well as how that electricity is generated.
Electric trains can reduce emissions compared with diesel-powered trains, says the IEA, but only if the power generation mix is not dependent on fuels with high carbon content, such as coal. This is shown in the chart below.

Average well-to-wheel (WTW) carbon intensities for diesel powertrains and electric powertrains using various primary sources, in grammes of CO2e per megajoule. Source: IEA 2019.
The report notes:
“The much lower carbon intensity of rail (per passenger- or tonne-km) compared with most other modes of transport, means the rail sector already plays a key role in containing global GHG emissions. Looking forward, efficient electric motors and increasingly low-carbon power mixes could enable rail to contribute substantially to achieving zero-emission mobility from a well-to-wheel (WTW) perspective.”
However, as the report notes, emissions from railway construction and maintenance must also be taken into account when assessing the capacity of rail projects to reduce greenhouse gas emissions. Railway lines – in particular, those with numerous tunnels, viaducts and bridges – use large amounts of concrete and steel.
According to the IEA, environmental life-cycle assessments show that the rail projects best able to reduce greenhouse gases (GHGs) are those that minimise the need for large amounts of steel, iron and concrete in construction; have a high passenger or freight throughput; and help to shift away from other modes of transport with even higher carbon intensities, such as car, trucks and aviation.
Regional differences
Most rail networks are located in India, China, Japan, Europe, North America and Russia, says the IEA. Meanwhile, metro and light rail networks operate in most of the world’s major cities.
Global conventional rail tracks have not significantly expanded over the past 20 years, says the IEA, but light, metro, and high-speed rail have all seen big rises, as the chart below shows.
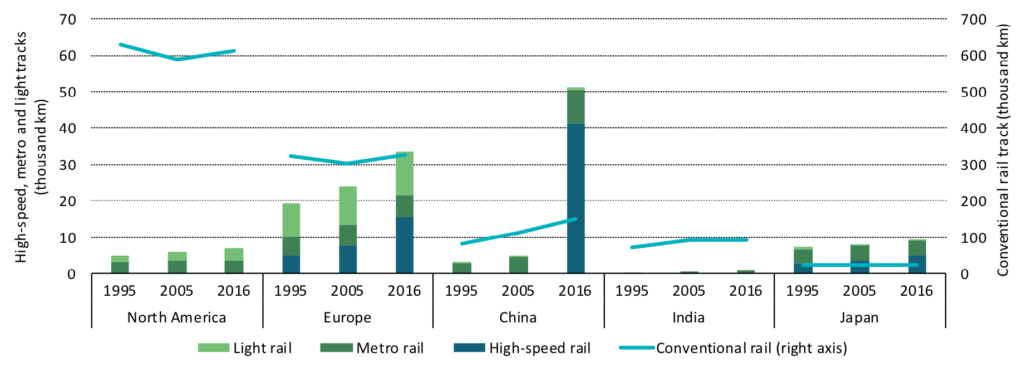
Track length by region from 1995-2016 for light rail (light green), metro rail (dark green), high-speed rail (dark blue) and conventional rail (light blue line). Note that conventional rail includes infrastructure used both by conventional passenger and freight rail.
The energy efficiency of trains also show large regional differences. Passenger trains are less energy efficient in the US and the EU than in Asia, primarily due to lower occupancy, as the chart below shows.
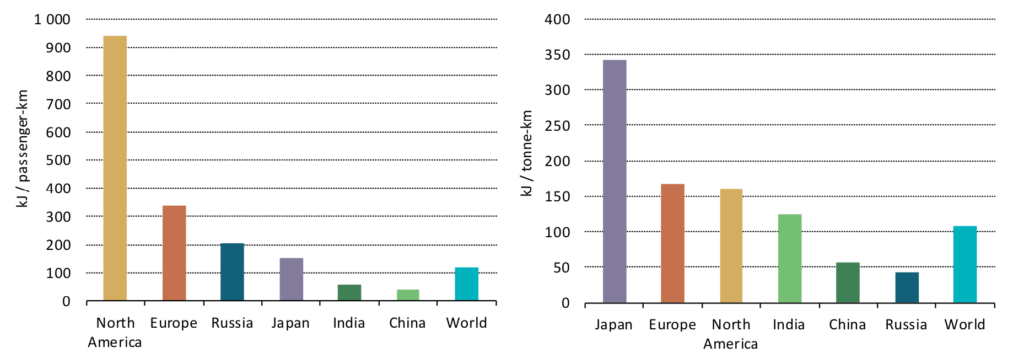
Energy intensities of passenger (left) and freight (right) rail in 2016. Source: IEA 2019.
Korea, Japan, Europe, China and Russia all have rail networks which are more than 60% electrified, with the highest share of track electrification being Korea at around 85%. North and South America, on the other hand, both have less than 5% rail electrification.
Global rail activity is slowly shifting towards electricity for both passenger and freight rail transport, adds the IEA.
High-speed rail
High-speed rail lines have expanded rapidly in recent years, says the IEA. This is especially the case in China, which has seen large investment in high-speed rail lines and urban rail networks. Networks in Europe and Japan have also expanded, as the chart below shows.
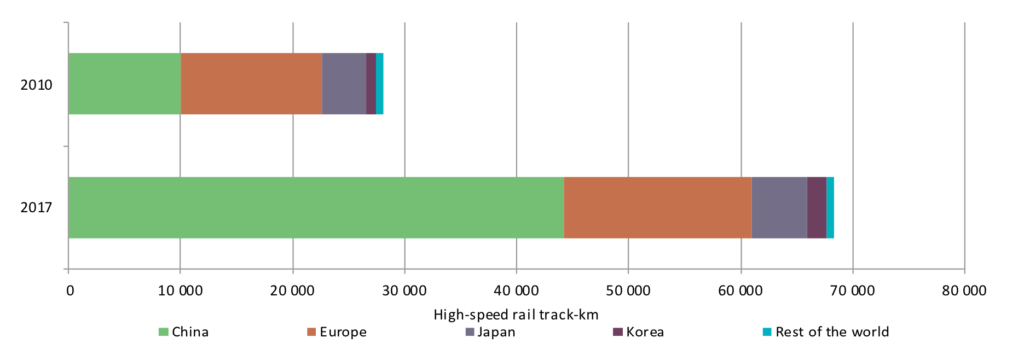
High-speed rail track length in key regions in 2010 and 2017. Source: IEA 2019.
Worldwide, around 600bn passenger km were travelled by high-speed rail in 2016, compared to around 100bn passenger km in 2000.
India is currently constructing its first high-speed line from Ahmedabad to Mumbai. Rail remains the primary transport mode in India and its rail activity is set to grow more than any other country, says the IEA.
High-speed rail is particularly important as it offers an established low-carbon alternative to short-distance flights, says the IEA. It says:
“As incomes rise, demand for passenger aviation, a mode of transport that is extremely difficult and expensive to decarbonise, will continue to grow rapidly.
“If designed with comfort and reliability as key performance criteria, high-speed rail can provide an attractive, low-emissions substitute to flying.”
The overall impact on GHG emissions of a new high-speed rail line depends on many factors, such as passenger behaviour and operational practices, says the report. But a new high-speed line can produce “almost immediate net CO2 benefits” by reducing air and car journeys, says the IEA.
High-speed rail lines can reduce aviation transport on the same routes by as much as 80%, says the IEA. The chart below shows the average change in passenger activity on selected air routes after new high-speed rail lines opened.

Average change in passenger activity on selected air routes after high-speed rail implementation. Source: IEA 2019.
For example, as the chart shows, the opening of the Brussels-London Eurostar reduced the number of km travelled by plane on that route by around 55%.
Urban rail also holds substantial promise to reduce emissions, the IEA says, though this varies substantially between regions. The emissions savings from metro rail construction, for example, will depend on whether it attracts commuters who would otherwise use a car, as well as the emissions intensity of its power supply, the report adds.
Freight expansion
Rail freight has risen steadily over the past 20 years and continues to expand in most countries, says the IEA. However, other forms of surface freight, such as trucks, are expanding faster, it adds. Most freight rail carries minerals, coal or agricultural products.
The US and China each account for about a quarter of global rail freight activity and Russia about a fifth, says the report. In some countries freight train transport vastly outweighs passenger rail. In the US, for example, around 93% of kilometres travelled by train are for freight rather than passengers. Around a third of this is for the transport of coal.
Rail uses around 90% less energy than trucks per unit of freight and is the “only transport mode offering serious competition with trucks for land-based freight”, says the IEA. Freight trains in Russia and China are the most energy efficient due to high loading and electrification, adds the IEA.
The chart below shows the potential for new freight rail lines to reduce emissions compared to road transport. In a “high potential” case, where rail construction has low emissions, trains are efficient and low carbon, and train occupancy is high, reductions in GHG emissions are seen after just two years. However, even in a “low potential” case, GHG reductions are seen after 24 years.

Annual life-cycle total GHG emissions, emissions savings and time needed to compensate upfront emissions from the building of a new freight train line in high, medium and low potential cases. Source: IEA 2019.
High-rail scenario
The IEA sets out two scenarios for rail expansion up to 2050 in its report. The emissions resulting from these two scenarios are shown in the chart below.
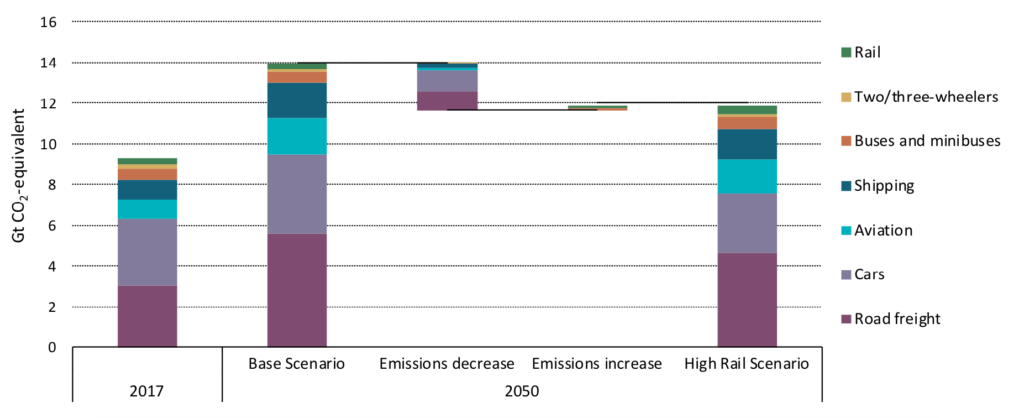
Well-to-wheel GHG emissions from transport in the IEA’s “base” and “high-rail” scenarios. Source: IEA 2019.
In the “base scenario”, which assumes no significant new emphasis on rail in policymaking, annual investment in rail infrastructure increases to $330bn in 2050. The global track length of metros and high-speed rail both expand by 2.5 times. However, rail does no more worldwide than maintain its current share in activity relative to cars and air travel by 2050.
In this case, global transport emissions would continue to increase out to 2050 and beyond.
In the “high-rail” scenario, meanwhile, annual average investment reaches $770bn by 2050. The track length of high-speed rail increases by around 3.5 times, while metro tracks increase four-fold. Global passenger activity on rail is 60% higher than in the base scenario.
Significant emphasis is put on policy-making which encourages rail travel in this scenario.
First, policies are implemented to minimise the costs of rail travel by ensuring maximum rail network usage and working to remove technical barriers.
Second, efforts are made to maximise rail revenues, such as by capitalising on the increase in value in homes and businesses due to rail expansion.
A third set of policies ensures that all forms of transport pays for their societal and environmental impacts, such as through fuel taxes and congestion charges.
In combination, these policies lead to greenhouse gases from global transport being 0.6 GtCO2e per year lower than in the base scenario, roughly the annual emissions of South Korea. This “aggressive, strategic deployment” of rail would see CO2 emissions from global transport peak in the late 2030s, says the IEA.
Achieving this scenario is an “ambitious, yet achievable undertaking”, a spokesperson for the IEA tells Carbon Brief. They add:
“It would require significant and strategic investments on the part of companies working directly and indirectly in the rail sector, coordinated with ambitious policy action on the part of local and national governments.”
Responding to the report, Prof Clive Roberts, director of the Birmingham Centre for Railway Research and Education at the University of Birmingham, says the rail sector has “huge potential to embrace new energy and digital technologies”. He tells Carbon Brief:
“The [IEA] report comes at a time when the international railway industry needs to come together to develop a strategy to ensure the railway sector continues to retain its energy efficient status, ensuring rail contributes fully to future mobility.”
-
Eight charts show how ‘aggressive’ railway expansion could cut emissions
-
How 'aggressive' railway expansion could cut emissions in eight charts