Energy return on investment – which fuels win?
Carbon Brief Staff
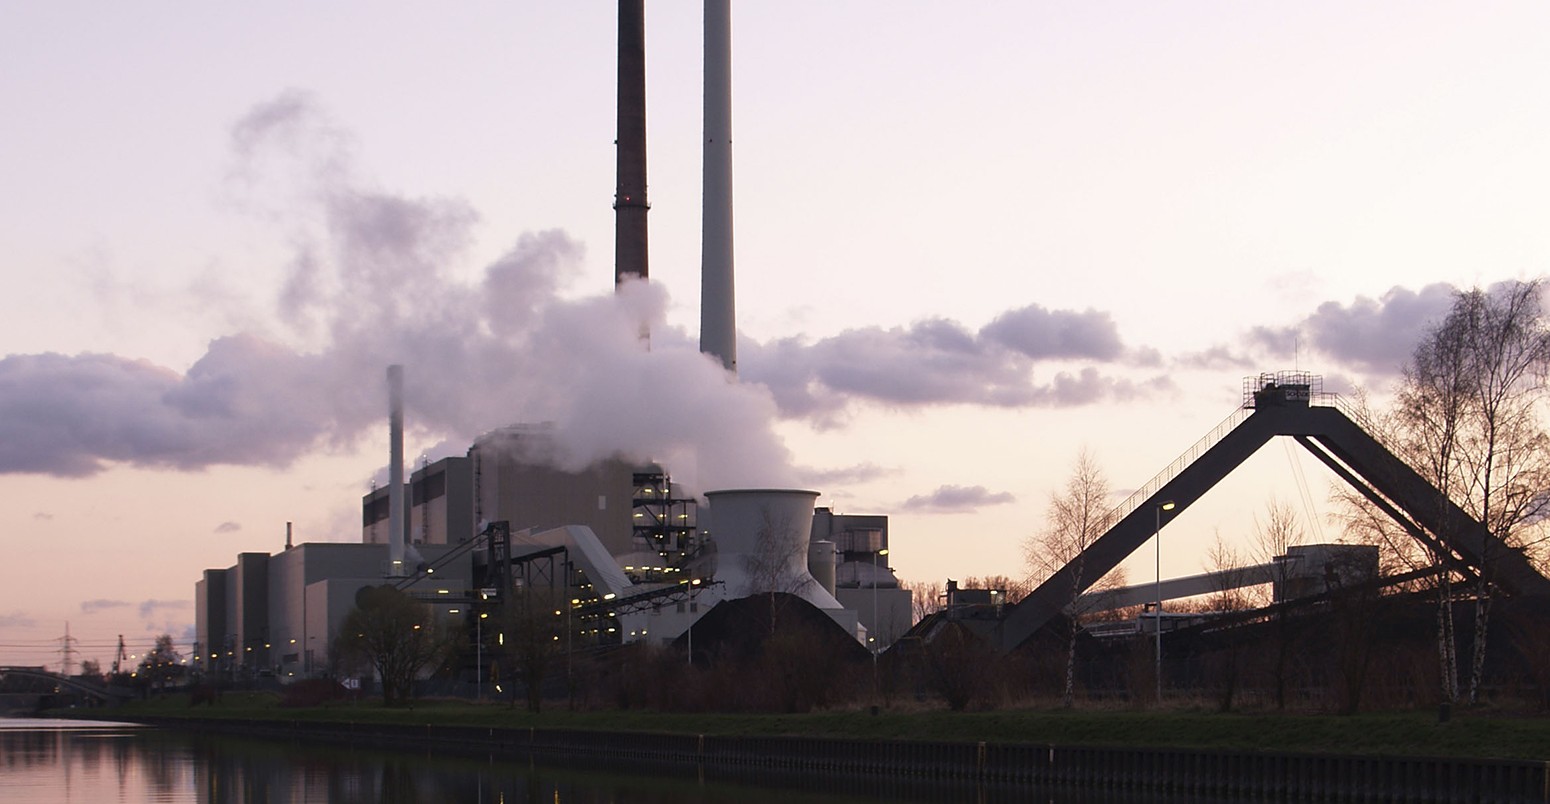
03.20.13Image: Datteln coal power plant. Credit: Arnold Paul.
The days of easy to extract fossil fuels are numbered. Companies are using more energy-intensive methods to get to conventional fossil fuels, and turning to harder-to-extract fuels such as shale gas. But do these sources give us a good return on the energy we invest? A new article investigates how assessing this return could help us make decisions about our energy future.
The feature in Scientific American compiles a range of sources to look at which energy sources provide the most energy compared the the amount of energy it takes to extract them – called their energy return on investment (EROI). We take a look at the returns different fuels offer – and examine some other considerations to take into account when choosing how to meet energy demand.
Energy return on investment
Professor Charles Hall, an ecologist at the SUNY College of Environmental Science and Forestry, developed the concept of EROI to give a common measure for comparing very different fuels.
Finding out fuels’ EROI means working out how much energy it takes to make the materials usable – like finding oil, drilling the well, pumping it out and refining it – and how much energy you get afterwards. It’s a simple equation – you divide the energy output by the energy input. A high EROI means you get a lot of energy out for very little energy expended.
This infographic puts hydroelectricity, wind and coal as the best performers, while natural gas, solar and nuclear deliver a much lower return on this measure:
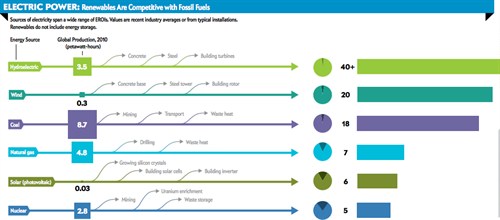
Source: Scientific American
The reason hydroelectric and wind power do so well on this measure is mainly due to the relatively small amounts of energy needed to build dams and turbines – at least compared to building a nuclear power plant. Coal is relatively easy to extract in energy terms and has an EROI comparable to wind power, according to this study.
The processes involved in building and managing nuclear power – such as mining, uranium enrichment and waste storage – are all very energy intensive. This makes it a poor electricity generation choice in terms of energy return on investment. Solar panels are energy-intensive to manufacture, so have a similarly low EROI – although the article’s author, Mason Inman, tells us it is going up.
It’s worth noting, however, that the range of estimates for nuclear’s EROI is very large indeed, ranging from an estimated 40 to 60 – from the World Nuclear Association – to less than one. Inman tells us he used a paper that reviewed many studies, which puts nuclear’s EROI at five.
So does this mean the world should give up on conventional oil and invest in hydroelectric power instead? Not necessarily – there are some other considerations the EROI calculations don’t address.
Calculation complications
As is often the case when comparing energy sources, deciding which is best depends what you include in the calculations.
For example, with the higher-EROI sources – hydro, wind, and coal – other considerations like generation intermittency and regulatory environments become more important than the amount of energy needed to get a return, Inman tells Carbon Brief. For example, if grids can’t be adjusted to deal with intermittent supply from renewable sources like wind, that makes these sources more expensive – and potentially reduces their EROI if a lot of gas-fired power is needed for backup generation.
Equally, the calculations don’t include the environmental costs of the different energy sources – like those related to greenhouse gas emissions. If the US brought in a carbon tax, coal would become far more expensive to burn by requiring the installation of expensive carbon capture technology, for example, making it less attractive from an economic perspective. Inman notes that EROI can “highlight how efforts to cut pollution […] can drastically affect a fuel’s affordability”.
What’s more, there is more than one type of EROI measurement. Inman tells us he reviewed a wide range of literature, but settled on the measurements that seemed most consistent with each other as the basis of his calculations. We’ve included Inman’s full list of references below.
One key difference between EROI calculations is what is considered as an energy input. For example, some tar sands production uses the tar sands themselves as sources of energy for some of the process – classed as ‘internal’ inputs. Inman says he only used ‘external’ energy inputs – those that have to be taken from outside of the process itself, or “that society puts in”.
So the return we get from different energy sources can be a useful measure when choosing which to build into our energy mix, telling us how much energy to expect from them. As Inman says in the article, taking EROI into account means “investment can be guided to the sources that most effectively keep the economy humming and that can also help build a sustainable future”.
EROI isn’t the only factor that needs to be considered when picking the best fuels, but it highlights the fact that we’re having to expend more and more energy to meet demand – and spend more money on keeping emissions down. This could become even more of a problem in the future.
Sources
Mason Inman kindly shared his list of sources with us, along with some notes. Scientific American has also published a blog in which Inman discusses how he calculated the different EROIs and an interview with Charles Hall.
- Conventional oil: M. C. Guilford et al., “A New Long Term Assessment of Energy Return on Investment (EROI) for U.S. Oil and Gas Discovery and Production,” in Sustainability (2011).
- Ethanol from sugarcane: I. C. Macedo et al., “Green house gases emissions in the production and use of ethanol from sugarcane in Brazil: The 2005/2006 averages and a prediction for 2020,” Biomass and Bioenergy (2008).
- Biodiesel from soybeans: A. Pradhan et al.: ” Energy Life-Cycle Assessment of Soybean Biodiesel Revisited,”Transactions of the American Society of Agricultural and Biological Engineers (2011).
- Tar sands: There are no peer-reviewed, published estimates of the EROI for tar sands, as far as I could tell. Inman drew on a paper by Adam Brandt of Stanford University (Adam Brandt et al., “The energy efficiency of oil sands extraction: Energy return ratios from 1970 to 2010,” under review byEnergy). The paper reports various types of EROIs for tar sands, and Inman used the number for the external energy ratio for refined fuels.
- Heavy oil from California: Adam Brandt, “Oil Depletion and the Energy Efficiency of Oil Production: The Case of California,” Sustainability (2011). Note: this is for California only; there is no accepted definition of “heavy oil,” and the value may be different for other countries (such as Venezuela), which may use different technologies for extraction and refining.
- Corn ethanol: There have been heated arguments over what the EROI is for corn ethanol, such as a 2006 exchange in Science. But all seem to agree that its EROI is less than two-which puts it at the bottom of the heap for liquid fuels. I drew on a meta-analysis that averaged six different estimates, giving an EROI of 1.4. Hammerschlag, “Ethanol’s Energy Return on Investment: A Survey of the Literature 1990-Present,” Environmental Science & Technology(2006) (link).
For sources of electricity, Inman says he used values that are for electricity produced by a particular source, rather than the EROI for the production of the raw fuel that can be used to make electricity. So in the case of coal, for example, the EROI for the coal itself would be roughly three times higher than the EROI for electricity from coal (because the typical efficiency of a coal-fired power plant is around 33 percent).
- Hydroelectric: There are a wide range of EROI values reported for hydroelectric dams, from around 40 to more than 250. To reflect this range, Inman says he reported the value as “40+”. See, for example, Gagnon et al., “Life-cycle assessment of electricity generation options: The status of research in year 2001,”Energy Policy (2002).
- Wind: Inman says he used a meta-analysis of 50 studies, including 119 different wind farms or turbines. Kubiszewski et al., “Meta-analysis of net energy return for wind power systems,”Renewable Energy (2010).
- Coal: Most studies on the EROI of coal report the value at the “minemouth,” for all the energy content in the coal. To make it comparable with other electricity sources, especially renewables, Inman used the EROI for electricity from coal. One particular focused on solar power, but compared it with fossil fuels: Raugei et al.,”The energy return on energy investment (EROI) of photovoltaics,” Energy Policy (2012). The EROI figure there was consistent with what you would get from a back-of-the-envelope calculation, dividing the minemouth EROI for coal by three, to account for the losses of energy in a power plant (personal communication, Charles Hall of S.U.N.Y. Environmental Science and Forestry).
- Solar (PV): There are a wide variety of estimates of solar PV’s EROI as well-in part because the technologies and production techniques are improving fast, a major reason for the large price reductions over the past decade. Inman used the most recent peer-reviewed study he could find – Raugei et al., 2012, cited above. Solar PV’s EROI is almost certainly rising (Raugei et al., 2012; personal communication, Michael Dale of Stanford University). The latest data in Raugei’s study was at least a couple of years old, so the EROI today is most likely higher than 6, the number cited in the article, Inman tells us.
- Natural gas: Inman says it was difficult to find an EROI estimate for natural gas because data for natural gas is typically reported along with that of oil. For the EROI figure of 7, Inman used an alternative measure devised by Carey King of the University of Texas at Austin that he calls the “energy intensity ratio,” and which is comparable with the EROI. King’s value for the energy intensity ratio of electricity from natural gas is also consistent with what a back-of-the-envelope calculation would give, using an EROI of oil and natural gas of 20 at the wellhead, and adjusted to take into account the typical efficiency of a natural gas power plant (around 40 percent to 45 percent). King, “Energy intensity ratios as net energy measures of United States energy production and expenditures,”Environmental Research Letters (2010).
- Nuclear: As with hydroelectricity, the EROI estimates for nuclear power span a very large range. Some claim that the EROI is actually less than 1-which would mean that the whole process is not a source of energy, but rather a sink-whereas others (such as the World Nuclear Association, an industry group) estimate that the EROI is much higher than perhaps any other source of energy, around 40 to 60 when using centrifuge enrichment. Inman drew on a paper that reviewed many studies, and estimated the EROI to be 5. Lenzen, “Life cycle energy and greenhouse gas emissions of nuclear energy: A review,”Energy Conversion and Management (2008).